Free Statistics
of Irreproducible Research!
Description of Statistical Computation | |||||||||||||||||||||||||||||||||||||||||||||||||
|---|---|---|---|---|---|---|---|---|---|---|---|---|---|---|---|---|---|---|---|---|---|---|---|---|---|---|---|---|---|---|---|---|---|---|---|---|---|---|---|---|---|---|---|---|---|---|---|---|---|
| Author's title | |||||||||||||||||||||||||||||||||||||||||||||||||
| Author | *The author of this computation has been verified* | ||||||||||||||||||||||||||||||||||||||||||||||||
| R Software Module | rwasp_regression_trees1.wasp | ||||||||||||||||||||||||||||||||||||||||||||||||
| Title produced by software | Recursive Partitioning (Regression Trees) | ||||||||||||||||||||||||||||||||||||||||||||||||
| Date of computation | Wed, 22 Dec 2010 20:37:43 +0000 | ||||||||||||||||||||||||||||||||||||||||||||||||
| Cite this page as follows | Statistical Computations at FreeStatistics.org, Office for Research Development and Education, URL https://freestatistics.org/blog/index.php?v=date/2010/Dec/22/t1293050127rak9n7hoxsufz0z.htm/, Retrieved Mon, 06 May 2024 06:19:36 +0000 | ||||||||||||||||||||||||||||||||||||||||||||||||
| Statistical Computations at FreeStatistics.org, Office for Research Development and Education, URL https://freestatistics.org/blog/index.php?pk=114574, Retrieved Mon, 06 May 2024 06:19:36 +0000 | |||||||||||||||||||||||||||||||||||||||||||||||||
| QR Codes: | |||||||||||||||||||||||||||||||||||||||||||||||||
|
| |||||||||||||||||||||||||||||||||||||||||||||||||
| Original text written by user: | |||||||||||||||||||||||||||||||||||||||||||||||||
| IsPrivate? | No (this computation is public) | ||||||||||||||||||||||||||||||||||||||||||||||||
| User-defined keywords | |||||||||||||||||||||||||||||||||||||||||||||||||
| Estimated Impact | 157 | ||||||||||||||||||||||||||||||||||||||||||||||||
Tree of Dependent Computations | |||||||||||||||||||||||||||||||||||||||||||||||||
| Family? (F = Feedback message, R = changed R code, M = changed R Module, P = changed Parameters, D = changed Data) | |||||||||||||||||||||||||||||||||||||||||||||||||
| - [Recursive Partitioning (Regression Trees)] [] [2010-12-05 18:59:57] [b98453cac15ba1066b407e146608df68] - PD [Recursive Partitioning (Regression Trees)] [WS 10 - recursive...] [2010-12-11 16:07:41] [033eb2749a430605d9b2be7c4aac4a0c] - P [Recursive Partitioning (Regression Trees)] [WS 10 - recursive...] [2010-12-11 16:27:23] [033eb2749a430605d9b2be7c4aac4a0c] - P [Recursive Partitioning (Regression Trees)] [] [2010-12-13 18:26:49] [d7b28a0391ab3b2ddc9f9fba95a43f33] - [Recursive Partitioning (Regression Trees)] [] [2010-12-21 19:11:15] [42a441ca3193af442aa2201743dfb347] - PD [Recursive Partitioning (Regression Trees)] [] [2010-12-22 17:21:28] [f82dc80ca9fc4fd83b66f6024d510f8c] - PD [Recursive Partitioning (Regression Trees)] [] [2010-12-22 20:37:43] [9d4f9c24554023ef0148ede5dd3a4d11] [Current] | |||||||||||||||||||||||||||||||||||||||||||||||||
| Feedback Forum | |||||||||||||||||||||||||||||||||||||||||||||||||
Post a new message | |||||||||||||||||||||||||||||||||||||||||||||||||
Dataset | |||||||||||||||||||||||||||||||||||||||||||||||||
| Dataseries X: | |||||||||||||||||||||||||||||||||||||||||||||||||
5 4 3 2 12 4 4 3 2 11 5 5 5 2 15 2 2 2 1 6 4 5 4 2 13 3 3 4 2 10 5 3 4 2 12 5 5 4 2 14 4 3 5 2 12 3 3 NA 2 6 2 4 4 1 10 4 4 4 2 12 4 4 4 1 12 4 3 4 2 11 5 5 5 2 15 5 4 3 1 12 4 4 2 1 10 4 4 4 2 12 4 4 3 1 11 4 4 4 2 12 4 4 3 1 11 4 4 4 2 12 5 4 4 2 13 3 4 4 2 11 5 NA 4 1 9 4 4 5 2 13 4 3 3 1 10 5 5 4 2 14 4 4 4 2 12 3 4 3 1 10 4 4 4 2 12 4 2 2 1 8 4 3 3 2 10 4 4 4 2 12 4 4 4 1 12 2 2 3 1 7 3 NA 3 1 6 4 4 4 1 12 3 4 3 2 10 4 3 3 1 10 2 4 4 1 10 4 4 4 2 12 5 5 5 1 15 4 3 3 1 10 4 4 2 2 10 4 4 4 2 12 5 4 4 2 13 3 4 4 2 11 4 4 3 2 11 4 4 4 1 12 5 5 4 2 14 3 3 4 1 10 4 4 4 1 12 5 4 4 2 13 2 1 2 1 5 2 2 2 2 6 4 4 4 2 12 4 4 4 2 12 4 3 4 1 11 4 3 3 2 10 2 2 3 1 7 4 4 4 1 12 5 5 4 2 14 3 4 4 2 11 4 4 4 2 12 5 4 4 1 13 5 5 4 2 14 4 4 3 1 11 4 4 4 2 12 4 4 4 1 12 2 3 3 1 8 3 4 4 2 11 5 5 4 2 14 4 5 5 1 14 4 4 4 1 12 3 2 4 2 9 4 4 5 2 13 3 4 4 2 11 4 4 4 1 12 4 4 4 1 12 4 4 4 1 12 4 4 4 1 12 4 4 4 2 12 4 4 4 1 12 4 4 3 2 11 3 4 3 2 10 4 3 2 1 9 4 4 4 2 12 4 4 4 2 12 4 4 4 2 12 3 3 3 2 9 5 5 5 2 15 4 4 4 2 12 4 4 4 2 12 4 4 4 2 12 4 4 2 2 10 5 4 4 2 13 4 3 2 2 9 4 4 4 1 12 2 4 4 1 10 5 5 4 2 14 4 4 3 1 11 5 5 5 2 15 4 4 3 1 11 4 4 3 2 11 4 4 4 1 12 4 4 4 2 12 4 4 4 1 12 4 3 4 1 11 2 4 1 2 7 4 4 4 2 12 5 5 4 2 14 4 4 3 2 11 4 3 4 1 11 2 4 4 2 10 5 4 4 1 13 5 5 3 2 13 2 2 4 2 8 4 4 3 2 11 4 4 4 2 12 4 4 3 2 11 5 4 4 2 13 4 4 4 2 12 5 5 4 2 14 5 4 4 2 13 5 5 5 2 15 3 3 4 1 10 4 4 3 2 11 4 3 2 2 9 4 4 3 2 11 3 4 3 1 10 4 4 3 1 11 4 2 2 2 8 4 4 3 1 11 4 4 4 1 12 4 4 4 2 12 4 3 2 1 9 4 4 3 1 11 3 4 3 2 10 2 3 3 2 8 2 3 4 1 9 4 2 2 2 8 2 4 3 1 9 5 5 5 2 15 3 4 4 1 11 2 4 2 2 8 5 4 4 2 13 4 4 4 1 12 4 4 4 1 12 2 3 4 1 9 3 2 2 2 7 5 4 4 2 13 4 2 3 1 9 2 2 2 2 6 2 3 3 2 8 2 3 3 2 8 5 5 5 2 15 2 2 2 2 6 4 3 2 2 9 4 4 3 2 11 2 2 4 2 8 2 3 3 2 8 | |||||||||||||||||||||||||||||||||||||||||||||||||
Tables (Output of Computation) | |||||||||||||||||||||||||||||||||||||||||||||||||
| |||||||||||||||||||||||||||||||||||||||||||||||||
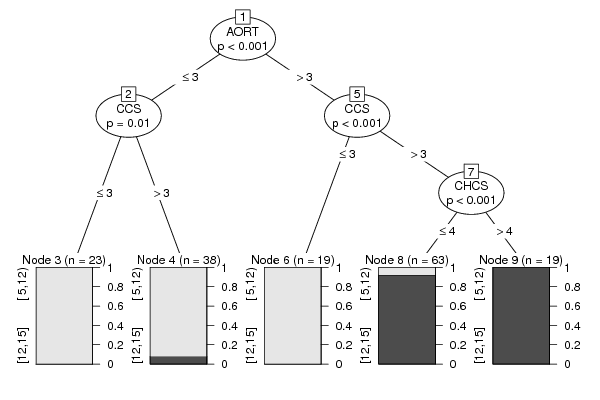
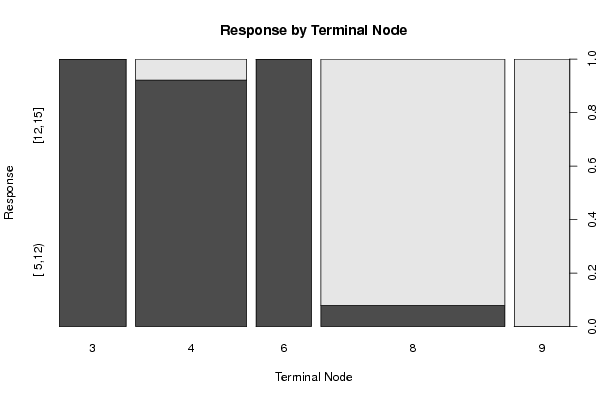
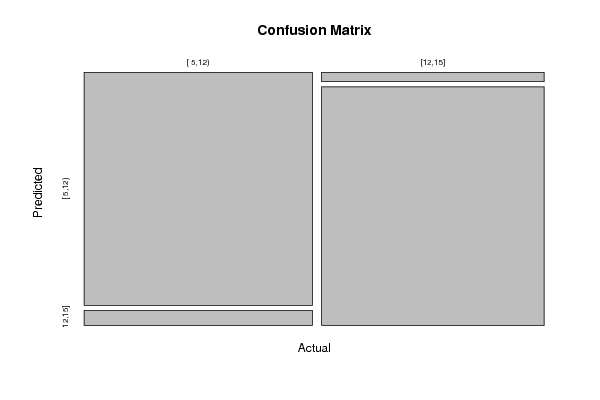
Figures (Output of Computation) | |||||||||||||||||||||||||||||||||||||||||||||||||
Input Parameters & R Code | |||||||||||||||||||||||||||||||||||||||||||||||||
| Parameters (Session): | |||||||||||||||||||||||||||||||||||||||||||||||||
| par1 = 5 ; par2 = quantiles ; par3 = 2 ; par4 = no ; | |||||||||||||||||||||||||||||||||||||||||||||||||
| Parameters (R input): | |||||||||||||||||||||||||||||||||||||||||||||||||
| par1 = 5 ; par2 = quantiles ; par3 = 2 ; par4 = no ; | |||||||||||||||||||||||||||||||||||||||||||||||||
| R code (references can be found in the software module): | |||||||||||||||||||||||||||||||||||||||||||||||||
library(party) | |||||||||||||||||||||||||||||||||||||||||||||||||