| Multiple Linear Regression - Estimated Regression Equation |
| PS[t] = + 5.37427458453137 -0.393161874372465D[t] -1.25726326411256logtg[t] + e[t] |
| Multiple Linear Regression - Ordinary Least Squares | |||||
| Variable | Parameter | S.D. | T-STAT H0: parameter = 0 | 2-tail p-value | 1-tail p-value |
| (Intercept) | 5.37427458453137 | 0.628555 | 8.5502 | 0 | 0 |
| D | -0.393161874372465 | 0.113081 | -3.4768 | 0.001193 | 0.000597 |
| logtg | -1.25726326411256 | 0.345668 | -3.6372 | 0.000747 | 0.000374 |
| Multiple Linear Regression - Regression Statistics | |
| Multiple R | 0.707980306510684 |
| R-squared | 0.501236114406963 |
| Adjusted R-squared | 0.477485453188247 |
| F-TEST (value) | 21.1040909468229 |
| F-TEST (DF numerator) | 2 |
| F-TEST (DF denominator) | 42 |
| p-value | 4.52683840967971e-07 |
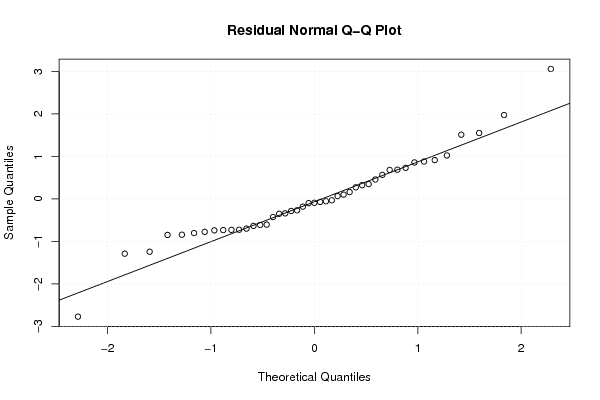
| Multiple Linear Regression - Residual Statistics | |
| Residual Standard Deviation | 0.995595347167661 |
| Sum Squared Residuals | 41.6308240026796 |
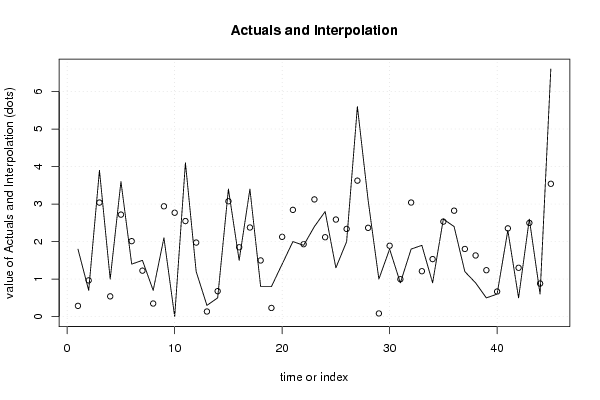
| Multiple Linear Regression - Actuals, Interpolation, and Residuals | |||
| Time or Index | Actuals | Interpolation Forecast | Residuals Prediction Error |
| 1 | 1.8 | 0.287344185620995 | 1.51265581437901 |
| 2 | 0.7 | 0.96615581594191 | -0.266155815941910 |
| 3 | 3.9 | 3.03981268114758 | 0.860187318852421 |
| 4 | 1 | 0.541183781667479 | 0.458816218332521 |
| 5 | 3.6 | 2.71886793827309 | 0.88113206172691 |
| 6 | 1.4 | 2.01179906212406 | -0.611799062124065 |
| 7 | 1.5 | 1.22522054656625 | 0.274779453433746 |
| 8 | 0.7 | 0.349582300380776 | 0.350417699619224 |
| 9 | 2.1 | 2.94026100934512 | -0.84026100934512 |
| 10 | 0 | 2.76849220604468 | -2.76849220604468 |
| 11 | 4.1 | 2.54709913497265 | 1.55290086502735 |
| 12 | 1.2 | 1.97387263575887 | -0.773872635758872 |
| 13 | 0.3 | 0.136990774967699 | 0.163009225032301 |
| 14 | 0.5 | 0.679874884889633 | -0.179874884889633 |
| 15 | 3.4 | 3.07405501557671 | 0.325944984423292 |
| 16 | 1.5 | 1.84881517467548 | -0.348815174675481 |
| 17 | 3.4 | 2.37533033167222 | 1.02466966832778 |
| 18 | 0.8 | 1.49768094956778 | -0.697680949567781 |
| 19 | 0.8 | 0.232191647012272 | 0.567808352987728 |
| 20 | 1.4 | 2.12640115959281 | -0.726401159592806 |
| 21 | 2 | 2.84506013730055 | -0.845060137300546 |
| 22 | 1.9 | 1.93034924174817 | -0.0303492417481738 |
| 23 | 2.4 | 3.12398241960757 | -0.723982419607573 |
| 24 | 2.8 | 2.11626559979061 | 0.683734400209387 |
| 25 | 1.3 | 2.58705903502503 | -1.28705903502503 |
| 26 | 2 | 2.33765867086264 | -0.337658670862643 |
| 27 | 5.6 | 3.62429777424389 | 1.97570222575611 |
| 28 | 3.1 | 2.36703451013134 | 0.732965489868663 |
| 29 | 1 | 0.084949272714216 | 0.915050727285784 |
| 30 | 1.8 | 1.88970289604161 | -0.0897028960416137 |
| 31 | 0.9 | 0.997365596188724 | -0.097365596188724 |
| 32 | 1.8 | 3.04095260904621 | -1.24095260904621 |
| 33 | 1.9 | 1.21078739437342 | 0.689212605626581 |
| 34 | 0.9 | 1.53343094129818 | -0.633430941298177 |
| 35 | 2.6 | 2.53241121470968 | 0.0675887852903247 |
| 36 | 2.4 | 2.82364474465341 | -0.423644744653407 |
| 37 | 1.2 | 1.80330902995035 | -0.603309029950349 |
| 38 | 0.9 | 1.63063816541727 | -0.730638165417271 |
| 39 | 0.5 | 1.23747629104481 | -0.737476291044806 |
| 40 | 0.6 | 0.668917543857815 | -0.068917543857815 |
| 41 | 2.3 | 2.35234659112562 | -0.0523465911256214 |
| 42 | 0.5 | 1.30178847782212 | -0.801788477822116 |
| 43 | 2.6 | 2.49742649649741 | 0.102573503502594 |
| 44 | 0.6 | 0.881986076224654 | -0.281986076224654 |
| 45 | 6.6 | 3.54012803452664 | 3.05987196547336 |
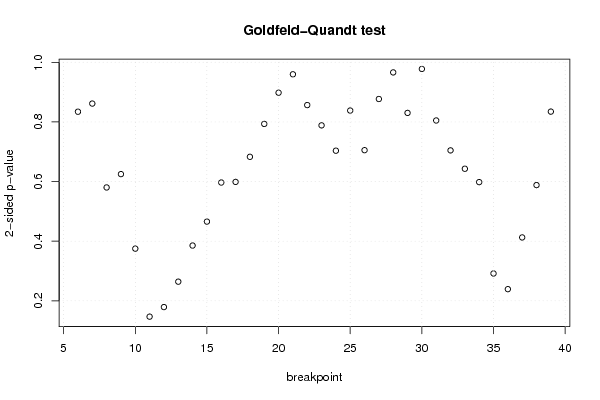
| Goldfeld-Quandt test for Heteroskedasticity | |||
| p-values | Alternative Hypothesis | ||
| breakpoint index | greater | 2-sided | less |
| 6 | 0.582898298015194 | 0.834203403969612 | 0.417101701984806 |
| 7 | 0.430792153959006 | 0.861584307918013 | 0.569207846040994 |
| 8 | 0.290113864436845 | 0.58022772887369 | 0.709886135563155 |
| 9 | 0.31250691964321 | 0.62501383928642 | 0.68749308035679 |
| 10 | 0.812505525824351 | 0.374988948351297 | 0.187494474175649 |
| 11 | 0.926560805113733 | 0.146878389772534 | 0.0734391948862672 |
| 12 | 0.910484013374705 | 0.179031973250590 | 0.0895159866252952 |
| 13 | 0.867892145673949 | 0.264215708652102 | 0.132107854326051 |
| 14 | 0.807314362558667 | 0.385371274882667 | 0.192685637441333 |
| 15 | 0.767137906471659 | 0.465724187056682 | 0.232862093528341 |
| 16 | 0.701642805209888 | 0.596714389580223 | 0.298357194790112 |
| 17 | 0.700589922293638 | 0.598820155412724 | 0.299410077706362 |
| 18 | 0.658508990043937 | 0.682982019912126 | 0.341491009956063 |
| 19 | 0.603344267667049 | 0.793311464665902 | 0.396655732332951 |
| 20 | 0.551021998204235 | 0.89795600359153 | 0.448978001795765 |
| 21 | 0.52014520288054 | 0.95970959423892 | 0.47985479711946 |
| 22 | 0.428260188523937 | 0.856520377047875 | 0.571739811476063 |
| 23 | 0.394245988444074 | 0.788491976888148 | 0.605754011555926 |
| 24 | 0.351756560491984 | 0.703513120983968 | 0.648243439508016 |
| 25 | 0.419068328444609 | 0.838136656889218 | 0.580931671555391 |
| 26 | 0.35260163203183 | 0.70520326406366 | 0.64739836796817 |
| 27 | 0.561559474661314 | 0.876881050677372 | 0.438440525338686 |
| 28 | 0.516979748049689 | 0.966040503900621 | 0.483020251950311 |
| 29 | 0.584881986660874 | 0.830236026678251 | 0.415118013339126 |
| 30 | 0.488828572861445 | 0.97765714572289 | 0.511171427138555 |
| 31 | 0.402400331476086 | 0.804800662952172 | 0.597599668523914 |
| 32 | 0.647718749308467 | 0.704562501383066 | 0.352281250691533 |
| 33 | 0.678529479194205 | 0.64294104161159 | 0.321470520805795 |
| 34 | 0.700963114645347 | 0.598073770709306 | 0.299036885354653 |
| 35 | 0.854150166087852 | 0.291699667824297 | 0.145849833912148 |
| 36 | 0.880463047014493 | 0.239073905971014 | 0.119536952985507 |
| 37 | 0.793702708170998 | 0.412594583658003 | 0.206297291829002 |
| 38 | 0.705944174601543 | 0.588111650796915 | 0.294055825398457 |
| 39 | 0.582716804937069 | 0.83456639012586 | 0.41728319506293 |
| Meta Analysis of Goldfeld-Quandt test for Heteroskedasticity | |||
| Description | # significant tests | % significant tests | OK/NOK |
| 1% type I error level | 0 | 0 | OK |
| 5% type I error level | 0 | 0 | OK |
| 10% type I error level | 0 | 0 | OK |