| Multiple Linear Regression - Estimated Regression Equation |
| D [t] = -0.101608832209852 -6.09551076358242e-05SWS[t] + 0.000261740059678429PS[t] + 7.3273090252969e-06L[t] -0.000138734472492483Wb[t] + 0.00010510687851621Wbr[t] + 1.26344683983161e-05Tg[t] + 0.660225760372188P[t] + 0.34557106541433S[t] + e[t] |
| Multiple Linear Regression - Ordinary Least Squares | |||||
| Variable | Parameter | S.D. | T-STAT H0: parameter = 0 | 2-tail p-value | 1-tail p-value |
| (Intercept) | -0.101608832209852 | 0.128875 | -0.7884 | 0.433959 | 0.21698 |
| SWS | -6.09551076358242e-05 | 0.000316 | -0.1927 | 0.847948 | 0.423974 |
| PS | 0.000261740059678429 | 0.000333 | 0.7868 | 0.434886 | 0.217443 |
| L | 7.3273090252969e-06 | 0.000227 | 0.0323 | 0.974378 | 0.487189 |
| Wb | -0.000138734472492483 | 8.4e-05 | -1.6455 | 0.105786 | 0.052893 |
| Wbr | 0.00010510687851621 | 5.5e-05 | 1.9142 | 0.061005 | 0.030503 |
| Tg | 1.26344683983161e-05 | 2e-04 | 0.0631 | 0.949934 | 0.474967 |
| P | 0.660225760372188 | 0.048881 | 13.5067 | 0 | 0 |
| S | 0.34557106541433 | 0.050219 | 6.8813 | 0 | 0 |
| Multiple Linear Regression - Regression Statistics | |
| Multiple R | 0.963410634069038 |
| R-squared | 0.928160049837306 |
| Adjusted R-squared | 0.917316283775013 |
| F-TEST (value) | 85.5938835737854 |
| F-TEST (DF numerator) | 8 |
| F-TEST (DF denominator) | 53 |
| p-value | 0 |
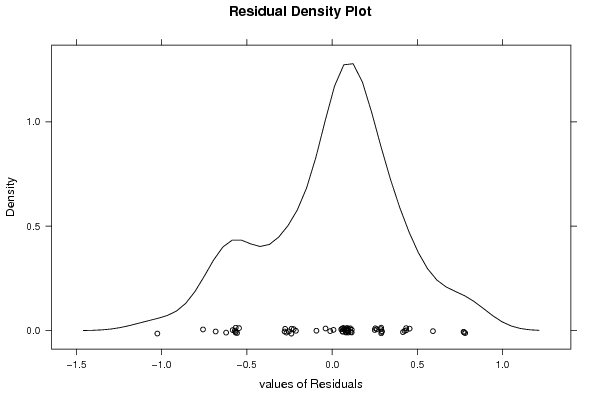
| Multiple Linear Regression - Residual Statistics | |
| Residual Standard Deviation | 0.41442883884995 |
| Sum Squared Residuals | 9.10281691093745 |
| Multiple Linear Regression - Actuals, Interpolation, and Residuals | |||
| Time or Index | Actuals | Interpolation Forecast | Residuals Prediction Error |
| 1 | 3 | 3.0920029852527 | -0.0920029852527001 |
| 2 | 3 | 2.91890926156013 | 0.0810907384398717 |
| 3 | 1 | 0.708671423148579 | 0.291328576851421 |
| 4 | 3 | 3.68354528687572 | -0.68354528687572 |
| 5 | 4 | 3.7461066553348 | 0.253893344665197 |
| 6 | 4 | 3.94108207516275 | 0.0589179248372471 |
| 7 | 1 | 0.904855871748293 | 0.0951441282517073 |
| 8 | 4 | 4.26783531852748 | -0.267835318527475 |
| 9 | 1 | 1.2532709610252 | -0.253270961025201 |
| 10 | 1 | 0.94633143191164 | 0.0536685680883593 |
| 11 | 4 | 4.58360571503705 | -0.583605715037052 |
| 12 | 5 | 4.91108224321412 | 0.0889177567858839 |
| 13 | 2 | 1.54489133019433 | 0.455108669805667 |
| 14 | 5 | 4.74977836525352 | 0.250221634746478 |
| 15 | 1 | 0.905024953274623 | 0.0949750467253773 |
| 16 | 2 | 1.91239220454936 | 0.0876077954506383 |
| 17 | 2 | 2.27899473599782 | -0.278994735997816 |
| 18 | 2 | 1.911809961632 | 0.0881900383679984 |
| 19 | 1 | 1.23907778589669 | -0.239077785896688 |
| 20 | 1 | 0.892672192692598 | 0.107327807307402 |
| 21 | 5 | 4.99168906472336 | 0.00831093527663622 |
| 22 | 5 | 4.93757135792106 | 0.0624286420789421 |
| 23 | 2 | 2.22517811108134 | -0.225178111081343 |
| 24 | 1 | 1.7577442288818 | -0.757744228881802 |
| 25 | 1 | 1.62202065571838 | -0.622020655718378 |
| 26 | 1 | 0.712038548998443 | 0.287961451001557 |
| 27 | 3 | 3.54617328311211 | -0.546173283112106 |
| 28 | 4 | 4.23734012552544 | -0.23734012552544 |
| 29 | 5 | 4.92860326590098 | 0.071396734099022 |
| 30 | 1 | 0.707659737725898 | 0.292340262274102 |
| 31 | 4 | 3.40790626014173 | 0.592093739858272 |
| 32 | 4 | 3.8908632019268 | 0.109136798073202 |
| 33 | 1 | 0.904452845480769 | 0.095547154519231 |
| 34 | 1 | 1.03855914984522 | -0.03855914984522 |
| 35 | 1 | 1.557899823044 | -0.557899823043996 |
| 36 | 3 | 2.21877300712377 | 0.78122699287623 |
| 37 | 3 | 2.88478294134035 | 0.11521705865965 |
| 38 | 3 | 2.8851518768664 | 0.114848123133595 |
| 39 | 1 | 1.565652892695 | -0.565652892695 |
| 40 | 1 | 1.56656683744538 | -0.566566837445378 |
| 41 | 5 | 5.01108203224868 | -0.0110820322486828 |
| 42 | 2 | 1.91294875118881 | 0.0870512488111864 |
| 43 | 4 | 3.93420030348804 | 0.0657996965119633 |
| 44 | 2 | 1.56544302982516 | 0.434556970174844 |
| 45 | 4 | 3.91561258947383 | 0.084387410526173 |
| 46 | 5 | 4.9286022166008 | 0.0713977833992019 |
| 47 | 2 | 1.7138220266662 | 0.286177973333795 |
| 48 | 3 | 2.22513453394093 | 0.774865466059068 |
| 49 | 1 | 0.909803054422399 | 0.0901969455776014 |
| 50 | 2 | 2.2755132315655 | -0.275513231565498 |
| 51 | 2 | 1.91395575160755 | 0.0860442483924511 |
| 52 | 3 | 2.57463728932944 | 0.425362710670564 |
| 53 | 5 | 4.73707492738858 | 0.262925072611418 |
| 54 | 5 | 4.94008557583977 | 0.0599144241602345 |
| 55 | 2 | 1.71175041897305 | 0.288249581026945 |
| 56 | 2 | 2.21222220054232 | -0.212222200542322 |
| 57 | 2 | 1.56528470775553 | 0.434715292244468 |
| 58 | 3 | 2.22806889848158 | 0.771931101518417 |
| 59 | 2 | 2.57093342857586 | -0.570933428575865 |
| 60 | 4 | 3.58391718030808 | 0.41608281969192 |
| 61 | 1 | 1.56548422362213 | -0.565484223622135 |
| 62 | 1 | 2.02585565436812 | -1.02585565436812 |
| Goldfeld-Quandt test for Heteroskedasticity | |||
| p-values | Alternative Hypothesis | ||
| breakpoint index | greater | 2-sided | less |
| 12 | 0.395848099934039 | 0.791696199868077 | 0.604151900065961 |
| 13 | 0.30018743695253 | 0.60037487390506 | 0.69981256304747 |
| 14 | 0.252055487514735 | 0.504110975029471 | 0.747944512485265 |
| 15 | 0.150261942324308 | 0.300523884648617 | 0.849738057675692 |
| 16 | 0.0868705511517335 | 0.173741102303467 | 0.913129448848267 |
| 17 | 0.151941785428544 | 0.303883570857087 | 0.848058214571456 |
| 18 | 0.100900081691462 | 0.201800163382923 | 0.899099918308539 |
| 19 | 0.191325381497917 | 0.382650762995834 | 0.808674618502083 |
| 20 | 0.135206833297493 | 0.270413666594986 | 0.864793166702507 |
| 21 | 0.0863771283343526 | 0.172754256668705 | 0.913622871665647 |
| 22 | 0.0590502119817367 | 0.118100423963473 | 0.940949788018263 |
| 23 | 0.0360142578807865 | 0.072028515761573 | 0.963985742119214 |
| 24 | 0.114393837373718 | 0.228787674747436 | 0.885606162626282 |
| 25 | 0.151501629088509 | 0.303003258177017 | 0.848498370911491 |
| 26 | 0.136803173324547 | 0.273606346649093 | 0.863196826675453 |
| 27 | 0.174069806651124 | 0.348139613302249 | 0.825930193348876 |
| 28 | 0.135083367970207 | 0.270166735940415 | 0.864916632029793 |
| 29 | 0.10278385869338 | 0.20556771738676 | 0.89721614130662 |
| 30 | 0.0882647675655606 | 0.176529535131121 | 0.91173523243444 |
| 31 | 0.121967695462096 | 0.243935390924192 | 0.878032304537904 |
| 32 | 0.0921773175097955 | 0.184354635019591 | 0.907822682490204 |
| 33 | 0.0658731499788223 | 0.131746299957645 | 0.934126850021178 |
| 34 | 0.0429199905320568 | 0.0858399810641136 | 0.957080009467943 |
| 35 | 0.0646802389467788 | 0.129360477893558 | 0.935319761053221 |
| 36 | 0.143233657448197 | 0.286467314896395 | 0.856766342551803 |
| 37 | 0.10216283425388 | 0.204325668507761 | 0.89783716574612 |
| 38 | 0.0695364348514551 | 0.13907286970291 | 0.930463565148545 |
| 39 | 0.0852282305413933 | 0.170456461082787 | 0.914771769458607 |
| 40 | 0.118125044053256 | 0.236250088106511 | 0.881874955946744 |
| 41 | 0.084846208813476 | 0.169692417626952 | 0.915153791186524 |
| 42 | 0.0555439297401748 | 0.11108785948035 | 0.944456070259825 |
| 43 | 0.034002074040047 | 0.068004148080094 | 0.965997925959953 |
| 44 | 0.0308749098500609 | 0.0617498197001218 | 0.96912509014994 |
| 45 | 0.0187365927608298 | 0.0374731855216596 | 0.98126340723917 |
| 46 | 0.0161423205082935 | 0.0322846410165871 | 0.983857679491706 |
| 47 | 0.0152584003822682 | 0.0305168007645364 | 0.984741599617732 |
| 48 | 0.0522565931433494 | 0.104513186286699 | 0.94774340685665 |
| 49 | 0.0281737822563611 | 0.0563475645127222 | 0.971826217743639 |
| 50 | 0.0202833145274041 | 0.0405666290548082 | 0.979716685472596 |
| Meta Analysis of Goldfeld-Quandt test for Heteroskedasticity | |||
| Description | # significant tests | % significant tests | OK/NOK |
| 1% type I error level | 0 | 0 | OK |
| 5% type I error level | 4 | 0.102564102564103 | NOK |
| 10% type I error level | 9 | 0.230769230769231 | NOK |