Free Statistics

of Irreproducible Research!

Author's title

Author*The author of this computation has been verified*
R Software Modulerwasp_arimabackwardselection.wasp
Title produced by softwareARIMA Backward Selection
Date of computationWed, 22 Dec 2010 19:22:30 +0000
Cite this page as followsStatistical Computations at FreeStatistics.org, Office for Research Development and Education, URL https://freestatistics.org/blog/index.php?v=date/2010/Dec/22/t12930456352pnku9gq7hh6a5y.htm/, Retrieved Sun, 05 May 2024 22:59:24 +0000
Statistical Computations at FreeStatistics.org, Office for Research Development and Education, URL https://freestatistics.org/blog/index.php?pk=114521, Retrieved Sun, 05 May 2024 22:59:24 +0000
QR Codes:

Original text written by user:
IsPrivate?No (this computation is public)
User-defined keywords
Estimated Impact156
Family? (F = Feedback message, R = changed R code, M = changed R Module, P = changed Parameters, D = changed Data)
-       [ARIMA Backward Selection] [paper - arima bac...] [2010-12-22 19:22:30] [5398da98f4f83c6a353e4d3806d4bcaa] [Current]
Feedback Forum

Post a new message
Dataseries X:
631 923
654 294
671 833
586 840
600 969
625 568
558 110
630 577
628 654
603 184
656 255
600 730
670 326
678 423
641 502
625 311
628 177
589 767
582 471
636 248
599 885
621 694
637 406
595 994
696 308
674 201
648 861
649 605
672 392
598 396
613 177
638 104
615 632
634 465
638 686
604 243
706 669
677 185
644 328
644 825
605 707
600 136
612 166
599 659
634 210
618 234
613 576
627 200
668 973
651 479
619 661
644 260
579 936
601 752
595 376
588 902
634 341
594 305
606 200
610 926
633 685
639 696
659 451
593 248
606 677
599 434
569 578
629 873
613 438
604 172
658 328
612 633
707 372
739 770
777 535
685 030
730 234
714 154
630 872
719 492
677 023
679 272
718 317
645 672


Summary of computational transaction
Raw Inputview raw input (R code)
Raw Outputview raw output of R engine
Computing time14 seconds
R Server'George Udny Yule' @ 72.249.76.132

\begin{tabular}{lllllllll}
\hline
Summary of computational transaction \tabularnewline
Raw Input & view raw input (R code)  \tabularnewline
Raw Output & view raw output of R engine  \tabularnewline
Computing time & 14 seconds \tabularnewline
R Server & 'George Udny Yule' @ 72.249.76.132 \tabularnewline
\hline
\end{tabular}
%Source: https://freestatistics.org/blog/index.php?pk=114521&T=0

[TABLE]
[ROW][C]Summary of computational transaction[/C][/ROW]
[ROW][C]Raw Input[/C][C]view raw input (R code) [/C][/ROW]
[ROW][C]Raw Output[/C][C]view raw output of R engine [/C][/ROW]
[ROW][C]Computing time[/C][C]14 seconds[/C][/ROW]
[ROW][C]R Server[/C][C]'George Udny Yule' @ 72.249.76.132[/C][/ROW]
[/TABLE]
Source: https://freestatistics.org/blog/index.php?pk=114521&T=0

Globally Unique Identifier (entire table): ba.freestatistics.org/blog/index.php?pk=114521&T=0

As an alternative you can also use a QR Code:  

The GUIDs for individual cells are displayed in the table below:

Summary of computational transaction
Raw Inputview raw input (R code)
Raw Outputview raw output of R engine
Computing time14 seconds
R Server'George Udny Yule' @ 72.249.76.132


ARIMA Parameter Estimation and Backward Selection
Iterationar1ar2ar3ma1sar1sar2sma1
Estimates ( 1 )-0.4816-0.10960.4285-0.18880.2969-0.4769-1
(p-val)(0.0932 )(0.6511 )(0.0122 )(0.5414 )(0.1046 )(5e-04 )(8e-04 )
Estimates ( 2 )-0.369500.4846-0.30590.3079-0.474-1.0006
(p-val)(0.0047 )(NA )(0 )(0.0569 )(0.0914 )(5e-04 )(8e-04 )
Estimates ( 3 )-0.365200.5472-0.34690-0.5012-1.0011
(p-val)(0.002 )(NA )(0 )(0.0235 )(NA )(1e-04 )(0.0346 )
Estimates ( 4 )NANANANANANANA
(p-val)(NA )(NA )(NA )(NA )(NA )(NA )(NA )
Estimates ( 5 )NANANANANANANA
(p-val)(NA )(NA )(NA )(NA )(NA )(NA )(NA )
Estimates ( 6 )NANANANANANANA
(p-val)(NA )(NA )(NA )(NA )(NA )(NA )(NA )
Estimates ( 7 )NANANANANANANA
(p-val)(NA )(NA )(NA )(NA )(NA )(NA )(NA )
Estimates ( 8 )NANANANANANANA
(p-val)(NA )(NA )(NA )(NA )(NA )(NA )(NA )
Estimates ( 9 )NANANANANANANA
(p-val)(NA )(NA )(NA )(NA )(NA )(NA )(NA )
Estimates ( 10 )NANANANANANANA
(p-val)(NA )(NA )(NA )(NA )(NA )(NA )(NA )
Estimates ( 11 )NANANANANANANA
(p-val)(NA )(NA )(NA )(NA )(NA )(NA )(NA )
Estimates ( 12 )NANANANANANANA
(p-val)(NA )(NA )(NA )(NA )(NA )(NA )(NA )
Estimates ( 13 )NANANANANANANA
(p-val)(NA )(NA )(NA )(NA )(NA )(NA )(NA )

\begin{tabular}{lllllllll}
\hline
ARIMA Parameter Estimation and Backward Selection \tabularnewline
Iteration & ar1 & ar2 & ar3 & ma1 & sar1 & sar2 & sma1 \tabularnewline
Estimates ( 1 ) & -0.4816 & -0.1096 & 0.4285 & -0.1888 & 0.2969 & -0.4769 & -1 \tabularnewline
(p-val) & (0.0932 ) & (0.6511 ) & (0.0122 ) & (0.5414 ) & (0.1046 ) & (5e-04 ) & (8e-04 ) \tabularnewline
Estimates ( 2 ) & -0.3695 & 0 & 0.4846 & -0.3059 & 0.3079 & -0.474 & -1.0006 \tabularnewline
(p-val) & (0.0047 ) & (NA ) & (0 ) & (0.0569 ) & (0.0914 ) & (5e-04 ) & (8e-04 ) \tabularnewline
Estimates ( 3 ) & -0.3652 & 0 & 0.5472 & -0.3469 & 0 & -0.5012 & -1.0011 \tabularnewline
(p-val) & (0.002 ) & (NA ) & (0 ) & (0.0235 ) & (NA ) & (1e-04 ) & (0.0346 ) \tabularnewline
Estimates ( 4 ) & NA & NA & NA & NA & NA & NA & NA \tabularnewline
(p-val) & (NA ) & (NA ) & (NA ) & (NA ) & (NA ) & (NA ) & (NA ) \tabularnewline
Estimates ( 5 ) & NA & NA & NA & NA & NA & NA & NA \tabularnewline
(p-val) & (NA ) & (NA ) & (NA ) & (NA ) & (NA ) & (NA ) & (NA ) \tabularnewline
Estimates ( 6 ) & NA & NA & NA & NA & NA & NA & NA \tabularnewline
(p-val) & (NA ) & (NA ) & (NA ) & (NA ) & (NA ) & (NA ) & (NA ) \tabularnewline
Estimates ( 7 ) & NA & NA & NA & NA & NA & NA & NA \tabularnewline
(p-val) & (NA ) & (NA ) & (NA ) & (NA ) & (NA ) & (NA ) & (NA ) \tabularnewline
Estimates ( 8 ) & NA & NA & NA & NA & NA & NA & NA \tabularnewline
(p-val) & (NA ) & (NA ) & (NA ) & (NA ) & (NA ) & (NA ) & (NA ) \tabularnewline
Estimates ( 9 ) & NA & NA & NA & NA & NA & NA & NA \tabularnewline
(p-val) & (NA ) & (NA ) & (NA ) & (NA ) & (NA ) & (NA ) & (NA ) \tabularnewline
Estimates ( 10 ) & NA & NA & NA & NA & NA & NA & NA \tabularnewline
(p-val) & (NA ) & (NA ) & (NA ) & (NA ) & (NA ) & (NA ) & (NA ) \tabularnewline
Estimates ( 11 ) & NA & NA & NA & NA & NA & NA & NA \tabularnewline
(p-val) & (NA ) & (NA ) & (NA ) & (NA ) & (NA ) & (NA ) & (NA ) \tabularnewline
Estimates ( 12 ) & NA & NA & NA & NA & NA & NA & NA \tabularnewline
(p-val) & (NA ) & (NA ) & (NA ) & (NA ) & (NA ) & (NA ) & (NA ) \tabularnewline
Estimates ( 13 ) & NA & NA & NA & NA & NA & NA & NA \tabularnewline
(p-val) & (NA ) & (NA ) & (NA ) & (NA ) & (NA ) & (NA ) & (NA ) \tabularnewline
\hline
\end{tabular}
%Source: https://freestatistics.org/blog/index.php?pk=114521&T=1

[TABLE]
[ROW][C]ARIMA Parameter Estimation and Backward Selection[/C][/ROW]
[ROW][C]Iteration[/C][C]ar1[/C][C]ar2[/C][C]ar3[/C][C]ma1[/C][C]sar1[/C][C]sar2[/C][C]sma1[/C][/ROW]
[ROW][C]Estimates ( 1 )[/C][C]-0.4816[/C][C]-0.1096[/C][C]0.4285[/C][C]-0.1888[/C][C]0.2969[/C][C]-0.4769[/C][C]-1[/C][/ROW]
[ROW][C](p-val)[/C][C](0.0932 )[/C][C](0.6511 )[/C][C](0.0122 )[/C][C](0.5414 )[/C][C](0.1046 )[/C][C](5e-04 )[/C][C](8e-04 )[/C][/ROW]
[ROW][C]Estimates ( 2 )[/C][C]-0.3695[/C][C]0[/C][C]0.4846[/C][C]-0.3059[/C][C]0.3079[/C][C]-0.474[/C][C]-1.0006[/C][/ROW]
[ROW][C](p-val)[/C][C](0.0047 )[/C][C](NA )[/C][C](0 )[/C][C](0.0569 )[/C][C](0.0914 )[/C][C](5e-04 )[/C][C](8e-04 )[/C][/ROW]
[ROW][C]Estimates ( 3 )[/C][C]-0.3652[/C][C]0[/C][C]0.5472[/C][C]-0.3469[/C][C]0[/C][C]-0.5012[/C][C]-1.0011[/C][/ROW]
[ROW][C](p-val)[/C][C](0.002 )[/C][C](NA )[/C][C](0 )[/C][C](0.0235 )[/C][C](NA )[/C][C](1e-04 )[/C][C](0.0346 )[/C][/ROW]
[ROW][C]Estimates ( 4 )[/C][C]NA[/C][C]NA[/C][C]NA[/C][C]NA[/C][C]NA[/C][C]NA[/C][C]NA[/C][/ROW]
[ROW][C](p-val)[/C][C](NA )[/C][C](NA )[/C][C](NA )[/C][C](NA )[/C][C](NA )[/C][C](NA )[/C][C](NA )[/C][/ROW]
[ROW][C]Estimates ( 5 )[/C][C]NA[/C][C]NA[/C][C]NA[/C][C]NA[/C][C]NA[/C][C]NA[/C][C]NA[/C][/ROW]
[ROW][C](p-val)[/C][C](NA )[/C][C](NA )[/C][C](NA )[/C][C](NA )[/C][C](NA )[/C][C](NA )[/C][C](NA )[/C][/ROW]
[ROW][C]Estimates ( 6 )[/C][C]NA[/C][C]NA[/C][C]NA[/C][C]NA[/C][C]NA[/C][C]NA[/C][C]NA[/C][/ROW]
[ROW][C](p-val)[/C][C](NA )[/C][C](NA )[/C][C](NA )[/C][C](NA )[/C][C](NA )[/C][C](NA )[/C][C](NA )[/C][/ROW]
[ROW][C]Estimates ( 7 )[/C][C]NA[/C][C]NA[/C][C]NA[/C][C]NA[/C][C]NA[/C][C]NA[/C][C]NA[/C][/ROW]
[ROW][C](p-val)[/C][C](NA )[/C][C](NA )[/C][C](NA )[/C][C](NA )[/C][C](NA )[/C][C](NA )[/C][C](NA )[/C][/ROW]
[ROW][C]Estimates ( 8 )[/C][C]NA[/C][C]NA[/C][C]NA[/C][C]NA[/C][C]NA[/C][C]NA[/C][C]NA[/C][/ROW]
[ROW][C](p-val)[/C][C](NA )[/C][C](NA )[/C][C](NA )[/C][C](NA )[/C][C](NA )[/C][C](NA )[/C][C](NA )[/C][/ROW]
[ROW][C]Estimates ( 9 )[/C][C]NA[/C][C]NA[/C][C]NA[/C][C]NA[/C][C]NA[/C][C]NA[/C][C]NA[/C][/ROW]
[ROW][C](p-val)[/C][C](NA )[/C][C](NA )[/C][C](NA )[/C][C](NA )[/C][C](NA )[/C][C](NA )[/C][C](NA )[/C][/ROW]
[ROW][C]Estimates ( 10 )[/C][C]NA[/C][C]NA[/C][C]NA[/C][C]NA[/C][C]NA[/C][C]NA[/C][C]NA[/C][/ROW]
[ROW][C](p-val)[/C][C](NA )[/C][C](NA )[/C][C](NA )[/C][C](NA )[/C][C](NA )[/C][C](NA )[/C][C](NA )[/C][/ROW]
[ROW][C]Estimates ( 11 )[/C][C]NA[/C][C]NA[/C][C]NA[/C][C]NA[/C][C]NA[/C][C]NA[/C][C]NA[/C][/ROW]
[ROW][C](p-val)[/C][C](NA )[/C][C](NA )[/C][C](NA )[/C][C](NA )[/C][C](NA )[/C][C](NA )[/C][C](NA )[/C][/ROW]
[ROW][C]Estimates ( 12 )[/C][C]NA[/C][C]NA[/C][C]NA[/C][C]NA[/C][C]NA[/C][C]NA[/C][C]NA[/C][/ROW]
[ROW][C](p-val)[/C][C](NA )[/C][C](NA )[/C][C](NA )[/C][C](NA )[/C][C](NA )[/C][C](NA )[/C][C](NA )[/C][/ROW]
[ROW][C]Estimates ( 13 )[/C][C]NA[/C][C]NA[/C][C]NA[/C][C]NA[/C][C]NA[/C][C]NA[/C][C]NA[/C][/ROW]
[ROW][C](p-val)[/C][C](NA )[/C][C](NA )[/C][C](NA )[/C][C](NA )[/C][C](NA )[/C][C](NA )[/C][C](NA )[/C][/ROW]
[/TABLE]
Source: https://freestatistics.org/blog/index.php?pk=114521&T=1

Globally Unique Identifier (entire table): ba.freestatistics.org/blog/index.php?pk=114521&T=1

As an alternative you can also use a QR Code:  

The GUIDs for individual cells are displayed in the table below:

ARIMA Parameter Estimation and Backward Selection
Iterationar1ar2ar3ma1sar1sar2sma1
Estimates ( 1 )-0.4816-0.10960.4285-0.18880.2969-0.4769-1
(p-val)(0.0932 )(0.6511 )(0.0122 )(0.5414 )(0.1046 )(5e-04 )(8e-04 )
Estimates ( 2 )-0.369500.4846-0.30590.3079-0.474-1.0006
(p-val)(0.0047 )(NA )(0 )(0.0569 )(0.0914 )(5e-04 )(8e-04 )
Estimates ( 3 )-0.365200.5472-0.34690-0.5012-1.0011
(p-val)(0.002 )(NA )(0 )(0.0235 )(NA )(1e-04 )(0.0346 )
Estimates ( 4 )NANANANANANANA
(p-val)(NA )(NA )(NA )(NA )(NA )(NA )(NA )
Estimates ( 5 )NANANANANANANA
(p-val)(NA )(NA )(NA )(NA )(NA )(NA )(NA )
Estimates ( 6 )NANANANANANANA
(p-val)(NA )(NA )(NA )(NA )(NA )(NA )(NA )
Estimates ( 7 )NANANANANANANA
(p-val)(NA )(NA )(NA )(NA )(NA )(NA )(NA )
Estimates ( 8 )NANANANANANANA
(p-val)(NA )(NA )(NA )(NA )(NA )(NA )(NA )
Estimates ( 9 )NANANANANANANA
(p-val)(NA )(NA )(NA )(NA )(NA )(NA )(NA )
Estimates ( 10 )NANANANANANANA
(p-val)(NA )(NA )(NA )(NA )(NA )(NA )(NA )
Estimates ( 11 )NANANANANANANA
(p-val)(NA )(NA )(NA )(NA )(NA )(NA )(NA )
Estimates ( 12 )NANANANANANANA
(p-val)(NA )(NA )(NA )(NA )(NA )(NA )(NA )
Estimates ( 13 )NANANANANANANA
(p-val)(NA )(NA )(NA )(NA )(NA )(NA )(NA )


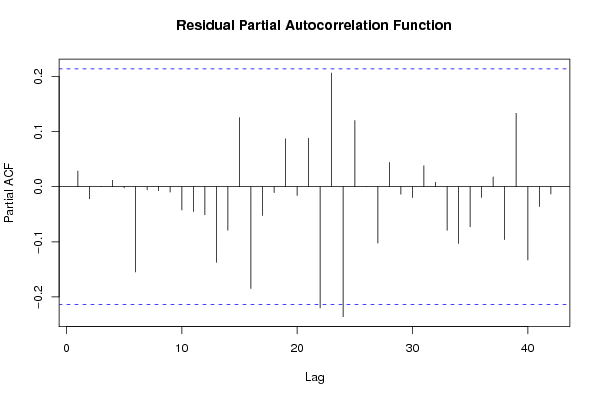
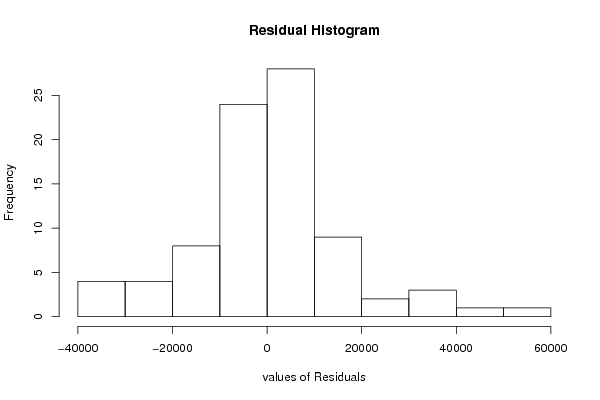
Estimated ARIMA Residuals
Value
-2008.89093285482
-6555.07132142903
-34042.5082278988
10690.5244837792
17907.7213950037
-22665.7036706889
-5008.71313743215
5619.89138350181
-6533.59433572251
1426.51822915374
-5573.91101046862
7968.47088889463
11875.2510051734
4484.45588151398
-6695.17286906565
3195.80377000386
33479.9583074633
-19013.268071849
-5017.39752277267
-17989.9274781780
1810.13100997662
-1951.62100442419
2637.7401821919
-10979.4213217954
11149.9965607018
233.720544916665
-27975.1814699233
-507.635222063279
-30716.898262343
6308.3431148588
21831.8862210075
2315.98168737857
2394.04050654506
-6088.30660886117
-7049.00942606968
10784.4612109370
-5802.72828971991
-8698.42819229714
-34051.572180707
43140.4164064338
5128.85075347245
461.214706811253
-8847.7024046238
-5569.2853748777
4440.61167623479
-12851.4493366203
-1370.44914006339
-5644.83271949838
-6604.62850182249
2220.13993471797
33556.5207230226
-21047.047968272
-2103.47783651169
-7858.15648432164
14433.7259354068
13429.0767802213
-7094.95795618593
1735.90558918604
18408.0971988507
7397.51168527708
24296.7538952081
34804.7340820889
58283.6738835546
-15079.1557081238
-11569.7314411712
184.234426245589
-37716.4952125044
-11365.7162481694
-15996.9681133350
13111.1938169351
-7866.94758420257
-20585.0660895690

\begin{tabular}{lllllllll}
\hline
Estimated ARIMA Residuals \tabularnewline
Value \tabularnewline
-2008.89093285482 \tabularnewline
-6555.07132142903 \tabularnewline
-34042.5082278988 \tabularnewline
10690.5244837792 \tabularnewline
17907.7213950037 \tabularnewline
-22665.7036706889 \tabularnewline
-5008.71313743215 \tabularnewline
5619.89138350181 \tabularnewline
-6533.59433572251 \tabularnewline
1426.51822915374 \tabularnewline
-5573.91101046862 \tabularnewline
7968.47088889463 \tabularnewline
11875.2510051734 \tabularnewline
4484.45588151398 \tabularnewline
-6695.17286906565 \tabularnewline
3195.80377000386 \tabularnewline
33479.9583074633 \tabularnewline
-19013.268071849 \tabularnewline
-5017.39752277267 \tabularnewline
-17989.9274781780 \tabularnewline
1810.13100997662 \tabularnewline
-1951.62100442419 \tabularnewline
2637.7401821919 \tabularnewline
-10979.4213217954 \tabularnewline
11149.9965607018 \tabularnewline
233.720544916665 \tabularnewline
-27975.1814699233 \tabularnewline
-507.635222063279 \tabularnewline
-30716.898262343 \tabularnewline
6308.3431148588 \tabularnewline
21831.8862210075 \tabularnewline
2315.98168737857 \tabularnewline
2394.04050654506 \tabularnewline
-6088.30660886117 \tabularnewline
-7049.00942606968 \tabularnewline
10784.4612109370 \tabularnewline
-5802.72828971991 \tabularnewline
-8698.42819229714 \tabularnewline
-34051.572180707 \tabularnewline
43140.4164064338 \tabularnewline
5128.85075347245 \tabularnewline
461.214706811253 \tabularnewline
-8847.7024046238 \tabularnewline
-5569.2853748777 \tabularnewline
4440.61167623479 \tabularnewline
-12851.4493366203 \tabularnewline
-1370.44914006339 \tabularnewline
-5644.83271949838 \tabularnewline
-6604.62850182249 \tabularnewline
2220.13993471797 \tabularnewline
33556.5207230226 \tabularnewline
-21047.047968272 \tabularnewline
-2103.47783651169 \tabularnewline
-7858.15648432164 \tabularnewline
14433.7259354068 \tabularnewline
13429.0767802213 \tabularnewline
-7094.95795618593 \tabularnewline
1735.90558918604 \tabularnewline
18408.0971988507 \tabularnewline
7397.51168527708 \tabularnewline
24296.7538952081 \tabularnewline
34804.7340820889 \tabularnewline
58283.6738835546 \tabularnewline
-15079.1557081238 \tabularnewline
-11569.7314411712 \tabularnewline
184.234426245589 \tabularnewline
-37716.4952125044 \tabularnewline
-11365.7162481694 \tabularnewline
-15996.9681133350 \tabularnewline
13111.1938169351 \tabularnewline
-7866.94758420257 \tabularnewline
-20585.0660895690 \tabularnewline
\hline
\end{tabular}
%Source: https://freestatistics.org/blog/index.php?pk=114521&T=2

[TABLE]
[ROW][C]Estimated ARIMA Residuals[/C][/ROW]
[ROW][C]Value[/C][/ROW]
[ROW][C]-2008.89093285482[/C][/ROW]
[ROW][C]-6555.07132142903[/C][/ROW]
[ROW][C]-34042.5082278988[/C][/ROW]
[ROW][C]10690.5244837792[/C][/ROW]
[ROW][C]17907.7213950037[/C][/ROW]
[ROW][C]-22665.7036706889[/C][/ROW]
[ROW][C]-5008.71313743215[/C][/ROW]
[ROW][C]5619.89138350181[/C][/ROW]
[ROW][C]-6533.59433572251[/C][/ROW]
[ROW][C]1426.51822915374[/C][/ROW]
[ROW][C]-5573.91101046862[/C][/ROW]
[ROW][C]7968.47088889463[/C][/ROW]
[ROW][C]11875.2510051734[/C][/ROW]
[ROW][C]4484.45588151398[/C][/ROW]
[ROW][C]-6695.17286906565[/C][/ROW]
[ROW][C]3195.80377000386[/C][/ROW]
[ROW][C]33479.9583074633[/C][/ROW]
[ROW][C]-19013.268071849[/C][/ROW]
[ROW][C]-5017.39752277267[/C][/ROW]
[ROW][C]-17989.9274781780[/C][/ROW]
[ROW][C]1810.13100997662[/C][/ROW]
[ROW][C]-1951.62100442419[/C][/ROW]
[ROW][C]2637.7401821919[/C][/ROW]
[ROW][C]-10979.4213217954[/C][/ROW]
[ROW][C]11149.9965607018[/C][/ROW]
[ROW][C]233.720544916665[/C][/ROW]
[ROW][C]-27975.1814699233[/C][/ROW]
[ROW][C]-507.635222063279[/C][/ROW]
[ROW][C]-30716.898262343[/C][/ROW]
[ROW][C]6308.3431148588[/C][/ROW]
[ROW][C]21831.8862210075[/C][/ROW]
[ROW][C]2315.98168737857[/C][/ROW]
[ROW][C]2394.04050654506[/C][/ROW]
[ROW][C]-6088.30660886117[/C][/ROW]
[ROW][C]-7049.00942606968[/C][/ROW]
[ROW][C]10784.4612109370[/C][/ROW]
[ROW][C]-5802.72828971991[/C][/ROW]
[ROW][C]-8698.42819229714[/C][/ROW]
[ROW][C]-34051.572180707[/C][/ROW]
[ROW][C]43140.4164064338[/C][/ROW]
[ROW][C]5128.85075347245[/C][/ROW]
[ROW][C]461.214706811253[/C][/ROW]
[ROW][C]-8847.7024046238[/C][/ROW]
[ROW][C]-5569.2853748777[/C][/ROW]
[ROW][C]4440.61167623479[/C][/ROW]
[ROW][C]-12851.4493366203[/C][/ROW]
[ROW][C]-1370.44914006339[/C][/ROW]
[ROW][C]-5644.83271949838[/C][/ROW]
[ROW][C]-6604.62850182249[/C][/ROW]
[ROW][C]2220.13993471797[/C][/ROW]
[ROW][C]33556.5207230226[/C][/ROW]
[ROW][C]-21047.047968272[/C][/ROW]
[ROW][C]-2103.47783651169[/C][/ROW]
[ROW][C]-7858.15648432164[/C][/ROW]
[ROW][C]14433.7259354068[/C][/ROW]
[ROW][C]13429.0767802213[/C][/ROW]
[ROW][C]-7094.95795618593[/C][/ROW]
[ROW][C]1735.90558918604[/C][/ROW]
[ROW][C]18408.0971988507[/C][/ROW]
[ROW][C]7397.51168527708[/C][/ROW]
[ROW][C]24296.7538952081[/C][/ROW]
[ROW][C]34804.7340820889[/C][/ROW]
[ROW][C]58283.6738835546[/C][/ROW]
[ROW][C]-15079.1557081238[/C][/ROW]
[ROW][C]-11569.7314411712[/C][/ROW]
[ROW][C]184.234426245589[/C][/ROW]
[ROW][C]-37716.4952125044[/C][/ROW]
[ROW][C]-11365.7162481694[/C][/ROW]
[ROW][C]-15996.9681133350[/C][/ROW]
[ROW][C]13111.1938169351[/C][/ROW]
[ROW][C]-7866.94758420257[/C][/ROW]
[ROW][C]-20585.0660895690[/C][/ROW]
[/TABLE]
Source: https://freestatistics.org/blog/index.php?pk=114521&T=2

Globally Unique Identifier (entire table): ba.freestatistics.org/blog/index.php?pk=114521&T=2

As an alternative you can also use a QR Code:  

The GUIDs for individual cells are displayed in the table below:

Estimated ARIMA Residuals
Value
-2008.89093285482
-6555.07132142903
-34042.5082278988
10690.5244837792
17907.7213950037
-22665.7036706889
-5008.71313743215
5619.89138350181
-6533.59433572251
1426.51822915374
-5573.91101046862
7968.47088889463
11875.2510051734
4484.45588151398
-6695.17286906565
3195.80377000386
33479.9583074633
-19013.268071849
-5017.39752277267
-17989.9274781780
1810.13100997662
-1951.62100442419
2637.7401821919
-10979.4213217954
11149.9965607018
233.720544916665
-27975.1814699233
-507.635222063279
-30716.898262343
6308.3431148588
21831.8862210075
2315.98168737857
2394.04050654506
-6088.30660886117
-7049.00942606968
10784.4612109370
-5802.72828971991
-8698.42819229714
-34051.572180707
43140.4164064338
5128.85075347245
461.214706811253
-8847.7024046238
-5569.2853748777
4440.61167623479
-12851.4493366203
-1370.44914006339
-5644.83271949838
-6604.62850182249
2220.13993471797
33556.5207230226
-21047.047968272
-2103.47783651169
-7858.15648432164
14433.7259354068
13429.0767802213
-7094.95795618593
1735.90558918604
18408.0971988507
7397.51168527708
24296.7538952081
34804.7340820889
58283.6738835546
-15079.1557081238
-11569.7314411712
184.234426245589
-37716.4952125044
-11365.7162481694
-15996.9681133350
13111.1938169351
-7866.94758420257
-20585.0660895690


Parameters (Session):
par1 = FALSE ; par2 = 1 ; par3 = 1 ; par4 = 1 ; par5 = 12 ; par6 = 3 ; par7 = 1 ; par8 = 2 ; par9 = 1 ;
Parameters (R input):
par1 = FALSE ; par2 = 1 ; par3 = 1 ; par4 = 1 ; par5 = 12 ; par6 = 3 ; par7 = 1 ; par8 = 2 ; par9 = 1 ;
R code (references can be found in the software module):
library(lattice)
if (par1 == 'TRUE') par1 <- TRUE
if (par1 == 'FALSE') par1 <- FALSE
par2 <- as.numeric(par2) #Box-Cox lambda transformation parameter
par3 <- as.numeric(par3) #degree of non-seasonal differencing
par4 <- as.numeric(par4) #degree of seasonal differencing
par5 <- as.numeric(par5) #seasonal period
par6 <- as.numeric(par6) #degree (p) of the non-seasonal AR(p) polynomial
par7 <- as.numeric(par7) #degree (q) of the non-seasonal MA(q) polynomial
par8 <- as.numeric(par8) #degree (P) of the seasonal AR(P) polynomial
par9 <- as.numeric(par9) #degree (Q) of the seasonal MA(Q) polynomial
armaGR <- function(arima.out, names, n){
try1 <- arima.out$coef
try2 <- sqrt(diag(arima.out$var.coef))
try.data.frame <- data.frame(matrix(NA,ncol=4,nrow=length(names)))
dimnames(try.data.frame) <- list(names,c('coef','std','tstat','pv'))
try.data.frame[,1] <- try1
for(i in 1:length(try2)) try.data.frame[which(rownames(try.data.frame)==names(try2)[i]),2] <- try2[i]
try.data.frame[,3] <- try.data.frame[,1] / try.data.frame[,2]
try.data.frame[,4] <- round((1-pt(abs(try.data.frame[,3]),df=n-(length(try2)+1)))*2,5)
vector <- rep(NA,length(names))
vector[is.na(try.data.frame[,4])] <- 0
maxi <- which.max(try.data.frame[,4])
continue <- max(try.data.frame[,4],na.rm=TRUE) > .05
vector[maxi] <- 0
list(summary=try.data.frame,next.vector=vector,continue=continue)
}
arimaSelect <- function(series, order=c(13,0,0), seasonal=list(order=c(2,0,0),period=12), include.mean=F){
nrc <- order[1]+order[3]+seasonal$order[1]+seasonal$order[3]
coeff <- matrix(NA, nrow=nrc*2, ncol=nrc)
pval <- matrix(NA, nrow=nrc*2, ncol=nrc)
mylist <- rep(list(NULL), nrc)
names <- NULL
if(order[1] > 0) names <- paste('ar',1:order[1],sep='')
if(order[3] > 0) names <- c( names , paste('ma',1:order[3],sep='') )
if(seasonal$order[1] > 0) names <- c(names, paste('sar',1:seasonal$order[1],sep=''))
if(seasonal$order[3] > 0) names <- c(names, paste('sma',1:seasonal$order[3],sep=''))
arima.out <- arima(series, order=order, seasonal=seasonal, include.mean=include.mean, method='ML')
mylist[[1]] <- arima.out
last.arma <- armaGR(arima.out, names, length(series))
mystop <- FALSE
i <- 1
coeff[i,] <- last.arma[[1]][,1]
pval [i,] <- last.arma[[1]][,4]
i <- 2
aic <- arima.out$aic
while(!mystop){
mylist[[i]] <- arima.out
arima.out <- arima(series, order=order, seasonal=seasonal, include.mean=include.mean, method='ML', fixed=last.arma$next.vector)
aic <- c(aic, arima.out$aic)
last.arma <- armaGR(arima.out, names, length(series))
mystop <- !last.arma$continue
coeff[i,] <- last.arma[[1]][,1]
pval [i,] <- last.arma[[1]][,4]
i <- i+1
}
list(coeff, pval, mylist, aic=aic)
}
arimaSelectplot <- function(arimaSelect.out,noms,choix){
noms <- names(arimaSelect.out[[3]][[1]]$coef)
coeff <- arimaSelect.out[[1]]
k <- min(which(is.na(coeff[,1])))-1
coeff <- coeff[1:k,]
pval <- arimaSelect.out[[2]][1:k,]
aic <- arimaSelect.out$aic[1:k]
coeff[coeff==0] <- NA
n <- ncol(coeff)
if(missing(choix)) choix <- k
layout(matrix(c(1,1,1,2,
3,3,3,2,
3,3,3,4,
5,6,7,7),nr=4),
widths=c(10,35,45,15),
heights=c(30,30,15,15))
couleurs <- rainbow(75)[1:50]#(50)
ticks <- pretty(coeff)
par(mar=c(1,1,3,1))
plot(aic,k:1-.5,type='o',pch=21,bg='blue',cex=2,axes=F,lty=2,xpd=NA)
points(aic[choix],k-choix+.5,pch=21,cex=4,bg=2,xpd=NA)
title('aic',line=2)
par(mar=c(3,0,0,0))
plot(0,axes=F,xlab='',ylab='',xlim=range(ticks),ylim=c(.1,1))
rect(xleft = min(ticks) + (0:49)/50*(max(ticks)-min(ticks)),
xright = min(ticks) + (1:50)/50*(max(ticks)-min(ticks)),
ytop = rep(1,50),
ybottom= rep(0,50),col=couleurs,border=NA)
axis(1,ticks)
rect(xleft=min(ticks),xright=max(ticks),ytop=1,ybottom=0)
text(mean(coeff,na.rm=T),.5,'coefficients',cex=2,font=2)
par(mar=c(1,1,3,1))
image(1:n,1:k,t(coeff[k:1,]),axes=F,col=couleurs,zlim=range(ticks))
for(i in 1:n) for(j in 1:k) if(!is.na(coeff[j,i])) {
if(pval[j,i]<.01) symb = 'green'
else if( (pval[j,i]<.05) & (pval[j,i]>=.01)) symb = 'orange'
else if( (pval[j,i]<.1) & (pval[j,i]>=.05)) symb = 'red'
else symb = 'black'
polygon(c(i+.5 ,i+.2 ,i+.5 ,i+.5),
c(k-j+0.5,k-j+0.5,k-j+0.8,k-j+0.5),
col=symb)
if(j==choix) {
rect(xleft=i-.5,
xright=i+.5,
ybottom=k-j+1.5,
ytop=k-j+.5,
lwd=4)
text(i,
k-j+1,
round(coeff[j,i],2),
cex=1.2,
font=2)
}
else{
rect(xleft=i-.5,xright=i+.5,ybottom=k-j+1.5,ytop=k-j+.5)
text(i,k-j+1,round(coeff[j,i],2),cex=1.2,font=1)
}
}
axis(3,1:n,noms)
par(mar=c(0.5,0,0,0.5))
plot(0,axes=F,xlab='',ylab='',type='n',xlim=c(0,8),ylim=c(-.2,.8))
cols <- c('green','orange','red','black')
niv <- c('0','0.01','0.05','0.1')
for(i in 0:3){
polygon(c(1+2*i ,1+2*i ,1+2*i-.5 ,1+2*i),
c(.4 ,.7 , .4 , .4),
col=cols[i+1])
text(2*i,0.5,niv[i+1],cex=1.5)
}
text(8,.5,1,cex=1.5)
text(4,0,'p-value',cex=2)
box()
residus <- arimaSelect.out[[3]][[choix]]$res
par(mar=c(1,2,4,1))
acf(residus,main='')
title('acf',line=.5)
par(mar=c(1,2,4,1))
pacf(residus,main='')
title('pacf',line=.5)
par(mar=c(2,2,4,1))
qqnorm(residus,main='')
title('qq-norm',line=.5)
qqline(residus)
residus
}
if (par2 == 0) x <- log(x)
if (par2 != 0) x <- x^par2
(selection <- arimaSelect(x, order=c(par6,par3,par7), seasonal=list(order=c(par8,par4,par9), period=par5)))
bitmap(file='test1.png')
resid <- arimaSelectplot(selection)
dev.off()
resid
bitmap(file='test2.png')
acf(resid,length(resid)/2, main='Residual Autocorrelation Function')
dev.off()
bitmap(file='test3.png')
pacf(resid,length(resid)/2, main='Residual Partial Autocorrelation Function')
dev.off()
bitmap(file='test4.png')
cpgram(resid, main='Residual Cumulative Periodogram')
dev.off()
bitmap(file='test5.png')
hist(resid, main='Residual Histogram', xlab='values of Residuals')
dev.off()
bitmap(file='test6.png')
densityplot(~resid,col='black',main='Residual Density Plot', xlab='values of Residuals')
dev.off()
bitmap(file='test7.png')
qqnorm(resid, main='Residual Normal Q-Q Plot')
qqline(resid)
dev.off()
ncols <- length(selection[[1]][1,])
nrows <- length(selection[[2]][,1])-1
load(file='createtable')
a<-table.start()
a<-table.row.start(a)
a<-table.element(a,'ARIMA Parameter Estimation and Backward Selection', ncols+1,TRUE)
a<-table.row.end(a)
a<-table.row.start(a)
a<-table.element(a,'Iteration', header=TRUE)
for (i in 1:ncols) {
a<-table.element(a,names(selection[[3]][[1]]$coef)[i],header=TRUE)
}
a<-table.row.end(a)
for (j in 1:nrows) {
a<-table.row.start(a)
mydum <- 'Estimates ('
mydum <- paste(mydum,j)
mydum <- paste(mydum,')')
a<-table.element(a,mydum, header=TRUE)
for (i in 1:ncols) {
a<-table.element(a,round(selection[[1]][j,i],4))
}
a<-table.row.end(a)
a<-table.row.start(a)
a<-table.element(a,'(p-val)', header=TRUE)
for (i in 1:ncols) {
mydum <- '('
mydum <- paste(mydum,round(selection[[2]][j,i],4),sep='')
mydum <- paste(mydum,')')
a<-table.element(a,mydum)
}
a<-table.row.end(a)
}
a<-table.end(a)
table.save(a,file='mytable.tab')
a<-table.start()
a<-table.row.start(a)
a<-table.element(a,'Estimated ARIMA Residuals', 1,TRUE)
a<-table.row.end(a)
a<-table.row.start(a)
a<-table.element(a,'Value', 1,TRUE)
a<-table.row.end(a)
for (i in (par4*par5+par3):length(resid)) {
a<-table.row.start(a)
a<-table.element(a,resid[i])
a<-table.row.end(a)
}
a<-table.end(a)
table.save(a,file='mytable1.tab')