| Multiple Linear Regression - Estimated Regression Equation |
| logPS[t] = + 1.06545673391311 -0.111840159283892D[t] -0.298574713073021logTG[t] + e[t] |
| Multiple Linear Regression - Ordinary Least Squares | |||||
| Variable | Parameter | S.D. | T-STAT H0: parameter = 0 | 2-tail p-value | 1-tail p-value |
| (Intercept) | 1.06545673391311 | 0.122677 | 8.6851 | 0 | 0 |
| D | -0.111840159283892 | 0.021393 | -5.2279 | 7e-06 | 3e-06 |
| logTG | -0.298574713073021 | 0.065008 | -4.5929 | 4.9e-05 | 2.5e-05 |
| Multiple Linear Regression - Regression Statistics | |
| Multiple R | 0.8091255697614 |
| R-squared | 0.654684187641711 |
| Adjusted R-squared | 0.636018468054776 |
| F-TEST (value) | 35.0741467315287 |
| F-TEST (DF numerator) | 2 |
| F-TEST (DF denominator) | 37 |
| p-value | 2.86420842599e-09 |
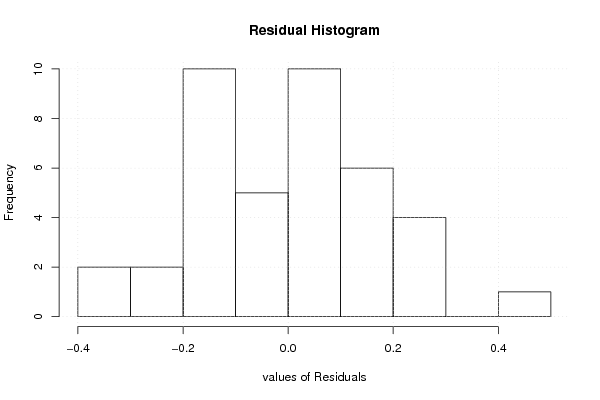
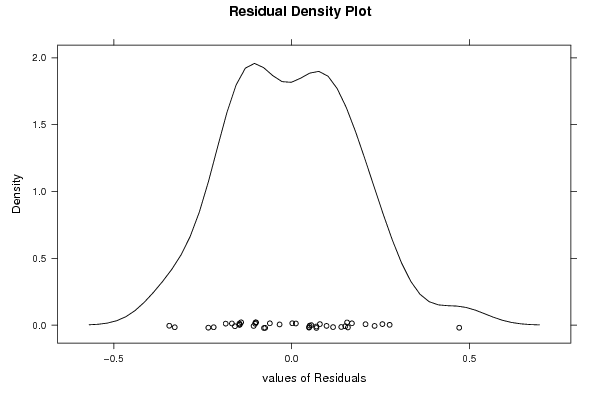
| Multiple Linear Regression - Residual Statistics | |
| Residual Standard Deviation | 0.179536482532290 |
| Sum Squared Residuals | 1.19263389672249 |
| Multiple Linear Regression - Actuals, Interpolation, and Residuals | |||
| Time or Index | Actuals | Interpolation Forecast | Residuals Prediction Error |
| 1 | 0.301029996 | 0.245275065053699 | 0.0557549309463007 |
| 2 | 0.255272505 | -0.216475340167837 | 0.471747845167837 |
| 3 | -0.15490196 | -0.0552712443043058 | -0.0996307156956942 |
| 4 | 0.591064607 | 0.492596901426697 | 0.0984677055733034 |
| 5 | 0 | -0.156193546593246 | 0.156193546593246 |
| 6 | 0.556302501 | 0.41637898649089 | 0.139923514509110 |
| 7 | 0.146128036 | 0.248464363638951 | -0.102336327638951 |
| 8 | 0.176091259 | 0.00625141353625419 | 0.169839845463746 |
| 9 | -0.15490196 | -0.224865849400442 | 0.0699638894004422 |
| 10 | 0.322219295 | 0.468955383621482 | -0.146736088621482 |
| 11 | 0.612783857 | 0.357115224337591 | 0.255668632662409 |
| 12 | 0.079181246 | 0.220985471394069 | -0.141804225394069 |
| 13 | -0.301029996 | -0.141729331355837 | -0.159300664644163 |
| 14 | 0.531478917 | 0.48225663691561 | 0.0492222800843903 |
| 15 | 0.176091259 | 0.209758971682052 | -0.0336677126820518 |
| 16 | 0.531478917 | 0.297851462184291 | 0.233627454815709 |
| 17 | -0.096910013 | 0.0709552738748139 | -0.167865286874814 |
| 18 | -0.096910013 | -0.248045087261727 | 0.151135074261727 |
| 19 | 0.146128036 | 0.220263665895584 | -0.0741356298955845 |
| 20 | 0.301029996 | 0.446347093165248 | -0.145317097165248 |
| 21 | 0.278753601 | 0.229121671107688 | 0.049631929892312 |
| 22 | 0.113943352 | 0.348132766551767 | -0.234189414551767 |
| 23 | 0.301029996 | 0.288905201175748 | 0.0121247948242515 |
| 24 | 0.748188027 | 0.631400343750982 | 0.116787683249018 |
| 25 | 0.491361694 | 0.332825630677961 | 0.158536063322039 |
| 26 | -0.045757491 | -0.0478595498340618 | 0.00210205883406175 |
| 27 | 0.255272505 | 0.474395481806742 | -0.219122976806742 |
| 28 | 0.278753601 | 0.00282383046934837 | 0.275929770530652 |
| 29 | -0.045757491 | 0.0609730476195063 | -0.106730538619506 |
| 30 | 0.414973348 | 0.335155009437197 | 0.079818338562803 |
| 31 | 0.380211242 | 0.441261368562073 | -0.0610501265620728 |
| 32 | 0.079181246 | 0.18048004892718 | -0.10129880292718 |
| 33 | -0.045757491 | 0.139474194938100 | -0.185231685938100 |
| 34 | -0.301029996 | 0.0276340356542080 | -0.328664031654208 |
| 35 | -0.22184875 | -0.144331479249601 | -0.0775172707503985 |
| 36 | 0.361727836 | 0.310865416076142 | 0.0508624199238579 |
| 37 | -0.301029996 | 0.0429068852333194 | -0.343936881233319 |
| 38 | 0.414973348 | 0.345318972746007 | 0.0696543752539927 |
| 39 | -0.22184875 | -0.0752598629197156 | -0.146588887080284 |
| 40 | 0.819543936 | 0.611411725135572 | 0.208132210864428 |
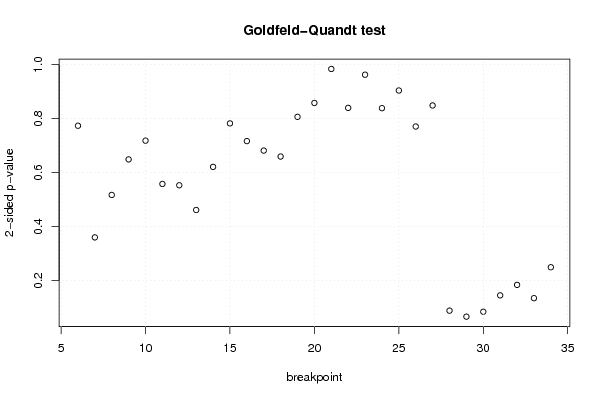
| Goldfeld-Quandt test for Heteroskedasticity | |||
| p-values | Alternative Hypothesis | ||
| breakpoint index | greater | 2-sided | less |
| 6 | 0.613262205557957 | 0.773475588884086 | 0.386737794442043 |
| 7 | 0.82040914462703 | 0.359181710745940 | 0.179590855372970 |
| 8 | 0.741655726459793 | 0.516688547080413 | 0.258344273540207 |
| 9 | 0.675702959644355 | 0.64859408071129 | 0.324297040355645 |
| 10 | 0.640975889672991 | 0.718048220654018 | 0.359024110327009 |
| 11 | 0.72127300746158 | 0.55745398507684 | 0.27872699253842 |
| 12 | 0.72370845854538 | 0.552583082909239 | 0.276291541454620 |
| 13 | 0.769566603229259 | 0.460866793541483 | 0.230433396770741 |
| 14 | 0.689597768749305 | 0.620804462501391 | 0.310402231250695 |
| 15 | 0.608931051574187 | 0.782137896851626 | 0.391068948425813 |
| 16 | 0.641745543610261 | 0.716508912779477 | 0.358254456389739 |
| 17 | 0.65935139913385 | 0.6812972017323 | 0.34064860086615 |
| 18 | 0.670404465777703 | 0.659191068444595 | 0.329595534222297 |
| 19 | 0.596764142497398 | 0.806471715005205 | 0.403235857502602 |
| 20 | 0.570959185437868 | 0.858081629124264 | 0.429040814562132 |
| 21 | 0.492103637236565 | 0.98420727447313 | 0.507896362763435 |
| 22 | 0.580137990143114 | 0.839724019713773 | 0.419862009856886 |
| 23 | 0.481395475728745 | 0.96279095145749 | 0.518604524271255 |
| 24 | 0.419332196688619 | 0.838664393377237 | 0.580667803311381 |
| 25 | 0.452099937442026 | 0.904199874884052 | 0.547900062557974 |
| 26 | 0.385296997622968 | 0.770593995245935 | 0.614703002377032 |
| 27 | 0.575658273655915 | 0.84868345268817 | 0.424341726344085 |
| 28 | 0.956399289943623 | 0.0872014201127545 | 0.0436007100563772 |
| 29 | 0.96749667104097 | 0.0650066579180591 | 0.0325033289590295 |
| 30 | 0.95840460859462 | 0.0831907828107612 | 0.0415953914053806 |
| 31 | 0.927970722238634 | 0.144058555522732 | 0.0720292777613662 |
| 32 | 0.908566062334128 | 0.182867875331743 | 0.0914339376658716 |
| 33 | 0.933224511459638 | 0.133550977080725 | 0.0667754885403623 |
| 34 | 0.875801714774267 | 0.248396570451466 | 0.124198285225733 |
| Meta Analysis of Goldfeld-Quandt test for Heteroskedasticity | |||
| Description | # significant tests | % significant tests | OK/NOK |
| 1% type I error level | 0 | 0 | OK |
| 5% type I error level | 0 | 0 | OK |
| 10% type I error level | 3 | 0.103448275862069 | NOK |