Free Statistics

of Irreproducible Research!

Author's title

Author*The author of this computation has been verified*
R Software Modulerwasp_autocorrelation.wasp
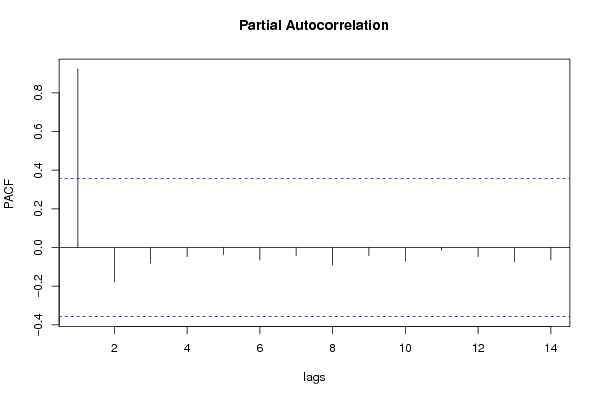
Title produced by software(Partial) Autocorrelation Function
Date of computationWed, 22 Dec 2010 18:55:17 +0000
Cite this page as followsStatistical Computations at FreeStatistics.org, Office for Research Development and Education, URL https://freestatistics.org/blog/index.php?v=date/2010/Dec/22/t129304465947g5sjckqz4f9je.htm/, Retrieved Mon, 06 May 2024 06:34:23 +0000
Statistical Computations at FreeStatistics.org, Office for Research Development and Education, URL https://freestatistics.org/blog/index.php?pk=114500, Retrieved Mon, 06 May 2024 06:34:23 +0000
QR Codes:

Original text written by user:
IsPrivate?No (this computation is public)
User-defined keywords
Estimated Impact100
Family? (F = Feedback message, R = changed R code, M = changed R Module, P = changed Parameters, D = changed Data)
-     [Univariate Data Series] [data set] [2008-12-01 19:54:57] [b98453cac15ba1066b407e146608df68]
- RMP   [(Partial) Autocorrelation Function] [Unemployment] [2010-11-29 09:05:21] [b98453cac15ba1066b407e146608df68]
-    D      [(Partial) Autocorrelation Function] [ACF BBP] [2010-12-22 18:55:17] [694c30abd2a3b2ee5cb46fc74cb5bfb9] [Current]
Feedback Forum

Post a new message
Dataseries X:
192,37
192,65
193,77
194,54
198,63
202,3
206,05
210,94
220,57
228,55
235,61
239,86
243,05
241,37
249,31
259,98
262,85
273,13
278,37
288,19
299,13
301,26
305,36
307,75
317,2
323,6
332,31
341,59
344,3
335,17


Summary of computational transaction
Raw Inputview raw input (R code)
Raw Outputview raw output of R engine
Computing time2 seconds
R Server'RServer@AstonUniversity' @ vre.aston.ac.uk

\begin{tabular}{lllllllll}
\hline
Summary of computational transaction \tabularnewline
Raw Input & view raw input (R code)  \tabularnewline
Raw Output & view raw output of R engine  \tabularnewline
Computing time & 2 seconds \tabularnewline
R Server & 'RServer@AstonUniversity' @ vre.aston.ac.uk \tabularnewline
\hline
\end{tabular}
%Source: https://freestatistics.org/blog/index.php?pk=114500&T=0

[TABLE]
[ROW][C]Summary of computational transaction[/C][/ROW]
[ROW][C]Raw Input[/C][C]view raw input (R code) [/C][/ROW]
[ROW][C]Raw Output[/C][C]view raw output of R engine [/C][/ROW]
[ROW][C]Computing time[/C][C]2 seconds[/C][/ROW]
[ROW][C]R Server[/C][C]'RServer@AstonUniversity' @ vre.aston.ac.uk[/C][/ROW]
[/TABLE]
Source: https://freestatistics.org/blog/index.php?pk=114500&T=0

Globally Unique Identifier (entire table): ba.freestatistics.org/blog/index.php?pk=114500&T=0

As an alternative you can also use a QR Code:  

The GUIDs for individual cells are displayed in the table below:

Summary of computational transaction
Raw Inputview raw input (R code)
Raw Outputview raw output of R engine
Computing time2 seconds
R Server'RServer@AstonUniversity' @ vre.aston.ac.uk


Autocorrelation Function
Time lag kACF(k)T-STATP-value
10.9238755.06031e-05
20.827344.53154.4e-05
30.7245173.96830.000208
40.6223613.40880.00094
50.5242682.87150.003713
60.42712.33930.013084
70.3339851.82930.038654
80.2388291.30810.100384
90.148230.81190.211625
100.0597360.32720.372899
11-0.018818-0.10310.459298
12-0.090175-0.49390.312483
13-0.158724-0.86940.195774
14-0.223411-1.22370.1153

\begin{tabular}{lllllllll}
\hline
Autocorrelation Function \tabularnewline
Time lag k & ACF(k) & T-STAT & P-value \tabularnewline
1 & 0.923875 & 5.0603 & 1e-05 \tabularnewline
2 & 0.82734 & 4.5315 & 4.4e-05 \tabularnewline
3 & 0.724517 & 3.9683 & 0.000208 \tabularnewline
4 & 0.622361 & 3.4088 & 0.00094 \tabularnewline
5 & 0.524268 & 2.8715 & 0.003713 \tabularnewline
6 & 0.4271 & 2.3393 & 0.013084 \tabularnewline
7 & 0.333985 & 1.8293 & 0.038654 \tabularnewline
8 & 0.238829 & 1.3081 & 0.100384 \tabularnewline
9 & 0.14823 & 0.8119 & 0.211625 \tabularnewline
10 & 0.059736 & 0.3272 & 0.372899 \tabularnewline
11 & -0.018818 & -0.1031 & 0.459298 \tabularnewline
12 & -0.090175 & -0.4939 & 0.312483 \tabularnewline
13 & -0.158724 & -0.8694 & 0.195774 \tabularnewline
14 & -0.223411 & -1.2237 & 0.1153 \tabularnewline
\hline
\end{tabular}
%Source: https://freestatistics.org/blog/index.php?pk=114500&T=1

[TABLE]
[ROW][C]Autocorrelation Function[/C][/ROW]
[ROW][C]Time lag k[/C][C]ACF(k)[/C][C]T-STAT[/C][C]P-value[/C][/ROW]
[ROW][C]1[/C][C]0.923875[/C][C]5.0603[/C][C]1e-05[/C][/ROW]
[ROW][C]2[/C][C]0.82734[/C][C]4.5315[/C][C]4.4e-05[/C][/ROW]
[ROW][C]3[/C][C]0.724517[/C][C]3.9683[/C][C]0.000208[/C][/ROW]
[ROW][C]4[/C][C]0.622361[/C][C]3.4088[/C][C]0.00094[/C][/ROW]
[ROW][C]5[/C][C]0.524268[/C][C]2.8715[/C][C]0.003713[/C][/ROW]
[ROW][C]6[/C][C]0.4271[/C][C]2.3393[/C][C]0.013084[/C][/ROW]
[ROW][C]7[/C][C]0.333985[/C][C]1.8293[/C][C]0.038654[/C][/ROW]
[ROW][C]8[/C][C]0.238829[/C][C]1.3081[/C][C]0.100384[/C][/ROW]
[ROW][C]9[/C][C]0.14823[/C][C]0.8119[/C][C]0.211625[/C][/ROW]
[ROW][C]10[/C][C]0.059736[/C][C]0.3272[/C][C]0.372899[/C][/ROW]
[ROW][C]11[/C][C]-0.018818[/C][C]-0.1031[/C][C]0.459298[/C][/ROW]
[ROW][C]12[/C][C]-0.090175[/C][C]-0.4939[/C][C]0.312483[/C][/ROW]
[ROW][C]13[/C][C]-0.158724[/C][C]-0.8694[/C][C]0.195774[/C][/ROW]
[ROW][C]14[/C][C]-0.223411[/C][C]-1.2237[/C][C]0.1153[/C][/ROW]
[/TABLE]
Source: https://freestatistics.org/blog/index.php?pk=114500&T=1

Globally Unique Identifier (entire table): ba.freestatistics.org/blog/index.php?pk=114500&T=1

As an alternative you can also use a QR Code:  

The GUIDs for individual cells are displayed in the table below:

Autocorrelation Function
Time lag kACF(k)T-STATP-value
10.9238755.06031e-05
20.827344.53154.4e-05
30.7245173.96830.000208
40.6223613.40880.00094
50.5242682.87150.003713
60.42712.33930.013084
70.3339851.82930.038654
80.2388291.30810.100384
90.148230.81190.211625
100.0597360.32720.372899
11-0.018818-0.10310.459298
12-0.090175-0.49390.312483
13-0.158724-0.86940.195774
14-0.223411-1.22370.1153


Partial Autocorrelation Function
Time lag kPACF(k)T-STATP-value
10.9238755.06031e-05
2-0.178928-0.980.167454
3-0.079706-0.43660.332776
4-0.046783-0.25620.399758
5-0.035427-0.1940.423726
6-0.065085-0.35650.361986
7-0.041629-0.2280.410592
8-0.090874-0.49770.31115
9-0.041106-0.22510.411696
10-0.070514-0.38620.35103
11-0.015497-0.08490.46646
12-0.047041-0.25770.399216
13-0.073493-0.40250.345071
14-0.064465-0.35310.363245

\begin{tabular}{lllllllll}
\hline
Partial Autocorrelation Function \tabularnewline
Time lag k & PACF(k) & T-STAT & P-value \tabularnewline
1 & 0.923875 & 5.0603 & 1e-05 \tabularnewline
2 & -0.178928 & -0.98 & 0.167454 \tabularnewline
3 & -0.079706 & -0.4366 & 0.332776 \tabularnewline
4 & -0.046783 & -0.2562 & 0.399758 \tabularnewline
5 & -0.035427 & -0.194 & 0.423726 \tabularnewline
6 & -0.065085 & -0.3565 & 0.361986 \tabularnewline
7 & -0.041629 & -0.228 & 0.410592 \tabularnewline
8 & -0.090874 & -0.4977 & 0.31115 \tabularnewline
9 & -0.041106 & -0.2251 & 0.411696 \tabularnewline
10 & -0.070514 & -0.3862 & 0.35103 \tabularnewline
11 & -0.015497 & -0.0849 & 0.46646 \tabularnewline
12 & -0.047041 & -0.2577 & 0.399216 \tabularnewline
13 & -0.073493 & -0.4025 & 0.345071 \tabularnewline
14 & -0.064465 & -0.3531 & 0.363245 \tabularnewline
\hline
\end{tabular}
%Source: https://freestatistics.org/blog/index.php?pk=114500&T=2

[TABLE]
[ROW][C]Partial Autocorrelation Function[/C][/ROW]
[ROW][C]Time lag k[/C][C]PACF(k)[/C][C]T-STAT[/C][C]P-value[/C][/ROW]
[ROW][C]1[/C][C]0.923875[/C][C]5.0603[/C][C]1e-05[/C][/ROW]
[ROW][C]2[/C][C]-0.178928[/C][C]-0.98[/C][C]0.167454[/C][/ROW]
[ROW][C]3[/C][C]-0.079706[/C][C]-0.4366[/C][C]0.332776[/C][/ROW]
[ROW][C]4[/C][C]-0.046783[/C][C]-0.2562[/C][C]0.399758[/C][/ROW]
[ROW][C]5[/C][C]-0.035427[/C][C]-0.194[/C][C]0.423726[/C][/ROW]
[ROW][C]6[/C][C]-0.065085[/C][C]-0.3565[/C][C]0.361986[/C][/ROW]
[ROW][C]7[/C][C]-0.041629[/C][C]-0.228[/C][C]0.410592[/C][/ROW]
[ROW][C]8[/C][C]-0.090874[/C][C]-0.4977[/C][C]0.31115[/C][/ROW]
[ROW][C]9[/C][C]-0.041106[/C][C]-0.2251[/C][C]0.411696[/C][/ROW]
[ROW][C]10[/C][C]-0.070514[/C][C]-0.3862[/C][C]0.35103[/C][/ROW]
[ROW][C]11[/C][C]-0.015497[/C][C]-0.0849[/C][C]0.46646[/C][/ROW]
[ROW][C]12[/C][C]-0.047041[/C][C]-0.2577[/C][C]0.399216[/C][/ROW]
[ROW][C]13[/C][C]-0.073493[/C][C]-0.4025[/C][C]0.345071[/C][/ROW]
[ROW][C]14[/C][C]-0.064465[/C][C]-0.3531[/C][C]0.363245[/C][/ROW]
[/TABLE]
Source: https://freestatistics.org/blog/index.php?pk=114500&T=2

Globally Unique Identifier (entire table): ba.freestatistics.org/blog/index.php?pk=114500&T=2

As an alternative you can also use a QR Code:  

The GUIDs for individual cells are displayed in the table below:

Partial Autocorrelation Function
Time lag kPACF(k)T-STATP-value
10.9238755.06031e-05
2-0.178928-0.980.167454
3-0.079706-0.43660.332776
4-0.046783-0.25620.399758
5-0.035427-0.1940.423726
6-0.065085-0.35650.361986
7-0.041629-0.2280.410592
8-0.090874-0.49770.31115
9-0.041106-0.22510.411696
10-0.070514-0.38620.35103
11-0.015497-0.08490.46646
12-0.047041-0.25770.399216
13-0.073493-0.40250.345071
14-0.064465-0.35310.363245


Parameters (Session):
par1 = Default ; par2 = 1 ; par3 = 0 ; par4 = 0 ; par5 = 12 ; par6 = White Noise ; par7 = 0.95 ;
Parameters (R input):
par1 = Default ; par2 = 1 ; par3 = 0 ; par4 = 0 ; par5 = 12 ; par6 = White Noise ; par7 = 0.95 ; par8 = ;
R code (references can be found in the software module):
if (par1 == 'Default') {
par1 = 10*log10(length(x))
} else {
par1 <- as.numeric(par1)
}
par2 <- as.numeric(par2)
par3 <- as.numeric(par3)
par4 <- as.numeric(par4)
par5 <- as.numeric(par5)
if (par6 == 'White Noise') par6 <- 'white' else par6 <- 'ma'
par7 <- as.numeric(par7)
if (par2 == 0) {
x <- log(x)
} else {
x <- (x ^ par2 - 1) / par2
}
if (par3 > 0) x <- diff(x,lag=1,difference=par3)
if (par4 > 0) x <- diff(x,lag=par5,difference=par4)
bitmap(file='pic1.png')
racf <- acf(x, par1, main='Autocorrelation', xlab='time lag', ylab='ACF', ci.type=par6, ci=par7, sub=paste('(lambda=',par2,', d=',par3,', D=',par4,', CI=', par7, ', CI type=',par6,')',sep=''))
dev.off()
bitmap(file='pic2.png')
rpacf <- pacf(x,par1,main='Partial Autocorrelation',xlab='lags',ylab='PACF')
dev.off()
(myacf <- c(racf$acf))
(mypacf <- c(rpacf$acf))
lengthx <- length(x)
sqrtn <- sqrt(lengthx)
load(file='createtable')
a<-table.start()
a<-table.row.start(a)
a<-table.element(a,'Autocorrelation Function',4,TRUE)
a<-table.row.end(a)
a<-table.row.start(a)
a<-table.element(a,'Time lag k',header=TRUE)
a<-table.element(a,hyperlink('basics.htm','ACF(k)','click here for more information about the Autocorrelation Function'),header=TRUE)
a<-table.element(a,'T-STAT',header=TRUE)
a<-table.element(a,'P-value',header=TRUE)
a<-table.row.end(a)
for (i in 2:(par1+1)) {
a<-table.row.start(a)
a<-table.element(a,i-1,header=TRUE)
a<-table.element(a,round(myacf[i],6))
mytstat <- myacf[i]*sqrtn
a<-table.element(a,round(mytstat,4))
a<-table.element(a,round(1-pt(abs(mytstat),lengthx),6))
a<-table.row.end(a)
}
a<-table.end(a)
table.save(a,file='mytable.tab')
a<-table.start()
a<-table.row.start(a)
a<-table.element(a,'Partial Autocorrelation Function',4,TRUE)
a<-table.row.end(a)
a<-table.row.start(a)
a<-table.element(a,'Time lag k',header=TRUE)
a<-table.element(a,hyperlink('basics.htm','PACF(k)','click here for more information about the Partial Autocorrelation Function'),header=TRUE)
a<-table.element(a,'T-STAT',header=TRUE)
a<-table.element(a,'P-value',header=TRUE)
a<-table.row.end(a)
for (i in 1:par1) {
a<-table.row.start(a)
a<-table.element(a,i,header=TRUE)
a<-table.element(a,round(mypacf[i],6))
mytstat <- mypacf[i]*sqrtn
a<-table.element(a,round(mytstat,4))
a<-table.element(a,round(1-pt(abs(mytstat),lengthx),6))
a<-table.row.end(a)
}
a<-table.end(a)
table.save(a,file='mytable1.tab')