| Multiple Linear Regression - Estimated Regression Equation |
| SWS[t] = + 101.747169187514 + 0.85898554456651PS[t] + 0.0483563309262616L[t] + 0.00897769792082362WB[t] -0.00229591302762992WBR[t] -0.0465855631325104TG[t] -24.6233778463787P[t] -39.2386116719056S[t] + 11.5295140043652D[t] + e[t] |
| Multiple Linear Regression - Ordinary Least Squares | |||||
| Variable | Parameter | S.D. | T-STAT H0: parameter = 0 | 2-tail p-value | 1-tail p-value |
| (Intercept) | 101.747169187514 | 69.11223 | 1.4722 | 0.14688 | 0.07344 |
| PS | 0.85898554456651 | 0.075204 | 11.4221 | 0 | 0 |
| L | 0.0483563309262616 | 0.118259 | 0.4089 | 0.684258 | 0.342129 |
| WB | 0.00897769792082362 | 0.300033 | 0.0299 | 0.976241 | 0.488121 |
| WBR | -0.00229591302762992 | 0.163977 | -0.014 | 0.988881 | 0.494441 |
| TG | -0.0465855631325104 | 0.104604 | -0.4454 | 0.65788 | 0.32894 |
| P | -24.6233778463787 | 51.141729 | -0.4815 | 0.632162 | 0.316081 |
| S | -39.2386116719056 | 33.633703 | -1.1666 | 0.248576 | 0.124288 |
| D | 11.5295140043652 | 67.319369 | 0.1713 | 0.864667 | 0.432333 |
| Multiple Linear Regression - Regression Statistics | |
| Multiple R | 0.87368168438707 |
| R-squared | 0.763319685633427 |
| Adjusted R-squared | 0.727594355163 |
| F-TEST (value) | 21.3663435882087 |
| F-TEST (DF numerator) | 8 |
| F-TEST (DF denominator) | 53 |
| p-value | 4.61852778244065e-14 |
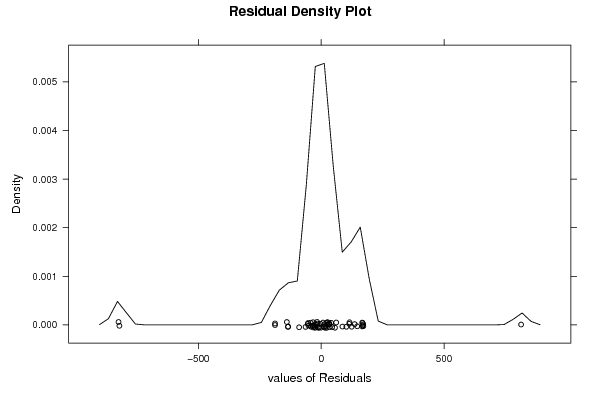
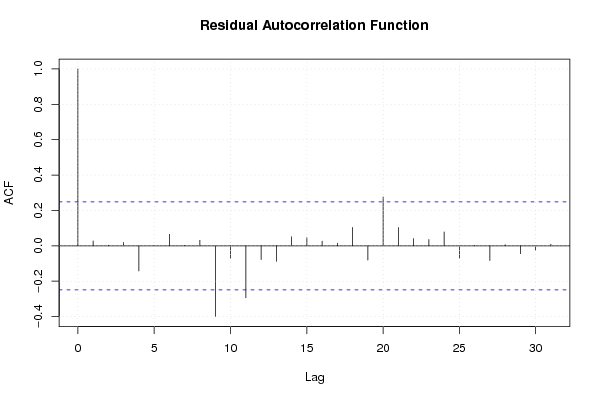
| Multiple Linear Regression - Residual Statistics | |
| Residual Standard Deviation | 215.781932434378 |
| Sum Squared Residuals | 2467777.64535107 |
| Multiple Linear Regression - Actuals, Interpolation, and Residuals | |||
| Time or Index | Actuals | Interpolation Forecast | Residuals Prediction Error |
| 1 | -999 | -1019.98855021996 | 20.9885502199617 |
| 2 | 6.3 | 23.1997715882405 | -16.8997715882405 |
| 3 | -999 | -810.9017891256 | -188.0982108744 |
| 4 | -999 | -972.862401292858 | -26.1375987071421 |
| 5 | 2.1 | -134.086488336087 | 136.186488336087 |
| 6 | 0.1 | -113.967656659258 | 114.067656659258 |
| 7 | 15.8 | 52.0525305885091 | -36.2525305885091 |
| 8 | 5.2 | -161.705444917625 | 166.905444917625 |
| 9 | 10.9 | 11.6583677803470 | -0.758367780347039 |
| 10 | 8.3 | 41.7784854532164 | -33.4784854532164 |
| 11 | 11 | -135.807599473810 | 146.807599473810 |
| 12 | 3.2 | -167.750313490837 | 170.950313490837 |
| 13 | 7.6 | 36.8705213185434 | -29.2705213185434 |
| 14 | -999 | -1032.39350498793 | 33.3935049879323 |
| 15 | 6.3 | 49.4291350555717 | -43.1291350555717 |
| 16 | 8.6 | -1.83482579365001 | 10.43482579365 |
| 17 | 6.6 | -1.06338497633856 | 7.66338497633856 |
| 18 | 9.5 | -6.98404494666681 | 16.4840449466668 |
| 19 | 4.8 | 59.448336106581 | -54.6483361065811 |
| 20 | 12 | 101.884670301323 | -89.8846703013234 |
| 21 | -999 | -173.749779364453 | -825.250220635547 |
| 22 | 3.3 | -165.428959208572 | 168.728959208572 |
| 23 | 11 | 14.0600049279436 | -3.0600049279436 |
| 24 | -999 | -935.340615687664 | -63.6593843123363 |
| 25 | 4.7 | -40.216033767178 | 44.916033767178 |
| 26 | -999 | -810.81158510603 | -188.18841489397 |
| 27 | 10.4 | -23.9767045456582 | 34.3767045456582 |
| 28 | 7.4 | -95.083911500768 | 102.483911500768 |
| 29 | 2.1 | -169.482820352693 | 171.582820352693 |
| 30 | 2.1 | -811.749928402108 | 813.849928402108 |
| 31 | -999 | -980.887992807227 | -18.1120071927734 |
| 32 | 7.7 | -53.4024472946121 | 61.1024472946121 |
| 33 | 17.9 | 49.9634543470547 | -32.0634543470547 |
| 34 | 6.1 | 40.9700660191365 | -34.8700660191365 |
| 35 | 8.2 | -22.8584528150715 | 31.0584528150715 |
| 36 | 8.4 | -24.7786764252750 | 33.1786764252750 |
| 37 | 11.9 | -1.00896958411760 | 12.9089695841176 |
| 38 | 10.8 | -0.979621721599862 | 11.7796217215999 |
| 39 | 13.8 | 29.2851876082209 | -15.4851876082209 |
| 40 | 14.3 | 22.1848456725160 | -7.88484567251605 |
| 41 | -999 | -177.293234109293 | -821.706765890707 |
| 42 | 15.2 | -7.34458808446734 | 22.5445880844673 |
| 43 | 10 | -113.926646744838 | 123.926646744838 |
| 44 | 11.9 | 37.6920520027063 | -25.7920520027063 |
| 45 | 6.5 | -108.691925502891 | 115.191925502891 |
| 46 | 7.5 | -159.721196195239 | 167.221196195239 |
| 47 | -999 | -863.368253027925 | -135.631746972075 |
| 48 | 10.6 | 24.7074578556765 | -14.1074578556765 |
| 49 | 7.4 | 49.4500082748432 | -42.0500082748432 |
| 50 | 8.4 | -47.7132297017045 | 56.1132297017045 |
| 51 | 5.7 | -12.3094586953449 | 18.0094586953449 |
| 52 | 4.9 | -22.2957438554390 | 27.1957438554390 |
| 53 | -999 | -1024.34644921044 | 25.3464492104357 |
| 54 | 3.2 | -165.324047451923 | 168.524047451923 |
| 55 | -999 | -864.639046277187 | -134.360953722813 |
| 56 | 8.1 | 60.293687659716 | -52.193687659716 |
| 57 | 11 | 35.7210768395585 | -24.7210768395585 |
| 58 | 4.9 | 14.6917342828975 | -9.79173428289748 |
| 59 | 13.2 | -27.3443197157807 | 40.5443197157807 |
| 60 | 9.7 | -76.5466925864284 | 86.2466925864284 |
| 61 | 12.8 | 66.1288512629375 | -53.3288512629375 |
| 62 | -999 | -859.10291098299 | -139.897089017009 |
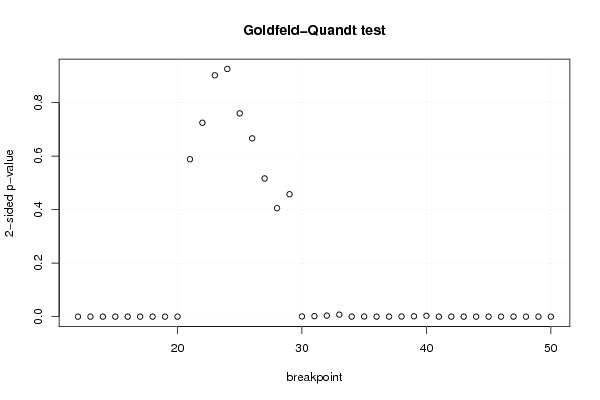
| Goldfeld-Quandt test for Heteroskedasticity | |||
| p-values | Alternative Hypothesis | ||
| breakpoint index | greater | 2-sided | less |
| 12 | 9.96973862224977e-07 | 1.99394772444995e-06 | 0.999999003026138 |
| 13 | 8.49260436245877e-08 | 1.69852087249175e-07 | 0.999999915073956 |
| 14 | 2.46545252722155e-09 | 4.9309050544431e-09 | 0.999999997534547 |
| 15 | 4.77975522074018e-11 | 9.55951044148035e-11 | 0.999999999952202 |
| 16 | 7.21835601031414e-13 | 1.44367120206283e-12 | 0.999999999999278 |
| 17 | 1.79564723558843e-14 | 3.59129447117687e-14 | 0.999999999999982 |
| 18 | 3.20455910313872e-16 | 6.40911820627745e-16 | 1 |
| 19 | 9.98058767162516e-18 | 1.99611753432503e-17 | 1 |
| 20 | 1.31542306454434e-19 | 2.63084612908868e-19 | 1 |
| 21 | 0.705842943502995 | 0.588314112994009 | 0.294157056497005 |
| 22 | 0.637633725615691 | 0.724732548768618 | 0.362366274384309 |
| 23 | 0.54895564434901 | 0.90208871130198 | 0.45104435565099 |
| 24 | 0.462912500910653 | 0.925825001821306 | 0.537087499089347 |
| 25 | 0.379949463749086 | 0.759898927498172 | 0.620050536250914 |
| 26 | 0.333257744374903 | 0.666515488749805 | 0.666742255625097 |
| 27 | 0.258305163028266 | 0.516610326056531 | 0.741694836971734 |
| 28 | 0.202685680245681 | 0.405371360491362 | 0.797314319754319 |
| 29 | 0.228803130144019 | 0.457606260288039 | 0.77119686985598 |
| 30 | 0.999576128750102 | 0.000847742499796067 | 0.000423871249898033 |
| 31 | 0.99909151284502 | 0.00181697430996150 | 0.000908487154980748 |
| 32 | 0.998094974771878 | 0.00381005045624387 | 0.00190502522812194 |
| 33 | 0.996209025993802 | 0.00758194801239593 | 0.00379097400619796 |
| 34 | 0.9998839372825 | 0.000232125435000408 | 0.000116062717500204 |
| 35 | 0.99973095016094 | 0.00053809967811941 | 0.000269049839059705 |
| 36 | 0.99995348929557 | 9.30214088604778e-05 | 4.65107044302389e-05 |
| 37 | 0.999881195113487 | 0.000237609773025733 | 0.000118804886512867 |
| 38 | 0.999755074258572 | 0.000489851482855775 | 0.000244925741427888 |
| 39 | 0.999362298760348 | 0.00127540247930338 | 0.000637701239651692 |
| 40 | 0.99841836536591 | 0.00316326926818024 | 0.00158163463409012 |
| 41 | 1 | 3.93149082272239e-22 | 1.96574541136119e-22 |
| 42 | 1 | 5.67553500437773e-21 | 2.83776750218887e-21 |
| 43 | 1 | 3.07398365230395e-19 | 1.53699182615197e-19 |
| 44 | 1 | 2.01560109383107e-17 | 1.00780054691553e-17 |
| 45 | 1 | 9.70110436599107e-16 | 4.85055218299554e-16 |
| 46 | 0.999999999999963 | 7.46333488779698e-14 | 3.73166744389849e-14 |
| 47 | 0.999999999996005 | 7.99054504135233e-12 | 3.99527252067617e-12 |
| 48 | 0.999999999686606 | 6.26788520370011e-10 | 3.13394260185005e-10 |
| 49 | 0.999999968497706 | 6.30045888298112e-08 | 3.15022944149056e-08 |
| 50 | 0.999996975078445 | 6.04984311026282e-06 | 3.02492155513141e-06 |
| Meta Analysis of Goldfeld-Quandt test for Heteroskedasticity | |||
| Description | # significant tests | % significant tests | OK/NOK |
| 1% type I error level | 30 | 0.769230769230769 | NOK |
| 5% type I error level | 30 | 0.769230769230769 | NOK |
| 10% type I error level | 30 | 0.769230769230769 | NOK |