| Multiple Linear Regression - Estimated Regression Equation |
| SWS[t] = + 58.5962033954784 + 0.955258558887444PS[t] + 0.0198987966065785L[t] + 0.00797442355260723Wb[t] + 0.0026217940522085Wbr[t] -0.067620433809013Tg[t] -2.79466247616151P[t] -22.0902142737359S[t] -11.4834724299415D[t] + e[t] |
| Multiple Linear Regression - Ordinary Least Squares | |||||
| Variable | Parameter | S.D. | T-STAT H0: parameter = 0 | 2-tail p-value | 1-tail p-value |
| (Intercept) | 58.5962033954784 | 55.685707 | 1.0523 | 0.297451 | 0.148726 |
| PS | 0.955258558887444 | 0.062235 | 15.3493 | 0 | 0 |
| L | 0.0198987966065785 | 0.098519 | 0.202 | 0.840706 | 0.420353 |
| Wb | 0.00797442355260723 | 0.037502 | 0.2126 | 0.832423 | 0.416211 |
| Wbr | 0.0026217940522085 | 0.024641 | 0.1064 | 0.915666 | 0.457833 |
| Tg | -0.067620433809013 | 0.086431 | -0.7824 | 0.437481 | 0.21874 |
| P | -2.79466247616151 | 44.714931 | -0.0625 | 0.9504 | 0.4752 |
| S | -22.0902142737359 | 29.839333 | -0.7403 | 0.462382 | 0.231191 |
| D | -11.4834724299415 | 59.599358 | -0.1927 | 0.847948 | 0.423974 |
| Multiple Linear Regression - Regression Statistics | |
| Multiple R | 0.918797752642164 |
| R-squared | 0.844189310260292 |
| Adjusted R-squared | 0.8206707155826 |
| F-TEST (value) | 35.8945473498481 |
| F-TEST (DF numerator) | 8 |
| F-TEST (DF denominator) | 53 |
| p-value | 0 |
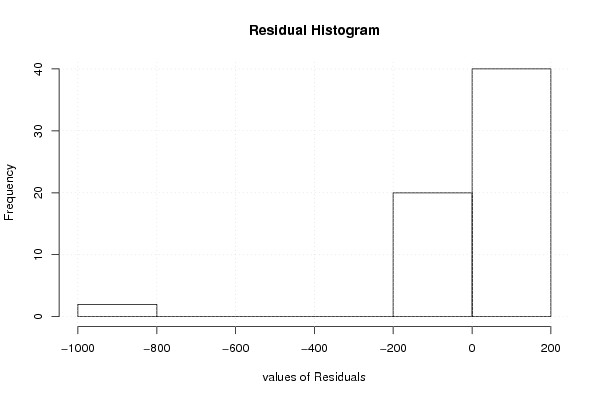
| Multiple Linear Regression - Residual Statistics | |
| Residual Standard Deviation | 179.879442882999 |
| Sum Squared Residuals | 1714900.54051059 |
| Multiple Linear Regression - Actuals, Interpolation, and Residuals | |||
| Time or Index | Actuals | Interpolation Forecast | Residuals Prediction Error |
| 1 | -999 | -1023.80215733260 | 24.8021573326012 |
| 2 | 6.3 | 10.1434030540876 | -3.84340305408762 |
| 3 | -999 | -935.7103858578 | -63.2896141422008 |
| 4 | -999 | -1009.85838311061 | 10.8583831106134 |
| 5 | 2.1 | -112.896438635618 | 114.996438635618 |
| 6 | 9.1 | -97.288180709049 | 106.388180709049 |
| 7 | 15.8 | 23.9656705741970 | -8.16567057419695 |
| 8 | 5.2 | -132.195444711778 | 137.395444711778 |
| 9 | 10.9 | -0.0329167456248864 | 10.9329167456249 |
| 10 | 8.3 | 10.5769915678138 | -2.27699156781375 |
| 11 | 11 | -95.652956488009 | 106.652956488009 |
| 12 | 3.2 | -136.164113678583 | 139.364113678583 |
| 13 | 7.6 | 58.213511222444 | -50.613511222444 |
| 14 | -999 | -1098.84380295373 | 99.8438029537311 |
| 15 | 6.3 | 21.4672688641947 | -15.1672688641947 |
| 16 | 8.6 | -14.9494591585597 | 23.5494591585597 |
| 17 | 6.6 | -3.7620213357635 | 10.3620213357635 |
| 18 | 9.5 | -20.8869854109359 | 30.3869854109359 |
| 19 | 4.8 | 69.6659738614078 | -64.8659738614079 |
| 20 | 12 | 96.4378671076884 | -84.4378671076884 |
| 21 | -999 | -143.448682139840 | -855.55131786016 |
| 22 | 3.3 | -131.855682624405 | 135.155682624406 |
| 23 | 11 | 7.40219302429237 | 3.59780697570763 |
| 24 | -999 | -1011.88926148677 | 12.8892614867712 |
| 25 | 4.7 | -39.1362612444858 | 43.8362612444858 |
| 26 | -999 | -935.410157740953 | -63.5898422590467 |
| 27 | 10.4 | -10.3728598073012 | 20.7728598073012 |
| 28 | 7.4 | -71.2416800562137 | 78.6416800562137 |
| 29 | 2.1 | -138.414506997427 | 140.514506997427 |
| 30 | -999 | -937.182692428374 | -61.8173075716263 |
| 31 | -999 | -1061.95724408975 | 62.9572440897535 |
| 32 | 7.7 | -45.5557209304382 | 53.2557209304382 |
| 33 | 17.9 | 21.2356559542704 | -3.33565595427038 |
| 34 | 6.1 | 11.9332517203540 | -5.83325172035399 |
| 35 | 8.2 | -0.172876230451424 | 8.37287623045142 |
| 36 | 8.4 | -26.5435069594401 | 34.9435069594401 |
| 37 | 11.9 | -9.10114583331244 | 21.0011458333124 |
| 38 | 10.8 | -9.2001124627954 | 20.0001124627954 |
| 39 | 13.8 | 24.1007622691409 | -10.3007622691409 |
| 40 | 14.3 | 14.4656092510884 | -0.165609251088387 |
| 41 | -999 | -148.295378247145 | -850.704621752855 |
| 42 | 15.2 | -21.6046392010702 | 36.8046392010702 |
| 43 | 10 | -96.7297281254276 | 106.729728125428 |
| 44 | 11.9 | 8.82112871501679 | 3.07887128498321 |
| 45 | 6.5 | -90.2982721901517 | 96.7982721901517 |
| 46 | 7.5 | -124.072205142965 | 131.572205142965 |
| 47 | -999 | -972.294284505327 | -26.7057154946735 |
| 48 | 10.6 | -5.16403386210347 | 15.7640338621035 |
| 49 | 7.4 | 21.3651703817397 | -13.9651703817397 |
| 50 | 8.4 | -45.0735577948545 | 53.4735577948545 |
| 51 | 5.7 | -28.3178394074758 | 34.0178394074758 |
| 52 | 4.9 | -42.9524398183612 | 47.8524398183612 |
| 53 | -999 | -1086.9779074841 | 87.9779074841008 |
| 54 | 3.2 | -131.583702475107 | 134.783702475107 |
| 55 | -999 | -974.232983000037 | -24.7670169999626 |
| 56 | 8.1 | 74.8821850857198 | -66.7821850857198 |
| 57 | 11 | 6.19312619689964 | 4.80687380310036 |
| 58 | 4.9 | -19.1774351904285 | 24.0774351904285 |
| 59 | 13.2 | -17.5089059827871 | 30.7089059827871 |
| 60 | 9.7 | -77.75106700643 | 87.45106700643 |
| 61 | 12.8 | 24.8890440238665 | -12.0890440238665 |
| 62 | -999 | -939.898796279822 | -59.1012037201784 |
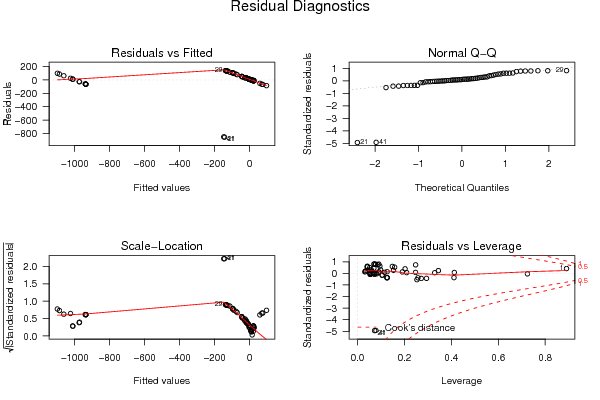
| Goldfeld-Quandt test for Heteroskedasticity | |||
| p-values | Alternative Hypothesis | ||
| breakpoint index | greater | 2-sided | less |
| 12 | 4.99658916386013e-06 | 9.99317832772025e-06 | 0.999995003410836 |
| 13 | 9.03486512656496e-08 | 1.80697302531299e-07 | 0.99999990965135 |
| 14 | 2.45472832420741e-09 | 4.90945664841482e-09 | 0.999999997545272 |
| 15 | 1.02082008681588e-10 | 2.04164017363175e-10 | 0.999999999897918 |
| 16 | 1.55627668595619e-12 | 3.11255337191239e-12 | 0.999999999998444 |
| 17 | 3.09130025553861e-14 | 6.18260051107722e-14 | 0.99999999999997 |
| 18 | 4.42630014991552e-16 | 8.85260029983105e-16 | 1 |
| 19 | 1.18497578096273e-17 | 2.36995156192546e-17 | 1 |
| 20 | 1.75260334599068e-19 | 3.50520669198137e-19 | 1 |
| 21 | 0.983893564326633 | 0.0322128713467331 | 0.0161064356733665 |
| 22 | 0.979472743491282 | 0.0410545130174355 | 0.0205272565087178 |
| 23 | 0.96685769776689 | 0.0662846044662204 | 0.0331423022331102 |
| 24 | 0.952623501218585 | 0.0947529975628296 | 0.0473764987814148 |
| 25 | 0.928115469586576 | 0.143769060826848 | 0.0718845304134239 |
| 26 | 0.894375831888925 | 0.211248336222150 | 0.105624168111075 |
| 27 | 0.850086006798014 | 0.299827986403971 | 0.149913993201986 |
| 28 | 0.80251756863795 | 0.3949648627241 | 0.19748243136205 |
| 29 | 0.982200959949649 | 0.0355980801007026 | 0.0177990400503513 |
| 30 | 0.980069179911116 | 0.0398616401777684 | 0.0199308200888842 |
| 31 | 0.96825496835754 | 0.0634900632849206 | 0.0317450316424603 |
| 32 | 0.95028529429484 | 0.0994294114103192 | 0.0497147057051596 |
| 33 | 0.923899014765026 | 0.152201970469949 | 0.0761009852349744 |
| 34 | 0.994681723053534 | 0.0106365538929329 | 0.00531827694646645 |
| 35 | 0.990148747538695 | 0.0197025049226103 | 0.00985125246130514 |
| 36 | 0.997937462801315 | 0.00412507439737078 | 0.00206253719868539 |
| 37 | 0.99594632756856 | 0.00810734486287853 | 0.00405367243143927 |
| 38 | 0.993287605242766 | 0.0134247895144674 | 0.00671239475723369 |
| 39 | 0.98679303395091 | 0.0264139320981820 | 0.0132069660490910 |
| 40 | 0.975156637136748 | 0.0496867257265045 | 0.0248433628632523 |
| 41 | 1 | 3.45288085588953e-21 | 1.72644042794477e-21 |
| 42 | 1 | 3.81194452559832e-20 | 1.90597226279916e-20 |
| 43 | 1 | 1.76417004321183e-18 | 8.82085021605915e-19 |
| 44 | 1 | 9.63218265915105e-17 | 4.81609132957553e-17 |
| 45 | 0.999999999999998 | 3.42067378438969e-15 | 1.71033689219485e-15 |
| 46 | 0.99999999999989 | 2.19663493610247e-13 | 1.09831746805123e-13 |
| 47 | 0.999999999990014 | 1.99712396035696e-11 | 9.98561980178479e-12 |
| 48 | 0.999999999403442 | 1.19311619498435e-09 | 5.96558097492173e-10 |
| 49 | 0.999999944139456 | 1.11721088787161e-07 | 5.58605443935805e-08 |
| 50 | 0.999995765297822 | 8.46940435602068e-06 | 4.23470217801034e-06 |
| Meta Analysis of Goldfeld-Quandt test for Heteroskedasticity | |||
| Description | # significant tests | % significant tests | OK/NOK |
| 1% type I error level | 21 | 0.538461538461538 | NOK |
| 5% type I error level | 30 | 0.769230769230769 | NOK |
| 10% type I error level | 34 | 0.871794871794872 | NOK |