| Multiple Linear Regression - Estimated Regression Equation |
| DowJones[t] = + 3294.69304179701 + 1902.00849170329Eonia[t] + 75.8419583730737deposits[t] -40.7278509972586`2JAAR`[t] -0.0314633513384605Goudkoers[t] + 19.7117420762761Brent[t] -859.836876632501gewrentevoet[t] + 5.39966362404075kasbons[t] + e[t] |
| Multiple Linear Regression - Ordinary Least Squares | |||||
| Variable | Parameter | S.D. | T-STAT H0: parameter = 0 | 2-tail p-value | 1-tail p-value |
| (Intercept) | 3294.69304179701 | 1695.749628 | 1.9429 | 0.057347 | 0.028673 |
| Eonia | 1902.00849170329 | 156.881056 | 12.1239 | 0 | 0 |
| deposits | 75.8419583730737 | 25.399594 | 2.986 | 0.004272 | 0.002136 |
| `2JAAR` | -40.7278509972586 | 10.002704 | -4.0717 | 0.000156 | 7.8e-05 |
| Goudkoers | -0.0314633513384605 | 0.056027 | -0.5616 | 0.576772 | 0.288386 |
| Brent | 19.7117420762761 | 5.886305 | 3.3487 | 0.0015 | 0.00075 |
| gewrentevoet | -859.836876632501 | 345.900734 | -2.4858 | 0.016115 | 0.008057 |
| kasbons | 5.39966362404075 | 1.280336 | 4.2174 | 9.7e-05 | 4.8e-05 |
| Multiple Linear Regression - Regression Statistics | |
| Multiple R | 0.921944437296067 |
| R-squared | 0.849981545461161 |
| Adjusted R-squared | 0.830167787314522 |
| F-TEST (value) | 42.8985525699141 |
| F-TEST (DF numerator) | 7 |
| F-TEST (DF denominator) | 53 |
| p-value | 0 |
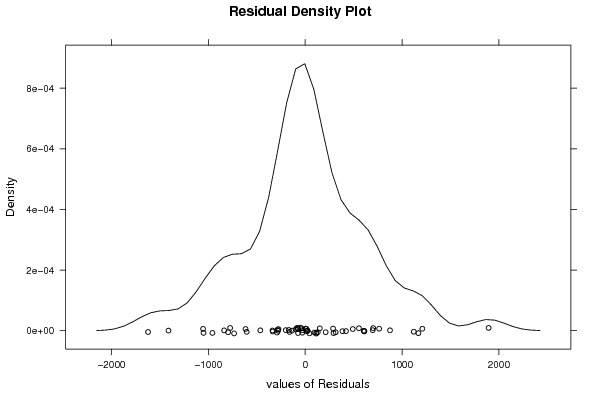
| Multiple Linear Regression - Residual Statistics | |
| Residual Standard Deviation | 676.704973303932 |
| Sum Squared Residuals | 24270269.9073966 |
| Multiple Linear Regression - Actuals, Interpolation, and Residuals | |||
| Time or Index | Actuals | Interpolation Forecast | Residuals Prediction Error |
| 1 | 10554.27 | 10528.6734857967 | 25.5965142033081 |
| 2 | 10532.54 | 10561.767149073 | -29.2271490730023 |
| 3 | 10324.31 | 10493.6990091934 | -169.389009193449 |
| 4 | 10695.25 | 10380.5908230387 | 314.65917696132 |
| 5 | 10827.81 | 10989.0402471199 | -161.230247119897 |
| 6 | 10872.48 | 11207.0833375583 | -334.603337558325 |
| 7 | 10971.19 | 11069.4769875323 | -98.2869875323122 |
| 8 | 11145.65 | 11436.0147278919 | -290.364727891915 |
| 9 | 11234.68 | 11023.3500760797 | 211.329923920305 |
| 10 | 11333.88 | 11613.3972523385 | -279.517252338512 |
| 11 | 10997.97 | 11955.837659555 | -957.867659555005 |
| 12 | 11036.89 | 11500.2286759272 | -463.338675927247 |
| 13 | 11257.35 | 11861.4299011712 | -604.079901171181 |
| 14 | 11533.59 | 11733.9043614078 | -200.314361407788 |
| 15 | 11963.12 | 11992.6149868671 | -29.494986867111 |
| 16 | 12185.15 | 12171.5976608431 | 13.5523391569473 |
| 17 | 12377.62 | 12453.7087195467 | -76.0887195467481 |
| 18 | 12512.89 | 12598.0402841931 | -85.1502841930693 |
| 19 | 12631.48 | 12246.4840552193 | 384.995944780666 |
| 20 | 12268.53 | 12543.9667949287 | -275.436794928708 |
| 21 | 12754.8 | 12793.0621733485 | -38.2621733485098 |
| 22 | 13407.75 | 13278.1457988788 | 129.6042011212 |
| 23 | 13480.21 | 13187.6798302622 | 292.530169737786 |
| 24 | 13673.28 | 12909.3965343773 | 763.883465622682 |
| 25 | 13239.71 | 12631.2063680423 | 608.503631957706 |
| 26 | 13557.69 | 12347.9190563141 | 1209.77094368588 |
| 27 | 13901.28 | 12006.8755182837 | 1894.4044817163 |
| 28 | 13200.58 | 12588.5994010953 | 611.980598904663 |
| 29 | 13406.97 | 12237.8219763913 | 1169.14802360868 |
| 30 | 12538.12 | 12587.9431892655 | -49.82318926547 |
| 31 | 12419.57 | 12397.6305730107 | 21.9394269892975 |
| 32 | 12193.88 | 12969.1044047922 | -775.224404792186 |
| 33 | 12656.63 | 12642.9362301894 | 13.6937698105921 |
| 34 | 12812.48 | 12886.1446702486 | -73.6646702485682 |
| 35 | 12056.67 | 12340.5011832486 | -283.831183248593 |
| 36 | 11322.38 | 11938.3219296858 | -615.94192968583 |
| 37 | 11530.75 | 11380.0514826364 | 150.698517363592 |
| 38 | 11114.08 | 12164.0521395884 | -1049.97213958838 |
| 39 | 9181.73 | 10593.2814057205 | -1411.55140572055 |
| 40 | 8614.55 | 9410.4667686929 | -795.916768692905 |
| 41 | 8595.56 | 8174.04321224578 | 421.516787754221 |
| 42 | 8396.2 | 7274.74310189532 | 1121.45689810468 |
| 43 | 7690.5 | 8028.02975046156 | -337.529750461559 |
| 44 | 7235.47 | 8290.09460984531 | -1054.62460984531 |
| 45 | 7992.12 | 7896.30402779063 | 95.8159722093657 |
| 46 | 8398.37 | 10020.8744525515 | -1622.5044525515 |
| 47 | 8593 | 9430.3145697153 | -837.314569715294 |
| 48 | 8679.75 | 8391.92749340474 | 287.822506595261 |
| 49 | 9374.63 | 8677.5817127196 | 697.048287280401 |
| 50 | 9634.97 | 9520.5760951533 | 114.393904846689 |
| 51 | 9857.34 | 9742.59832944376 | 114.741670556242 |
| 52 | 10238.83 | 10375.3727019946 | -136.542701994567 |
| 53 | 10433.44 | 9878.14278372166 | 555.29721627834 |
| 54 | 10471.24 | 9867.4113426894 | 603.828657310608 |
| 55 | 10214.51 | 9723.24523136488 | 491.264768635117 |
| 56 | 10677.52 | 9975.25099015872 | 702.269009841283 |
| 57 | 11052.15 | 10176.0831431029 | 876.06685689712 |
| 58 | 10500.19 | 10573.1096162135 | -72.9196162134961 |
| 59 | 10159.27 | 10893.3075441308 | -734.03754413081 |
| 60 | 10222.24 | 10178.3864329348 | 43.8535670651953 |
| 61 | 10350.4 | 10348.0160291076 | 2.38397089234955 |
| Goldfeld-Quandt test for Heteroskedasticity | |||
| p-values | Alternative Hypothesis | ||
| breakpoint index | greater | 2-sided | less |
| 11 | 0.008695335921963 | 0.017390671843926 | 0.991304664078037 |
| 12 | 0.00250947333293214 | 0.00501894666586428 | 0.997490526667068 |
| 13 | 0.000570400937334747 | 0.00114080187466949 | 0.999429599062665 |
| 14 | 0.000131601600583173 | 0.000263203201166347 | 0.999868398399417 |
| 15 | 2.61510263608374e-05 | 5.23020527216747e-05 | 0.999973848973639 |
| 16 | 4.60673042409094e-05 | 9.21346084818188e-05 | 0.99995393269576 |
| 17 | 2.38337896278801e-05 | 4.76675792557602e-05 | 0.999976166210372 |
| 18 | 2.40889505652024e-05 | 4.81779011304049e-05 | 0.999975911049435 |
| 19 | 2.49538186387101e-05 | 4.99076372774203e-05 | 0.999975046181361 |
| 20 | 3.77314338137755e-05 | 7.5462867627551e-05 | 0.999962268566186 |
| 21 | 7.84173641128795e-05 | 0.000156834728225759 | 0.999921582635887 |
| 22 | 0.000521339521362967 | 0.00104267904272593 | 0.999478660478637 |
| 23 | 0.00154610356362428 | 0.00309220712724855 | 0.998453896436376 |
| 24 | 0.00293789580358749 | 0.00587579160717497 | 0.997062104196413 |
| 25 | 0.00309831861283302 | 0.00619663722566604 | 0.996901681387167 |
| 26 | 0.00308356465233821 | 0.00616712930467642 | 0.996916435347662 |
| 27 | 0.00821443241724002 | 0.01642886483448 | 0.99178556758276 |
| 28 | 0.0134115358575821 | 0.0268230717151641 | 0.986588464142418 |
| 29 | 0.0290397708173199 | 0.0580795416346398 | 0.97096022918268 |
| 30 | 0.0288919557013129 | 0.0577839114026258 | 0.971108044298687 |
| 31 | 0.0249825432377508 | 0.0499650864755017 | 0.97501745676225 |
| 32 | 0.0203545569522486 | 0.0407091139044971 | 0.979645443047751 |
| 33 | 0.0162201104609635 | 0.032440220921927 | 0.983779889539037 |
| 34 | 0.078967356684802 | 0.157934713369604 | 0.921032643315198 |
| 35 | 0.10939723584515 | 0.2187944716903 | 0.89060276415485 |
| 36 | 0.18691685814846 | 0.373833716296919 | 0.81308314185154 |
| 37 | 0.178226576719367 | 0.356453153438734 | 0.821773423280633 |
| 38 | 0.5111406482405 | 0.977718703519 | 0.4888593517595 |
| 39 | 0.832949963804907 | 0.334100072390186 | 0.167050036195093 |
| 40 | 0.791477577999591 | 0.417044844000817 | 0.208522422000409 |
| 41 | 0.738571374874437 | 0.522857250251126 | 0.261428625125563 |
| 42 | 0.943210773380558 | 0.113578453238885 | 0.0567892266194424 |
| 43 | 0.985728729021136 | 0.0285425419577282 | 0.0142712709788641 |
| 44 | 0.974971407392774 | 0.0500571852144522 | 0.0250285926072261 |
| 45 | 0.997877707389202 | 0.00424458522159617 | 0.00212229261079808 |
| 46 | 0.999627369568926 | 0.000745260862147777 | 0.000372630431073889 |
| 47 | 0.999661069880692 | 0.000677860238616265 | 0.000338930119308133 |
| 48 | 0.998746579698073 | 0.00250684060385377 | 0.00125342030192689 |
| 49 | 0.999427185158887 | 0.00114562968222598 | 0.000572814841112992 |
| 50 | 0.995972916797643 | 0.00805416640471374 | 0.00402708320235687 |
| Meta Analysis of Goldfeld-Quandt test for Heteroskedasticity | |||
| Description | # significant tests | % significant tests | OK/NOK |
| 1% type I error level | 21 | 0.525 | NOK |
| 5% type I error level | 28 | 0.7 | NOK |
| 10% type I error level | 31 | 0.775 | NOK |