Free Statistics

of Irreproducible Research!

Author's title

Author*The author of this computation has been verified*
R Software Modulerwasp_arimabackwardselection.wasp
Title produced by softwareARIMA Backward Selection
Date of computationWed, 22 Dec 2010 15:59:01 +0000
Cite this page as followsStatistical Computations at FreeStatistics.org, Office for Research Development and Education, URL https://freestatistics.org/blog/index.php?v=date/2010/Dec/22/t12930334313ix0j89dqxdj8oe.htm/, Retrieved Mon, 06 May 2024 10:34:30 +0000
Statistical Computations at FreeStatistics.org, Office for Research Development and Education, URL https://freestatistics.org/blog/index.php?pk=114336, Retrieved Mon, 06 May 2024 10:34:30 +0000
QR Codes:

Original text written by user:
IsPrivate?No (this computation is public)
User-defined keywords
Estimated Impact168
Family? (F = Feedback message, R = changed R code, M = changed R Module, P = changed Parameters, D = changed Data)
-     [Univariate Explorative Data Analysis] [Run Sequence gebo...] [2008-12-12 13:32:37] [76963dc1903f0f612b6153510a3818cf]
- R  D  [Univariate Explorative Data Analysis] [Run Sequence gebo...] [2008-12-17 12:14:40] [76963dc1903f0f612b6153510a3818cf]
-         [Univariate Explorative Data Analysis] [Run Sequence Plot...] [2008-12-22 18:19:51] [1ce0d16c8f4225c977b42c8fa93bc163]
- RMP       [Univariate Data Series] [Identifying Integ...] [2009-11-22 12:08:06] [b98453cac15ba1066b407e146608df68]
- RMP         [Standard Deviation-Mean Plot] [Births] [2010-11-29 10:52:49] [b98453cac15ba1066b407e146608df68]
- RMP           [ARIMA Backward Selection] [Births] [2010-11-29 17:47:06] [b98453cac15ba1066b407e146608df68]
-   PD            [ARIMA Backward Selection] [] [2010-12-07 14:40:48] [dd4fe494cff2ee46c12b15bdc7b848ca]
-   PD                [ARIMA Backward Selection] [] [2010-12-22 15:59:01] [6c31f786e793d35ef3a03978bc5de774] [Current]
Feedback Forum

Post a new message
Dataseries X:
320
324
343
295
301
367
196
182
342
361
333
330
345
323
365
323
316
358
235
169
430
409
407
341
326
374
364
349
300
385
304
196
443
414
325
388
356
386
444
387
327
448
225
182
460
411
342
361
377
331
428
340
352
461
221
198
422
329
320
375
364
351
380
319
322
386
221
187
343
342
365
313
356
337
389
326
343
357
220
218
391
425
332
298
360
336
325
393
301
426
265
210
429
440
357
431
442
422
544
420
396
482
261
211
448
468
464
425


Summary of computational transaction
Raw Inputview raw input (R code)
Raw Outputview raw output of R engine
Computing time10 seconds
R Server'RServer@AstonUniversity' @ vre.aston.ac.uk

\begin{tabular}{lllllllll}
\hline
Summary of computational transaction \tabularnewline
Raw Input & view raw input (R code)  \tabularnewline
Raw Output & view raw output of R engine  \tabularnewline
Computing time & 10 seconds \tabularnewline
R Server & 'RServer@AstonUniversity' @ vre.aston.ac.uk \tabularnewline
\hline
\end{tabular}
%Source: https://freestatistics.org/blog/index.php?pk=114336&T=0

[TABLE]
[ROW][C]Summary of computational transaction[/C][/ROW]
[ROW][C]Raw Input[/C][C]view raw input (R code) [/C][/ROW]
[ROW][C]Raw Output[/C][C]view raw output of R engine [/C][/ROW]
[ROW][C]Computing time[/C][C]10 seconds[/C][/ROW]
[ROW][C]R Server[/C][C]'RServer@AstonUniversity' @ vre.aston.ac.uk[/C][/ROW]
[/TABLE]
Source: https://freestatistics.org/blog/index.php?pk=114336&T=0

Globally Unique Identifier (entire table): ba.freestatistics.org/blog/index.php?pk=114336&T=0

As an alternative you can also use a QR Code:  

The GUIDs for individual cells are displayed in the table below:

Summary of computational transaction
Raw Inputview raw input (R code)
Raw Outputview raw output of R engine
Computing time10 seconds
R Server'RServer@AstonUniversity' @ vre.aston.ac.uk


ARIMA Parameter Estimation and Backward Selection
Iterationar1ar2ar3ma1sar1sar2sma1
Estimates ( 1 )-0.07840.39730.50310.3414-0.0682-0.1188-0.9994
(p-val)(0.6562 )(4e-04 )(0 )(0.0678 )(0.5892 )(0.3628 )(0.0338 )
Estimates ( 2 )00.37370.48320.2696-0.0722-0.1189-0.9994
(p-val)(NA )(2e-04 )(0 )(0.0066 )(0.5668 )(0.3585 )(0.0304 )
Estimates ( 3 )00.36910.46320.26530-0.1059-1
(p-val)(NA )(2e-04 )(0 )(0.0072 )(NA )(0.4188 )(2e-04 )
Estimates ( 4 )00.35470.48490.26300-1
(p-val)(NA )(2e-04 )(0 )(0.0073 )(NA )(NA )(0 )
Estimates ( 5 )NANANANANANANA
(p-val)(NA )(NA )(NA )(NA )(NA )(NA )(NA )
Estimates ( 6 )NANANANANANANA
(p-val)(NA )(NA )(NA )(NA )(NA )(NA )(NA )
Estimates ( 7 )NANANANANANANA
(p-val)(NA )(NA )(NA )(NA )(NA )(NA )(NA )
Estimates ( 8 )NANANANANANANA
(p-val)(NA )(NA )(NA )(NA )(NA )(NA )(NA )
Estimates ( 9 )NANANANANANANA
(p-val)(NA )(NA )(NA )(NA )(NA )(NA )(NA )
Estimates ( 10 )NANANANANANANA
(p-val)(NA )(NA )(NA )(NA )(NA )(NA )(NA )
Estimates ( 11 )NANANANANANANA
(p-val)(NA )(NA )(NA )(NA )(NA )(NA )(NA )
Estimates ( 12 )NANANANANANANA
(p-val)(NA )(NA )(NA )(NA )(NA )(NA )(NA )
Estimates ( 13 )NANANANANANANA
(p-val)(NA )(NA )(NA )(NA )(NA )(NA )(NA )

\begin{tabular}{lllllllll}
\hline
ARIMA Parameter Estimation and Backward Selection \tabularnewline
Iteration & ar1 & ar2 & ar3 & ma1 & sar1 & sar2 & sma1 \tabularnewline
Estimates ( 1 ) & -0.0784 & 0.3973 & 0.5031 & 0.3414 & -0.0682 & -0.1188 & -0.9994 \tabularnewline
(p-val) & (0.6562 ) & (4e-04 ) & (0 ) & (0.0678 ) & (0.5892 ) & (0.3628 ) & (0.0338 ) \tabularnewline
Estimates ( 2 ) & 0 & 0.3737 & 0.4832 & 0.2696 & -0.0722 & -0.1189 & -0.9994 \tabularnewline
(p-val) & (NA ) & (2e-04 ) & (0 ) & (0.0066 ) & (0.5668 ) & (0.3585 ) & (0.0304 ) \tabularnewline
Estimates ( 3 ) & 0 & 0.3691 & 0.4632 & 0.2653 & 0 & -0.1059 & -1 \tabularnewline
(p-val) & (NA ) & (2e-04 ) & (0 ) & (0.0072 ) & (NA ) & (0.4188 ) & (2e-04 ) \tabularnewline
Estimates ( 4 ) & 0 & 0.3547 & 0.4849 & 0.263 & 0 & 0 & -1 \tabularnewline
(p-val) & (NA ) & (2e-04 ) & (0 ) & (0.0073 ) & (NA ) & (NA ) & (0 ) \tabularnewline
Estimates ( 5 ) & NA & NA & NA & NA & NA & NA & NA \tabularnewline
(p-val) & (NA ) & (NA ) & (NA ) & (NA ) & (NA ) & (NA ) & (NA ) \tabularnewline
Estimates ( 6 ) & NA & NA & NA & NA & NA & NA & NA \tabularnewline
(p-val) & (NA ) & (NA ) & (NA ) & (NA ) & (NA ) & (NA ) & (NA ) \tabularnewline
Estimates ( 7 ) & NA & NA & NA & NA & NA & NA & NA \tabularnewline
(p-val) & (NA ) & (NA ) & (NA ) & (NA ) & (NA ) & (NA ) & (NA ) \tabularnewline
Estimates ( 8 ) & NA & NA & NA & NA & NA & NA & NA \tabularnewline
(p-val) & (NA ) & (NA ) & (NA ) & (NA ) & (NA ) & (NA ) & (NA ) \tabularnewline
Estimates ( 9 ) & NA & NA & NA & NA & NA & NA & NA \tabularnewline
(p-val) & (NA ) & (NA ) & (NA ) & (NA ) & (NA ) & (NA ) & (NA ) \tabularnewline
Estimates ( 10 ) & NA & NA & NA & NA & NA & NA & NA \tabularnewline
(p-val) & (NA ) & (NA ) & (NA ) & (NA ) & (NA ) & (NA ) & (NA ) \tabularnewline
Estimates ( 11 ) & NA & NA & NA & NA & NA & NA & NA \tabularnewline
(p-val) & (NA ) & (NA ) & (NA ) & (NA ) & (NA ) & (NA ) & (NA ) \tabularnewline
Estimates ( 12 ) & NA & NA & NA & NA & NA & NA & NA \tabularnewline
(p-val) & (NA ) & (NA ) & (NA ) & (NA ) & (NA ) & (NA ) & (NA ) \tabularnewline
Estimates ( 13 ) & NA & NA & NA & NA & NA & NA & NA \tabularnewline
(p-val) & (NA ) & (NA ) & (NA ) & (NA ) & (NA ) & (NA ) & (NA ) \tabularnewline
\hline
\end{tabular}
%Source: https://freestatistics.org/blog/index.php?pk=114336&T=1

[TABLE]
[ROW][C]ARIMA Parameter Estimation and Backward Selection[/C][/ROW]
[ROW][C]Iteration[/C][C]ar1[/C][C]ar2[/C][C]ar3[/C][C]ma1[/C][C]sar1[/C][C]sar2[/C][C]sma1[/C][/ROW]
[ROW][C]Estimates ( 1 )[/C][C]-0.0784[/C][C]0.3973[/C][C]0.5031[/C][C]0.3414[/C][C]-0.0682[/C][C]-0.1188[/C][C]-0.9994[/C][/ROW]
[ROW][C](p-val)[/C][C](0.6562 )[/C][C](4e-04 )[/C][C](0 )[/C][C](0.0678 )[/C][C](0.5892 )[/C][C](0.3628 )[/C][C](0.0338 )[/C][/ROW]
[ROW][C]Estimates ( 2 )[/C][C]0[/C][C]0.3737[/C][C]0.4832[/C][C]0.2696[/C][C]-0.0722[/C][C]-0.1189[/C][C]-0.9994[/C][/ROW]
[ROW][C](p-val)[/C][C](NA )[/C][C](2e-04 )[/C][C](0 )[/C][C](0.0066 )[/C][C](0.5668 )[/C][C](0.3585 )[/C][C](0.0304 )[/C][/ROW]
[ROW][C]Estimates ( 3 )[/C][C]0[/C][C]0.3691[/C][C]0.4632[/C][C]0.2653[/C][C]0[/C][C]-0.1059[/C][C]-1[/C][/ROW]
[ROW][C](p-val)[/C][C](NA )[/C][C](2e-04 )[/C][C](0 )[/C][C](0.0072 )[/C][C](NA )[/C][C](0.4188 )[/C][C](2e-04 )[/C][/ROW]
[ROW][C]Estimates ( 4 )[/C][C]0[/C][C]0.3547[/C][C]0.4849[/C][C]0.263[/C][C]0[/C][C]0[/C][C]-1[/C][/ROW]
[ROW][C](p-val)[/C][C](NA )[/C][C](2e-04 )[/C][C](0 )[/C][C](0.0073 )[/C][C](NA )[/C][C](NA )[/C][C](0 )[/C][/ROW]
[ROW][C]Estimates ( 5 )[/C][C]NA[/C][C]NA[/C][C]NA[/C][C]NA[/C][C]NA[/C][C]NA[/C][C]NA[/C][/ROW]
[ROW][C](p-val)[/C][C](NA )[/C][C](NA )[/C][C](NA )[/C][C](NA )[/C][C](NA )[/C][C](NA )[/C][C](NA )[/C][/ROW]
[ROW][C]Estimates ( 6 )[/C][C]NA[/C][C]NA[/C][C]NA[/C][C]NA[/C][C]NA[/C][C]NA[/C][C]NA[/C][/ROW]
[ROW][C](p-val)[/C][C](NA )[/C][C](NA )[/C][C](NA )[/C][C](NA )[/C][C](NA )[/C][C](NA )[/C][C](NA )[/C][/ROW]
[ROW][C]Estimates ( 7 )[/C][C]NA[/C][C]NA[/C][C]NA[/C][C]NA[/C][C]NA[/C][C]NA[/C][C]NA[/C][/ROW]
[ROW][C](p-val)[/C][C](NA )[/C][C](NA )[/C][C](NA )[/C][C](NA )[/C][C](NA )[/C][C](NA )[/C][C](NA )[/C][/ROW]
[ROW][C]Estimates ( 8 )[/C][C]NA[/C][C]NA[/C][C]NA[/C][C]NA[/C][C]NA[/C][C]NA[/C][C]NA[/C][/ROW]
[ROW][C](p-val)[/C][C](NA )[/C][C](NA )[/C][C](NA )[/C][C](NA )[/C][C](NA )[/C][C](NA )[/C][C](NA )[/C][/ROW]
[ROW][C]Estimates ( 9 )[/C][C]NA[/C][C]NA[/C][C]NA[/C][C]NA[/C][C]NA[/C][C]NA[/C][C]NA[/C][/ROW]
[ROW][C](p-val)[/C][C](NA )[/C][C](NA )[/C][C](NA )[/C][C](NA )[/C][C](NA )[/C][C](NA )[/C][C](NA )[/C][/ROW]
[ROW][C]Estimates ( 10 )[/C][C]NA[/C][C]NA[/C][C]NA[/C][C]NA[/C][C]NA[/C][C]NA[/C][C]NA[/C][/ROW]
[ROW][C](p-val)[/C][C](NA )[/C][C](NA )[/C][C](NA )[/C][C](NA )[/C][C](NA )[/C][C](NA )[/C][C](NA )[/C][/ROW]
[ROW][C]Estimates ( 11 )[/C][C]NA[/C][C]NA[/C][C]NA[/C][C]NA[/C][C]NA[/C][C]NA[/C][C]NA[/C][/ROW]
[ROW][C](p-val)[/C][C](NA )[/C][C](NA )[/C][C](NA )[/C][C](NA )[/C][C](NA )[/C][C](NA )[/C][C](NA )[/C][/ROW]
[ROW][C]Estimates ( 12 )[/C][C]NA[/C][C]NA[/C][C]NA[/C][C]NA[/C][C]NA[/C][C]NA[/C][C]NA[/C][/ROW]
[ROW][C](p-val)[/C][C](NA )[/C][C](NA )[/C][C](NA )[/C][C](NA )[/C][C](NA )[/C][C](NA )[/C][C](NA )[/C][/ROW]
[ROW][C]Estimates ( 13 )[/C][C]NA[/C][C]NA[/C][C]NA[/C][C]NA[/C][C]NA[/C][C]NA[/C][C]NA[/C][/ROW]
[ROW][C](p-val)[/C][C](NA )[/C][C](NA )[/C][C](NA )[/C][C](NA )[/C][C](NA )[/C][C](NA )[/C][C](NA )[/C][/ROW]
[/TABLE]
Source: https://freestatistics.org/blog/index.php?pk=114336&T=1

Globally Unique Identifier (entire table): ba.freestatistics.org/blog/index.php?pk=114336&T=1

As an alternative you can also use a QR Code:  

The GUIDs for individual cells are displayed in the table below:

ARIMA Parameter Estimation and Backward Selection
Iterationar1ar2ar3ma1sar1sar2sma1
Estimates ( 1 )-0.07840.39730.50310.3414-0.0682-0.1188-0.9994
(p-val)(0.6562 )(4e-04 )(0 )(0.0678 )(0.5892 )(0.3628 )(0.0338 )
Estimates ( 2 )00.37370.48320.2696-0.0722-0.1189-0.9994
(p-val)(NA )(2e-04 )(0 )(0.0066 )(0.5668 )(0.3585 )(0.0304 )
Estimates ( 3 )00.36910.46320.26530-0.1059-1
(p-val)(NA )(2e-04 )(0 )(0.0072 )(NA )(0.4188 )(2e-04 )
Estimates ( 4 )00.35470.48490.26300-1
(p-val)(NA )(2e-04 )(0 )(0.0073 )(NA )(NA )(0 )
Estimates ( 5 )NANANANANANANA
(p-val)(NA )(NA )(NA )(NA )(NA )(NA )(NA )
Estimates ( 6 )NANANANANANANA
(p-val)(NA )(NA )(NA )(NA )(NA )(NA )(NA )
Estimates ( 7 )NANANANANANANA
(p-val)(NA )(NA )(NA )(NA )(NA )(NA )(NA )
Estimates ( 8 )NANANANANANANA
(p-val)(NA )(NA )(NA )(NA )(NA )(NA )(NA )
Estimates ( 9 )NANANANANANANA
(p-val)(NA )(NA )(NA )(NA )(NA )(NA )(NA )
Estimates ( 10 )NANANANANANANA
(p-val)(NA )(NA )(NA )(NA )(NA )(NA )(NA )
Estimates ( 11 )NANANANANANANA
(p-val)(NA )(NA )(NA )(NA )(NA )(NA )(NA )
Estimates ( 12 )NANANANANANANA
(p-val)(NA )(NA )(NA )(NA )(NA )(NA )(NA )
Estimates ( 13 )NANANANANANANA
(p-val)(NA )(NA )(NA )(NA )(NA )(NA )(NA )


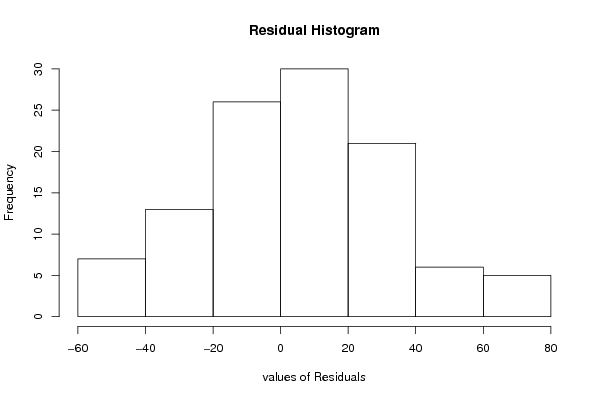
Estimated ARIMA Residuals
Value
0.329996618437135
13.4591741721598
-8.22747567511559
8.86281917266111
11.0051538212958
4.06308140524806
-20.4618382497524
21.9913018889456
-15.5049525566547
60.8879453660738
13.7180362185379
34.6617877112352
-37.4132968006846
-30.930438085845
21.1024476350528
-0.560509565306965
20.2064319545158
-31.9154400590657
13.8667434057353
55.1503277152084
1.84104959933567
10.5762021208681
-16.0969714338718
-54.0198981394335
31.1812509613936
16.9590927512598
30.7866148818009
38.3716212902904
22.8450235853088
-28.7072313251897
20.2789294501215
-53.6146985646604
-18.2515961439721
34.497120086962
18.729266846879
-23.7100510456113
-12.9860974470447
28.7807463053285
-28.1094651780221
32.0859224085297
-14.4381034223301
32.983006124657
35.9336815245603
-31.9056906483023
-13.6100511525314
-13.8506166553695
-54.6709738309537
-23.6026815046132
50.0427109184817
41.0220812715787
-1.86743745466771
-19.939647840611
-17.846814741735
7.81025303334189
-6.0418168720689
-7.92592091171402
7.22054828220234
-54.6334027153927
-13.1052031571499
46.702587884069
-7.78079755133022
19.9850963033271
-14.1647233205087
22.5207338667626
-14.1892250823138
34.1723106395821
-41.5923532463673
-7.08040852846561
35.641534115638
-0.513823681726475
35.6827726704018
-34.4526914851247
-43.3039889016036
9.5935934812718
10.3236057805759
-46.5188581481064
64.0297672834166
-9.72023096265226
39.0605795872975
3.64707833205677
18.1633301609541
-11.4085233092365
32.5790575209016
-8.36075404688627
56.6122111678247
42.7354379380481
23.125295188995
79.898782917071
-13.7918703532584
-11.0493575847524
-20.1196005286799
-31.4143350316244
-31.0791193301263
4.04980992265427
60.4058616758511
72.0000185073265
-0.758721121227825

\begin{tabular}{lllllllll}
\hline
Estimated ARIMA Residuals \tabularnewline
Value \tabularnewline
0.329996618437135 \tabularnewline
13.4591741721598 \tabularnewline
-8.22747567511559 \tabularnewline
8.86281917266111 \tabularnewline
11.0051538212958 \tabularnewline
4.06308140524806 \tabularnewline
-20.4618382497524 \tabularnewline
21.9913018889456 \tabularnewline
-15.5049525566547 \tabularnewline
60.8879453660738 \tabularnewline
13.7180362185379 \tabularnewline
34.6617877112352 \tabularnewline
-37.4132968006846 \tabularnewline
-30.930438085845 \tabularnewline
21.1024476350528 \tabularnewline
-0.560509565306965 \tabularnewline
20.2064319545158 \tabularnewline
-31.9154400590657 \tabularnewline
13.8667434057353 \tabularnewline
55.1503277152084 \tabularnewline
1.84104959933567 \tabularnewline
10.5762021208681 \tabularnewline
-16.0969714338718 \tabularnewline
-54.0198981394335 \tabularnewline
31.1812509613936 \tabularnewline
16.9590927512598 \tabularnewline
30.7866148818009 \tabularnewline
38.3716212902904 \tabularnewline
22.8450235853088 \tabularnewline
-28.7072313251897 \tabularnewline
20.2789294501215 \tabularnewline
-53.6146985646604 \tabularnewline
-18.2515961439721 \tabularnewline
34.497120086962 \tabularnewline
18.729266846879 \tabularnewline
-23.7100510456113 \tabularnewline
-12.9860974470447 \tabularnewline
28.7807463053285 \tabularnewline
-28.1094651780221 \tabularnewline
32.0859224085297 \tabularnewline
-14.4381034223301 \tabularnewline
32.983006124657 \tabularnewline
35.9336815245603 \tabularnewline
-31.9056906483023 \tabularnewline
-13.6100511525314 \tabularnewline
-13.8506166553695 \tabularnewline
-54.6709738309537 \tabularnewline
-23.6026815046132 \tabularnewline
50.0427109184817 \tabularnewline
41.0220812715787 \tabularnewline
-1.86743745466771 \tabularnewline
-19.939647840611 \tabularnewline
-17.846814741735 \tabularnewline
7.81025303334189 \tabularnewline
-6.0418168720689 \tabularnewline
-7.92592091171402 \tabularnewline
7.22054828220234 \tabularnewline
-54.6334027153927 \tabularnewline
-13.1052031571499 \tabularnewline
46.702587884069 \tabularnewline
-7.78079755133022 \tabularnewline
19.9850963033271 \tabularnewline
-14.1647233205087 \tabularnewline
22.5207338667626 \tabularnewline
-14.1892250823138 \tabularnewline
34.1723106395821 \tabularnewline
-41.5923532463673 \tabularnewline
-7.08040852846561 \tabularnewline
35.641534115638 \tabularnewline
-0.513823681726475 \tabularnewline
35.6827726704018 \tabularnewline
-34.4526914851247 \tabularnewline
-43.3039889016036 \tabularnewline
9.5935934812718 \tabularnewline
10.3236057805759 \tabularnewline
-46.5188581481064 \tabularnewline
64.0297672834166 \tabularnewline
-9.72023096265226 \tabularnewline
39.0605795872975 \tabularnewline
3.64707833205677 \tabularnewline
18.1633301609541 \tabularnewline
-11.4085233092365 \tabularnewline
32.5790575209016 \tabularnewline
-8.36075404688627 \tabularnewline
56.6122111678247 \tabularnewline
42.7354379380481 \tabularnewline
23.125295188995 \tabularnewline
79.898782917071 \tabularnewline
-13.7918703532584 \tabularnewline
-11.0493575847524 \tabularnewline
-20.1196005286799 \tabularnewline
-31.4143350316244 \tabularnewline
-31.0791193301263 \tabularnewline
4.04980992265427 \tabularnewline
60.4058616758511 \tabularnewline
72.0000185073265 \tabularnewline
-0.758721121227825 \tabularnewline
\hline
\end{tabular}
%Source: https://freestatistics.org/blog/index.php?pk=114336&T=2

[TABLE]
[ROW][C]Estimated ARIMA Residuals[/C][/ROW]
[ROW][C]Value[/C][/ROW]
[ROW][C]0.329996618437135[/C][/ROW]
[ROW][C]13.4591741721598[/C][/ROW]
[ROW][C]-8.22747567511559[/C][/ROW]
[ROW][C]8.86281917266111[/C][/ROW]
[ROW][C]11.0051538212958[/C][/ROW]
[ROW][C]4.06308140524806[/C][/ROW]
[ROW][C]-20.4618382497524[/C][/ROW]
[ROW][C]21.9913018889456[/C][/ROW]
[ROW][C]-15.5049525566547[/C][/ROW]
[ROW][C]60.8879453660738[/C][/ROW]
[ROW][C]13.7180362185379[/C][/ROW]
[ROW][C]34.6617877112352[/C][/ROW]
[ROW][C]-37.4132968006846[/C][/ROW]
[ROW][C]-30.930438085845[/C][/ROW]
[ROW][C]21.1024476350528[/C][/ROW]
[ROW][C]-0.560509565306965[/C][/ROW]
[ROW][C]20.2064319545158[/C][/ROW]
[ROW][C]-31.9154400590657[/C][/ROW]
[ROW][C]13.8667434057353[/C][/ROW]
[ROW][C]55.1503277152084[/C][/ROW]
[ROW][C]1.84104959933567[/C][/ROW]
[ROW][C]10.5762021208681[/C][/ROW]
[ROW][C]-16.0969714338718[/C][/ROW]
[ROW][C]-54.0198981394335[/C][/ROW]
[ROW][C]31.1812509613936[/C][/ROW]
[ROW][C]16.9590927512598[/C][/ROW]
[ROW][C]30.7866148818009[/C][/ROW]
[ROW][C]38.3716212902904[/C][/ROW]
[ROW][C]22.8450235853088[/C][/ROW]
[ROW][C]-28.7072313251897[/C][/ROW]
[ROW][C]20.2789294501215[/C][/ROW]
[ROW][C]-53.6146985646604[/C][/ROW]
[ROW][C]-18.2515961439721[/C][/ROW]
[ROW][C]34.497120086962[/C][/ROW]
[ROW][C]18.729266846879[/C][/ROW]
[ROW][C]-23.7100510456113[/C][/ROW]
[ROW][C]-12.9860974470447[/C][/ROW]
[ROW][C]28.7807463053285[/C][/ROW]
[ROW][C]-28.1094651780221[/C][/ROW]
[ROW][C]32.0859224085297[/C][/ROW]
[ROW][C]-14.4381034223301[/C][/ROW]
[ROW][C]32.983006124657[/C][/ROW]
[ROW][C]35.9336815245603[/C][/ROW]
[ROW][C]-31.9056906483023[/C][/ROW]
[ROW][C]-13.6100511525314[/C][/ROW]
[ROW][C]-13.8506166553695[/C][/ROW]
[ROW][C]-54.6709738309537[/C][/ROW]
[ROW][C]-23.6026815046132[/C][/ROW]
[ROW][C]50.0427109184817[/C][/ROW]
[ROW][C]41.0220812715787[/C][/ROW]
[ROW][C]-1.86743745466771[/C][/ROW]
[ROW][C]-19.939647840611[/C][/ROW]
[ROW][C]-17.846814741735[/C][/ROW]
[ROW][C]7.81025303334189[/C][/ROW]
[ROW][C]-6.0418168720689[/C][/ROW]
[ROW][C]-7.92592091171402[/C][/ROW]
[ROW][C]7.22054828220234[/C][/ROW]
[ROW][C]-54.6334027153927[/C][/ROW]
[ROW][C]-13.1052031571499[/C][/ROW]
[ROW][C]46.702587884069[/C][/ROW]
[ROW][C]-7.78079755133022[/C][/ROW]
[ROW][C]19.9850963033271[/C][/ROW]
[ROW][C]-14.1647233205087[/C][/ROW]
[ROW][C]22.5207338667626[/C][/ROW]
[ROW][C]-14.1892250823138[/C][/ROW]
[ROW][C]34.1723106395821[/C][/ROW]
[ROW][C]-41.5923532463673[/C][/ROW]
[ROW][C]-7.08040852846561[/C][/ROW]
[ROW][C]35.641534115638[/C][/ROW]
[ROW][C]-0.513823681726475[/C][/ROW]
[ROW][C]35.6827726704018[/C][/ROW]
[ROW][C]-34.4526914851247[/C][/ROW]
[ROW][C]-43.3039889016036[/C][/ROW]
[ROW][C]9.5935934812718[/C][/ROW]
[ROW][C]10.3236057805759[/C][/ROW]
[ROW][C]-46.5188581481064[/C][/ROW]
[ROW][C]64.0297672834166[/C][/ROW]
[ROW][C]-9.72023096265226[/C][/ROW]
[ROW][C]39.0605795872975[/C][/ROW]
[ROW][C]3.64707833205677[/C][/ROW]
[ROW][C]18.1633301609541[/C][/ROW]
[ROW][C]-11.4085233092365[/C][/ROW]
[ROW][C]32.5790575209016[/C][/ROW]
[ROW][C]-8.36075404688627[/C][/ROW]
[ROW][C]56.6122111678247[/C][/ROW]
[ROW][C]42.7354379380481[/C][/ROW]
[ROW][C]23.125295188995[/C][/ROW]
[ROW][C]79.898782917071[/C][/ROW]
[ROW][C]-13.7918703532584[/C][/ROW]
[ROW][C]-11.0493575847524[/C][/ROW]
[ROW][C]-20.1196005286799[/C][/ROW]
[ROW][C]-31.4143350316244[/C][/ROW]
[ROW][C]-31.0791193301263[/C][/ROW]
[ROW][C]4.04980992265427[/C][/ROW]
[ROW][C]60.4058616758511[/C][/ROW]
[ROW][C]72.0000185073265[/C][/ROW]
[ROW][C]-0.758721121227825[/C][/ROW]
[/TABLE]
Source: https://freestatistics.org/blog/index.php?pk=114336&T=2

Globally Unique Identifier (entire table): ba.freestatistics.org/blog/index.php?pk=114336&T=2

As an alternative you can also use a QR Code:  

The GUIDs for individual cells are displayed in the table below:

Estimated ARIMA Residuals
Value
0.329996618437135
13.4591741721598
-8.22747567511559
8.86281917266111
11.0051538212958
4.06308140524806
-20.4618382497524
21.9913018889456
-15.5049525566547
60.8879453660738
13.7180362185379
34.6617877112352
-37.4132968006846
-30.930438085845
21.1024476350528
-0.560509565306965
20.2064319545158
-31.9154400590657
13.8667434057353
55.1503277152084
1.84104959933567
10.5762021208681
-16.0969714338718
-54.0198981394335
31.1812509613936
16.9590927512598
30.7866148818009
38.3716212902904
22.8450235853088
-28.7072313251897
20.2789294501215
-53.6146985646604
-18.2515961439721
34.497120086962
18.729266846879
-23.7100510456113
-12.9860974470447
28.7807463053285
-28.1094651780221
32.0859224085297
-14.4381034223301
32.983006124657
35.9336815245603
-31.9056906483023
-13.6100511525314
-13.8506166553695
-54.6709738309537
-23.6026815046132
50.0427109184817
41.0220812715787
-1.86743745466771
-19.939647840611
-17.846814741735
7.81025303334189
-6.0418168720689
-7.92592091171402
7.22054828220234
-54.6334027153927
-13.1052031571499
46.702587884069
-7.78079755133022
19.9850963033271
-14.1647233205087
22.5207338667626
-14.1892250823138
34.1723106395821
-41.5923532463673
-7.08040852846561
35.641534115638
-0.513823681726475
35.6827726704018
-34.4526914851247
-43.3039889016036
9.5935934812718
10.3236057805759
-46.5188581481064
64.0297672834166
-9.72023096265226
39.0605795872975
3.64707833205677
18.1633301609541
-11.4085233092365
32.5790575209016
-8.36075404688627
56.6122111678247
42.7354379380481
23.125295188995
79.898782917071
-13.7918703532584
-11.0493575847524
-20.1196005286799
-31.4143350316244
-31.0791193301263
4.04980992265427
60.4058616758511
72.0000185073265
-0.758721121227825


Parameters (Session):
par1 = FALSE ; par2 = 1 ; par3 = 0 ; par4 = 1 ; par5 = 12 ; par6 = 3 ; par7 = 1 ; par8 = 2 ; par9 = 1 ;
Parameters (R input):
par1 = FALSE ; par2 = 1 ; par3 = 0 ; par4 = 1 ; par5 = 12 ; par6 = 3 ; par7 = 1 ; par8 = 2 ; par9 = 1 ;
R code (references can be found in the software module):
library(lattice)
if (par1 == 'TRUE') par1 <- TRUE
if (par1 == 'FALSE') par1 <- FALSE
par2 <- as.numeric(par2) #Box-Cox lambda transformation parameter
par3 <- as.numeric(par3) #degree of non-seasonal differencing
par4 <- as.numeric(par4) #degree of seasonal differencing
par5 <- as.numeric(par5) #seasonal period
par6 <- as.numeric(par6) #degree (p) of the non-seasonal AR(p) polynomial
par7 <- as.numeric(par7) #degree (q) of the non-seasonal MA(q) polynomial
par8 <- as.numeric(par8) #degree (P) of the seasonal AR(P) polynomial
par9 <- as.numeric(par9) #degree (Q) of the seasonal MA(Q) polynomial
armaGR <- function(arima.out, names, n){
try1 <- arima.out$coef
try2 <- sqrt(diag(arima.out$var.coef))
try.data.frame <- data.frame(matrix(NA,ncol=4,nrow=length(names)))
dimnames(try.data.frame) <- list(names,c('coef','std','tstat','pv'))
try.data.frame[,1] <- try1
for(i in 1:length(try2)) try.data.frame[which(rownames(try.data.frame)==names(try2)[i]),2] <- try2[i]
try.data.frame[,3] <- try.data.frame[,1] / try.data.frame[,2]
try.data.frame[,4] <- round((1-pt(abs(try.data.frame[,3]),df=n-(length(try2)+1)))*2,5)
vector <- rep(NA,length(names))
vector[is.na(try.data.frame[,4])] <- 0
maxi <- which.max(try.data.frame[,4])
continue <- max(try.data.frame[,4],na.rm=TRUE) > .05
vector[maxi] <- 0
list(summary=try.data.frame,next.vector=vector,continue=continue)
}
arimaSelect <- function(series, order=c(13,0,0), seasonal=list(order=c(2,0,0),period=12), include.mean=F){
nrc <- order[1]+order[3]+seasonal$order[1]+seasonal$order[3]
coeff <- matrix(NA, nrow=nrc*2, ncol=nrc)
pval <- matrix(NA, nrow=nrc*2, ncol=nrc)
mylist <- rep(list(NULL), nrc)
names <- NULL
if(order[1] > 0) names <- paste('ar',1:order[1],sep='')
if(order[3] > 0) names <- c( names , paste('ma',1:order[3],sep='') )
if(seasonal$order[1] > 0) names <- c(names, paste('sar',1:seasonal$order[1],sep=''))
if(seasonal$order[3] > 0) names <- c(names, paste('sma',1:seasonal$order[3],sep=''))
arima.out <- arima(series, order=order, seasonal=seasonal, include.mean=include.mean, method='ML')
mylist[[1]] <- arima.out
last.arma <- armaGR(arima.out, names, length(series))
mystop <- FALSE
i <- 1
coeff[i,] <- last.arma[[1]][,1]
pval [i,] <- last.arma[[1]][,4]
i <- 2
aic <- arima.out$aic
while(!mystop){
mylist[[i]] <- arima.out
arima.out <- arima(series, order=order, seasonal=seasonal, include.mean=include.mean, method='ML', fixed=last.arma$next.vector)
aic <- c(aic, arima.out$aic)
last.arma <- armaGR(arima.out, names, length(series))
mystop <- !last.arma$continue
coeff[i,] <- last.arma[[1]][,1]
pval [i,] <- last.arma[[1]][,4]
i <- i+1
}
list(coeff, pval, mylist, aic=aic)
}
arimaSelectplot <- function(arimaSelect.out,noms,choix){
noms <- names(arimaSelect.out[[3]][[1]]$coef)
coeff <- arimaSelect.out[[1]]
k <- min(which(is.na(coeff[,1])))-1
coeff <- coeff[1:k,]
pval <- arimaSelect.out[[2]][1:k,]
aic <- arimaSelect.out$aic[1:k]
coeff[coeff==0] <- NA
n <- ncol(coeff)
if(missing(choix)) choix <- k
layout(matrix(c(1,1,1,2,
3,3,3,2,
3,3,3,4,
5,6,7,7),nr=4),
widths=c(10,35,45,15),
heights=c(30,30,15,15))
couleurs <- rainbow(75)[1:50]#(50)
ticks <- pretty(coeff)
par(mar=c(1,1,3,1))
plot(aic,k:1-.5,type='o',pch=21,bg='blue',cex=2,axes=F,lty=2,xpd=NA)
points(aic[choix],k-choix+.5,pch=21,cex=4,bg=2,xpd=NA)
title('aic',line=2)
par(mar=c(3,0,0,0))
plot(0,axes=F,xlab='',ylab='',xlim=range(ticks),ylim=c(.1,1))
rect(xleft = min(ticks) + (0:49)/50*(max(ticks)-min(ticks)),
xright = min(ticks) + (1:50)/50*(max(ticks)-min(ticks)),
ytop = rep(1,50),
ybottom= rep(0,50),col=couleurs,border=NA)
axis(1,ticks)
rect(xleft=min(ticks),xright=max(ticks),ytop=1,ybottom=0)
text(mean(coeff,na.rm=T),.5,'coefficients',cex=2,font=2)
par(mar=c(1,1,3,1))
image(1:n,1:k,t(coeff[k:1,]),axes=F,col=couleurs,zlim=range(ticks))
for(i in 1:n) for(j in 1:k) if(!is.na(coeff[j,i])) {
if(pval[j,i]<.01) symb = 'green'
else if( (pval[j,i]<.05) & (pval[j,i]>=.01)) symb = 'orange'
else if( (pval[j,i]<.1) & (pval[j,i]>=.05)) symb = 'red'
else symb = 'black'
polygon(c(i+.5 ,i+.2 ,i+.5 ,i+.5),
c(k-j+0.5,k-j+0.5,k-j+0.8,k-j+0.5),
col=symb)
if(j==choix) {
rect(xleft=i-.5,
xright=i+.5,
ybottom=k-j+1.5,
ytop=k-j+.5,
lwd=4)
text(i,
k-j+1,
round(coeff[j,i],2),
cex=1.2,
font=2)
}
else{
rect(xleft=i-.5,xright=i+.5,ybottom=k-j+1.5,ytop=k-j+.5)
text(i,k-j+1,round(coeff[j,i],2),cex=1.2,font=1)
}
}
axis(3,1:n,noms)
par(mar=c(0.5,0,0,0.5))
plot(0,axes=F,xlab='',ylab='',type='n',xlim=c(0,8),ylim=c(-.2,.8))
cols <- c('green','orange','red','black')
niv <- c('0','0.01','0.05','0.1')
for(i in 0:3){
polygon(c(1+2*i ,1+2*i ,1+2*i-.5 ,1+2*i),
c(.4 ,.7 , .4 , .4),
col=cols[i+1])
text(2*i,0.5,niv[i+1],cex=1.5)
}
text(8,.5,1,cex=1.5)
text(4,0,'p-value',cex=2)
box()
residus <- arimaSelect.out[[3]][[choix]]$res
par(mar=c(1,2,4,1))
acf(residus,main='')
title('acf',line=.5)
par(mar=c(1,2,4,1))
pacf(residus,main='')
title('pacf',line=.5)
par(mar=c(2,2,4,1))
qqnorm(residus,main='')
title('qq-norm',line=.5)
qqline(residus)
residus
}
if (par2 == 0) x <- log(x)
if (par2 != 0) x <- x^par2
(selection <- arimaSelect(x, order=c(par6,par3,par7), seasonal=list(order=c(par8,par4,par9), period=par5)))
bitmap(file='test1.png')
resid <- arimaSelectplot(selection)
dev.off()
resid
bitmap(file='test2.png')
acf(resid,length(resid)/2, main='Residual Autocorrelation Function')
dev.off()
bitmap(file='test3.png')
pacf(resid,length(resid)/2, main='Residual Partial Autocorrelation Function')
dev.off()
bitmap(file='test4.png')
cpgram(resid, main='Residual Cumulative Periodogram')
dev.off()
bitmap(file='test5.png')
hist(resid, main='Residual Histogram', xlab='values of Residuals')
dev.off()
bitmap(file='test6.png')
densityplot(~resid,col='black',main='Residual Density Plot', xlab='values of Residuals')
dev.off()
bitmap(file='test7.png')
qqnorm(resid, main='Residual Normal Q-Q Plot')
qqline(resid)
dev.off()
ncols <- length(selection[[1]][1,])
nrows <- length(selection[[2]][,1])-1
load(file='createtable')
a<-table.start()
a<-table.row.start(a)
a<-table.element(a,'ARIMA Parameter Estimation and Backward Selection', ncols+1,TRUE)
a<-table.row.end(a)
a<-table.row.start(a)
a<-table.element(a,'Iteration', header=TRUE)
for (i in 1:ncols) {
a<-table.element(a,names(selection[[3]][[1]]$coef)[i],header=TRUE)
}
a<-table.row.end(a)
for (j in 1:nrows) {
a<-table.row.start(a)
mydum <- 'Estimates ('
mydum <- paste(mydum,j)
mydum <- paste(mydum,')')
a<-table.element(a,mydum, header=TRUE)
for (i in 1:ncols) {
a<-table.element(a,round(selection[[1]][j,i],4))
}
a<-table.row.end(a)
a<-table.row.start(a)
a<-table.element(a,'(p-val)', header=TRUE)
for (i in 1:ncols) {
mydum <- '('
mydum <- paste(mydum,round(selection[[2]][j,i],4),sep='')
mydum <- paste(mydum,')')
a<-table.element(a,mydum)
}
a<-table.row.end(a)
}
a<-table.end(a)
table.save(a,file='mytable.tab')
a<-table.start()
a<-table.row.start(a)
a<-table.element(a,'Estimated ARIMA Residuals', 1,TRUE)
a<-table.row.end(a)
a<-table.row.start(a)
a<-table.element(a,'Value', 1,TRUE)
a<-table.row.end(a)
for (i in (par4*par5+par3):length(resid)) {
a<-table.row.start(a)
a<-table.element(a,resid[i])
a<-table.row.end(a)
}
a<-table.end(a)
table.save(a,file='mytable1.tab')