| Multiple Linear Regression - Estimated Regression Equation |
| WERKLOOSHEIDSGRAAD [t] = + 13.8797415087597 -0.00335126330891042LOONKOSTEN[t] -0.850748734443006Q1[t] -1.06042806664729Q2[t] -0.562274746243909Q3[t] + e[t] |
| Multiple Linear Regression - Ordinary Least Squares | |||||
| Variable | Parameter | S.D. | T-STAT H0: parameter = 0 | 2-tail p-value | 1-tail p-value |
| (Intercept) | 13.8797415087597 | 1.170768 | 11.8552 | 0 | 0 |
| LOONKOSTEN | -0.00335126330891042 | 0.000685 | -4.8959 | 1e-05 | 5e-06 |
| Q1 | -0.850748734443006 | 0.385495 | -2.2069 | 0.031848 | 0.015924 |
| Q2 | -1.06042806664729 | 0.355821 | -2.9802 | 0.004404 | 0.002202 |
| Q3 | -0.562274746243909 | 0.360885 | -1.558 | 0.125408 | 0.062704 |
| Multiple Linear Regression - Regression Statistics | |
| Multiple R | 0.593533849375111 |
| R-squared | 0.352282430354037 |
| Adjusted R-squared | 0.301481052342589 |
| F-TEST (value) | 6.93450540405913 |
| F-TEST (DF numerator) | 4 |
| F-TEST (DF denominator) | 51 |
| p-value | 0.000154740728753544 |
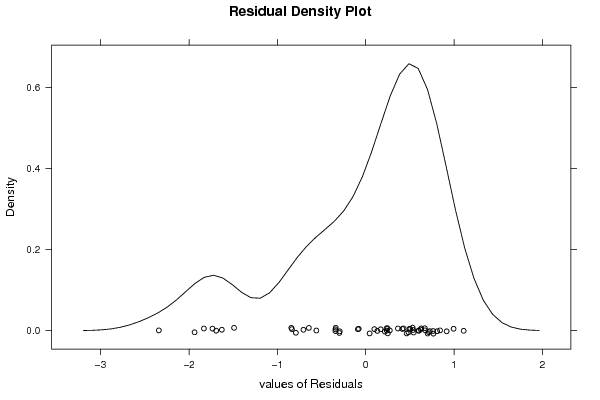
| Multiple Linear Regression - Residual Statistics | |
| Residual Standard Deviation | 0.878800208164375 |
| Sum Squared Residuals | 39.3867800993572 |
| Multiple Linear Regression - Actuals, Interpolation, and Residuals | |||
| Time or Index | Actuals | Interpolation Forecast | Residuals Prediction Error |
| 1 | 9.7 | 9.19534862472172 | 0.504651375278283 |
| 2 | 9.2 | 8.70446478826677 | 0.495535211733225 |
| 3 | 9.9 | 9.09065240151946 | 0.809347598480544 |
| 4 | 10 | 9.15797906967039 | 0.842020930329614 |
| 5 | 9.9 | 9.13288107664364 | 0.767118923356361 |
| 6 | 9.2 | 8.59876594350374 | 0.601234056496261 |
| 7 | 9.6 | 9.11548526263848 | 0.484514737361516 |
| 8 | 9.4 | 8.935555723858 | 0.464444276141998 |
| 9 | 9.1 | 8.96809945974451 | 0.131900540255485 |
| 10 | 8.7 | 8.44983580205576 | 0.250164197944239 |
| 11 | 9.5 | 8.96293575681688 | 0.537064243183119 |
| 12 | 9.5 | 9.08498855480232 | 0.415011445197682 |
| 13 | 9.4 | 8.85683751788869 | 0.543162482111312 |
| 14 | 9 | 8.40040466824933 | 0.599595331750668 |
| 15 | 9.6 | 8.89802178652329 | 0.701978213476714 |
| 16 | 9.3 | 8.76889739950589 | 0.531102600494113 |
| 17 | 9 | 8.75318294374409 | 0.246817056255911 |
| 18 | 8.5 | 8.26129372829646 | 0.23870627170354 |
| 19 | 8.5 | 8.79389803551544 | -0.29389803551544 |
| 20 | 7.9 | 8.60471901000237 | -0.704719010002366 |
| 21 | 7.2 | 8.69051431986746 | -1.49051431986746 |
| 22 | 6.5 | 8.1925593178307 | -1.69255931783071 |
| 23 | 7.1 | 8.72885001468949 | -1.62885001468949 |
| 24 | 6.8 | 8.63173019227218 | -1.83173019227218 |
| 25 | 6.2 | 8.54178525421802 | -2.34178525421802 |
| 26 | 6.2 | 7.93461258094387 | -1.73461258094387 |
| 27 | 6.5 | 8.43732361944737 | -1.93732361944737 |
| 28 | 7.5 | 8.33527743996597 | -0.835277439965968 |
| 29 | 7.4 | 8.24181367543745 | -0.841813675437449 |
| 30 | 6.9 | 7.69057358678902 | -0.790573586789016 |
| 31 | 7.6 | 8.24321844859528 | -0.64321844859528 |
| 32 | 8.1 | 8.1884585944026 | -0.0884585944026037 |
| 33 | 8.2 | 8.155518645233 | 0.0444813547669934 |
| 34 | 7.7 | 7.53081886485326 | 0.169181135146743 |
| 35 | 8.3 | 8.20166278356479 | 0.0983372164352098 |
| 36 | 8.5 | 8.1349724319924 | 0.365027568007607 |
| 37 | 8.7 | 8.02602583097671 | 0.673974169023291 |
| 38 | 7.4 | 7.47934346042839 | -0.0793434604283924 |
| 39 | 9.1 | 8.10457668550566 | 0.995423314494344 |
| 40 | 8.4 | 7.77859909172286 | 0.62140090827714 |
| 41 | 8.6 | 7.88624463836205 | 0.713755361637945 |
| 42 | 8.1 | 7.33654613083572 | 0.76345386916428 |
| 43 | 8.7 | 7.97360931539344 | 0.726390684606562 |
| 44 | 8.5 | 7.83027557194626 | 0.669724428053742 |
| 45 | 8.7 | 7.78302572844761 | 0.916974271552386 |
| 46 | 8.3 | 7.19063212636576 | 1.10936787363424 |
| 47 | 8.1 | 7.82722613406023 | 0.272773865939769 |
| 48 | 7.9 | 7.6643545255221 | 0.235645474477897 |
| 49 | 8 | 7.57072319782814 | 0.429276802171862 |
| 50 | 7.6 | 6.97145950596302 | 0.62854049403698 |
| 51 | 7.3 | 7.63925377506345 | -0.339253775063446 |
| 52 | 7.1 | 7.44236684393988 | -0.342366843939878 |
| 53 | 7.1 | 7.3979990868869 | -0.297999086886896 |
| 54 | 6.3 | 6.85868949561818 | -0.558689495618185 |
| 55 | 7.7 | 7.48328598066675 | 0.216714019333246 |
| 56 | 6.8 | 7.14182555039679 | -0.341825550396792 |
| Goldfeld-Quandt test for Heteroskedasticity | |||
| p-values | Alternative Hypothesis | ||
| breakpoint index | greater | 2-sided | less |
| 8 | 0.020256608324744 | 0.0405132166494879 | 0.979743391675256 |
| 9 | 0.00700773572207111 | 0.0140154714441422 | 0.99299226427793 |
| 10 | 0.00148026596675053 | 0.00296053193350105 | 0.99851973403325 |
| 11 | 0.000331954847594723 | 0.000663909695189445 | 0.999668045152405 |
| 12 | 0.0001546977112812 | 0.0003093954225624 | 0.999845302288719 |
| 13 | 0.000102830063072918 | 0.000205660126145835 | 0.999897169936927 |
| 14 | 5.59900372578025e-05 | 0.000111980074515605 | 0.999944009962742 |
| 15 | 2.4186093912833e-05 | 4.8372187825666e-05 | 0.999975813906087 |
| 16 | 9.02997775057043e-06 | 1.80599555011409e-05 | 0.99999097002225 |
| 17 | 3.32291302726378e-06 | 6.64582605452756e-06 | 0.999996677086973 |
| 18 | 1.44890936691118e-06 | 2.89781873382237e-06 | 0.999998551090633 |
| 19 | 3.89137630508911e-05 | 7.78275261017822e-05 | 0.99996108623695 |
| 20 | 0.000235137777001643 | 0.000470275554003286 | 0.999764862222998 |
| 21 | 0.0086021712752016 | 0.0172043425504032 | 0.991397828724798 |
| 22 | 0.0438525100296243 | 0.0877050200592485 | 0.956147489970376 |
| 23 | 0.0982490725632267 | 0.196498145126453 | 0.901750927436773 |
| 24 | 0.153350151726934 | 0.306700303453867 | 0.846649848273066 |
| 25 | 0.305682571698309 | 0.611365143396619 | 0.69431742830169 |
| 26 | 0.351346690561693 | 0.702693381123387 | 0.648653309438307 |
| 27 | 0.554479315648733 | 0.891041368702534 | 0.445520684351267 |
| 28 | 0.6566280250322 | 0.686743949935601 | 0.343371974967801 |
| 29 | 0.84608883677715 | 0.307822326445702 | 0.153911163222851 |
| 30 | 0.941725615386448 | 0.116548769227105 | 0.0582743846135524 |
| 31 | 0.978654083680025 | 0.042691832639949 | 0.0213459163199745 |
| 32 | 0.987015809843431 | 0.0259683803131371 | 0.0129841901565686 |
| 33 | 0.994649660616503 | 0.0107006787669933 | 0.00535033938349665 |
| 34 | 0.996616748581965 | 0.00676650283607017 | 0.00338325141803508 |
| 35 | 0.997622570825241 | 0.00475485834951784 | 0.00237742917475892 |
| 36 | 0.997660705467477 | 0.00467858906504627 | 0.00233929453252313 |
| 37 | 0.997421401392436 | 0.00515719721512844 | 0.00257859860756422 |
| 38 | 0.999759326371944 | 0.000481347256111183 | 0.000240673628055592 |
| 39 | 0.999583728869726 | 0.000832542260546972 | 0.000416271130273486 |
| 40 | 0.99908980100909 | 0.00182039798181966 | 0.000910198990909828 |
| 41 | 0.998130181175688 | 0.0037396376486249 | 0.00186981882431245 |
| 42 | 0.996366893688652 | 0.00726621262269685 | 0.00363310631134843 |
| 43 | 0.991385531864946 | 0.0172289362701071 | 0.00861446813505355 |
| 44 | 0.979877904124215 | 0.0402441917515708 | 0.0201220958757854 |
| 45 | 0.96072612010716 | 0.0785477597856813 | 0.0392738798928407 |
| 46 | 0.949629203649625 | 0.10074159270075 | 0.050370796350375 |
| 47 | 0.884426114601325 | 0.231147770797351 | 0.115573885398675 |
| 48 | 0.761478062988039 | 0.477043874023923 | 0.238521937011961 |
| Meta Analysis of Goldfeld-Quandt test for Heteroskedasticity | |||
| Description | # significant tests | % significant tests | OK/NOK |
| 1% type I error level | 20 | 0.48780487804878 | NOK |
| 5% type I error level | 28 | 0.682926829268293 | NOK |
| 10% type I error level | 30 | 0.73170731707317 | NOK |