| Multiple Linear Regression - Estimated Regression Equation |
| Y[t] = + 118.427761851709 -0.0801344199419449X[t] -1.64513563400788Y1[t] + 1.62948208638638Y2[t] + 0.420973600787796t + e[t] |
| Multiple Linear Regression - Ordinary Least Squares | |||||
| Variable | Parameter | S.D. | T-STAT H0: parameter = 0 | 2-tail p-value | 1-tail p-value |
| (Intercept) | 118.427761851709 | 31.98194 | 3.703 | 0.000541 | 0.00027 |
| X | -0.0801344199419449 | 0.017396 | -4.6064 | 2.9e-05 | 1.5e-05 |
| Y1 | -1.64513563400788 | 1.181023 | -1.393 | 0.169915 | 0.084958 |
| Y2 | 1.62948208638638 | 1.225912 | 1.3292 | 0.189938 | 0.094969 |
| t | 0.420973600787796 | 0.032121 | 13.1058 | 0 | 0 |
| Multiple Linear Regression - Regression Statistics | |
| Multiple R | 0.98962756756525 |
| R-squared | 0.979362722485113 |
| Adjusted R-squared | 0.977678046769612 |
| F-TEST (value) | 581.336047925333 |
| F-TEST (DF numerator) | 4 |
| F-TEST (DF denominator) | 49 |
| p-value | 0 |
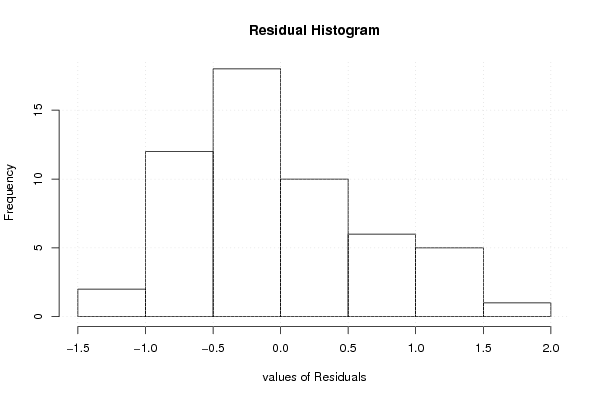
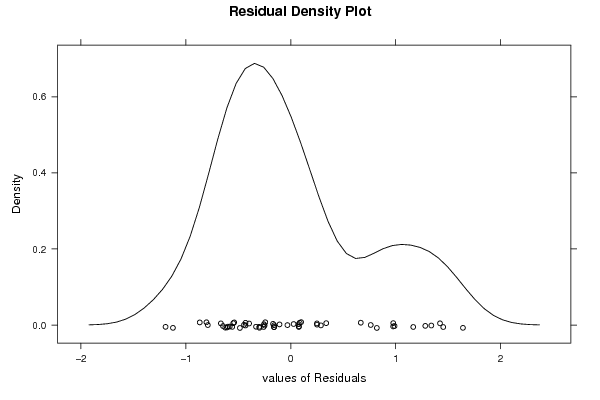
| Multiple Linear Regression - Residual Statistics | |
| Residual Standard Deviation | 0.730093650301397 |
| Sum Squared Residuals | 26.1188001723105 |
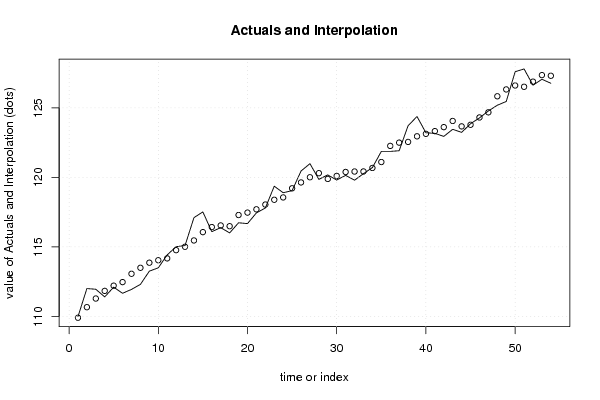
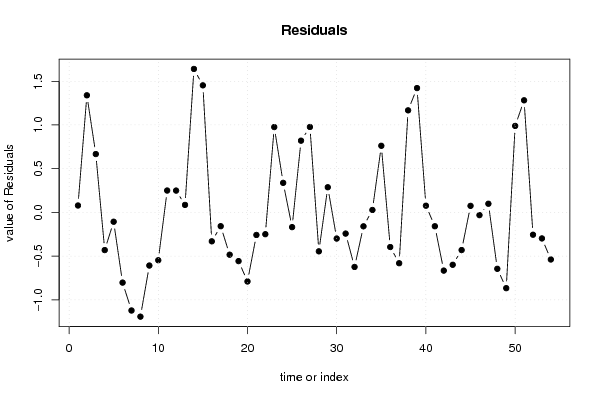
| Multiple Linear Regression - Actuals, Interpolation, and Residuals | |||
| Time or Index | Actuals | Interpolation Forecast | Residuals Prediction Error |
| 1 | 109.99 | 109.911438521240 | 0.0785614787604981 |
| 2 | 112.01 | 110.670650574359 | 1.33934942564122 |
| 3 | 111.96 | 111.292764035628 | 0.667235964372123 |
| 4 | 111.41 | 111.841528235971 | -0.431528235971084 |
| 5 | 112.11 | 112.217184423091 | -0.107184423091427 |
| 6 | 111.67 | 112.473731861046 | -0.80373186104607 |
| 7 | 111.95 | 113.072852743003 | -1.12285274300288 |
| 8 | 112.31 | 113.503290871561 | -1.19329087156149 |
| 9 | 113.26 | 113.868438315265 | -0.608438315265402 |
| 10 | 113.5 | 114.047735239172 | -0.547735239172297 |
| 11 | 114.43 | 114.180128261404 | 0.249871738595770 |
| 12 | 115.02 | 114.770766094938 | 0.249233905061831 |
| 13 | 115.1 | 115.014727561795 | 0.085272438205065 |
| 14 | 117.11 | 115.46904948086 | 1.64095051914007 |
| 15 | 117.52 | 116.066854679271 | 1.45314532072905 |
| 16 | 116.1 | 116.431309713748 | -0.331309713747685 |
| 17 | 116.39 | 116.548413395295 | -0.158413395295359 |
| 18 | 116.01 | 116.494573691869 | -0.484573691869246 |
| 19 | 116.74 | 117.297736605861 | -0.557736605860636 |
| 20 | 116.68 | 117.470582574949 | -0.790582574949178 |
| 21 | 117.45 | 117.708586694248 | -0.258586694247897 |
| 22 | 117.8 | 118.049850347445 | -0.249850347445452 |
| 23 | 119.37 | 118.394190309893 | 0.975809690106882 |
| 24 | 118.9 | 118.562210547637 | 0.337789452363106 |
| 25 | 119.05 | 119.218855476084 | -0.168855476084341 |
| 26 | 120.46 | 119.639783942795 | 0.820216057204807 |
| 27 | 120.99 | 120.013212765369 | 0.976787234631236 |
| 28 | 119.86 | 120.305971294249 | -0.445971294249443 |
| 29 | 120.18 | 119.892646450250 | 0.287353549750298 |
| 30 | 119.81 | 120.109572283830 | -0.299572283830449 |
| 31 | 120.15 | 120.392995951999 | -0.242995951998651 |
| 32 | 119.8 | 120.424592404899 | -0.624592404898929 |
| 33 | 120.27 | 120.429670832615 | -0.159670832615038 |
| 34 | 120.71 | 120.682786623876 | 0.0272133761235505 |
| 35 | 121.87 | 121.108109950969 | 0.76189004903057 |
| 36 | 121.87 | 122.266817353508 | -0.396817353508053 |
| 37 | 121.92 | 122.502009569407 | -0.582009569407412 |
| 38 | 123.72 | 122.552757217209 | 1.16724278279059 |
| 39 | 124.38 | 122.957703934009 | 1.42229606599118 |
| 40 | 123.21 | 123.133605079102 | 0.0763949208978032 |
| 41 | 123.17 | 123.328904886166 | -0.158904886165873 |
| 42 | 122.95 | 123.616329341807 | -0.666329341807101 |
| 43 | 123.46 | 124.059645379171 | -0.599645379170719 |
| 44 | 123.24 | 123.671484141343 | -0.431484141343407 |
| 45 | 123.86 | 123.785511513641 | 0.0744884863590672 |
| 46 | 124.28 | 124.311738006466 | -0.0317380064660795 |
| 47 | 124.78 | 124.681349445461 | 0.098650554539271 |
| 48 | 125.19 | 125.835836125314 | -0.645836125314084 |
| 49 | 125.46 | 126.327413350951 | -0.867413350950698 |
| 50 | 127.6 | 126.611086690335 | 0.988913309664724 |
| 51 | 127.8 | 126.517926586440 | 1.28207341356045 |
| 52 | 126.63 | 126.885732265653 | -0.255732265652858 |
| 53 | 127.06 | 127.358116029897 | -0.298116029897032 |
| 54 | 126.77 | 127.309240327633 | -0.539240327632887 |
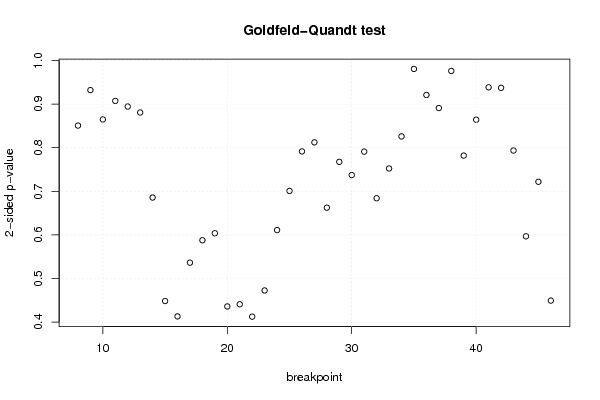
| Goldfeld-Quandt test for Heteroskedasticity | |||
| p-values | Alternative Hypothesis | ||
| breakpoint index | greater | 2-sided | less |
| 8 | 0.425351786077308 | 0.850703572154616 | 0.574648213922692 |
| 9 | 0.533957462090459 | 0.932085075819082 | 0.466042537909541 |
| 10 | 0.43239116866759 | 0.86478233733518 | 0.56760883133241 |
| 11 | 0.546384540636606 | 0.907230918726788 | 0.453615459363394 |
| 12 | 0.552827697318838 | 0.894344605362324 | 0.447172302681162 |
| 13 | 0.440338654031651 | 0.880677308063302 | 0.559661345968349 |
| 14 | 0.657196917167441 | 0.685606165665119 | 0.342803082832559 |
| 15 | 0.77589129041681 | 0.448217419166379 | 0.224108709583190 |
| 16 | 0.793492943582606 | 0.413014112834788 | 0.206507056417394 |
| 17 | 0.73193407780455 | 0.536131844390899 | 0.268065922195450 |
| 18 | 0.70621688651292 | 0.587566226974159 | 0.293783113487079 |
| 19 | 0.698172390304744 | 0.603655219390513 | 0.301827609695256 |
| 20 | 0.782133266165397 | 0.435733467669205 | 0.217866733834603 |
| 21 | 0.779648271303431 | 0.440703457393138 | 0.220351728696569 |
| 22 | 0.793838263241177 | 0.412323473517646 | 0.206161736758823 |
| 23 | 0.763815897765433 | 0.472368204469134 | 0.236184102234567 |
| 24 | 0.694509937565115 | 0.61098012486977 | 0.305490062434885 |
| 25 | 0.649636444125778 | 0.700727111748444 | 0.350363555874222 |
| 26 | 0.604312072384599 | 0.791375855230803 | 0.395687927615401 |
| 27 | 0.593879435838559 | 0.812241128322883 | 0.406120564161441 |
| 28 | 0.668822504186514 | 0.662354991626972 | 0.331177495813486 |
| 29 | 0.616248951204143 | 0.767502097591713 | 0.383751048795857 |
| 30 | 0.631404689325268 | 0.737190621349463 | 0.368595310674732 |
| 31 | 0.604510319852827 | 0.790979360294346 | 0.395489680147173 |
| 32 | 0.658011208072595 | 0.683977583854809 | 0.341988791927405 |
| 33 | 0.623883364375427 | 0.752233271249145 | 0.376116635624573 |
| 34 | 0.587119177351061 | 0.825761645297878 | 0.412880822648939 |
| 35 | 0.509708922465747 | 0.980582155068506 | 0.490291077534253 |
| 36 | 0.460435256928598 | 0.920870513857196 | 0.539564743071402 |
| 37 | 0.554534218764589 | 0.890931562470821 | 0.445465781235411 |
| 38 | 0.487993485569209 | 0.975986971138418 | 0.512006514430791 |
| 39 | 0.609057789359538 | 0.781884421280925 | 0.390942210640462 |
| 40 | 0.567944469430287 | 0.864111061139425 | 0.432055530569713 |
| 41 | 0.530776400471926 | 0.938447199056148 | 0.469223599528074 |
| 42 | 0.468618624623386 | 0.937237249246771 | 0.531381375376614 |
| 43 | 0.396719856675648 | 0.793439713351296 | 0.603280143324352 |
| 44 | 0.298314707601288 | 0.596629415202577 | 0.701685292398712 |
| 45 | 0.36088115244975 | 0.7217623048995 | 0.63911884755025 |
| 46 | 0.224588411665873 | 0.449176823331745 | 0.775411588334127 |
| Meta Analysis of Goldfeld-Quandt test for Heteroskedasticity | |||
| Description | # significant tests | % significant tests | OK/NOK |
| 1% type I error level | 0 | 0 | OK |
| 5% type I error level | 0 | 0 | OK |
| 10% type I error level | 0 | 0 | OK |