Free Statistics

of Irreproducible Research!

Author's title

Author*The author of this computation has been verified*
R Software Modulerwasp_arimabackwardselection.wasp
Title produced by softwareARIMA Backward Selection
Date of computationWed, 22 Dec 2010 14:50:00 +0000
Cite this page as followsStatistical Computations at FreeStatistics.org, Office for Research Development and Education, URL https://freestatistics.org/blog/index.php?v=date/2010/Dec/22/t12930293205bt73dgvdmhp6v0.htm/, Retrieved Mon, 06 May 2024 10:31:45 +0000
Statistical Computations at FreeStatistics.org, Office for Research Development and Education, URL https://freestatistics.org/blog/index.php?pk=114284, Retrieved Mon, 06 May 2024 10:31:45 +0000
QR Codes:

Original text written by user:
IsPrivate?No (this computation is public)
User-defined keywords
Estimated Impact125
Family? (F = Feedback message, R = changed R code, M = changed R Module, P = changed Parameters, D = changed Data)
-     [Univariate Explorative Data Analysis] [Run Sequence gebo...] [2008-12-12 13:32:37] [76963dc1903f0f612b6153510a3818cf]
- R  D  [Univariate Explorative Data Analysis] [Run Sequence gebo...] [2008-12-17 12:14:40] [76963dc1903f0f612b6153510a3818cf]
-         [Univariate Explorative Data Analysis] [Run Sequence Plot...] [2008-12-22 18:19:51] [1ce0d16c8f4225c977b42c8fa93bc163]
- RMP       [Univariate Data Series] [Identifying Integ...] [2009-11-22 12:08:06] [b98453cac15ba1066b407e146608df68]
- RMP         [Standard Deviation-Mean Plot] [Births] [2010-11-29 10:52:49] [b98453cac15ba1066b407e146608df68]
- RMP           [ARIMA Backward Selection] [Births] [2010-11-29 17:47:06] [b98453cac15ba1066b407e146608df68]
-   PD              [ARIMA Backward Selection] [Estimating ARMA p...] [2010-12-22 14:50:00] [8f110cf3e3846d42560df9b5835185a6] [Current]
-   PD                [ARIMA Backward Selection] [Estimating ARMA p...] [2010-12-22 16:23:53] [a8a0ff0853b70f438be515083758c362]
Feedback Forum

Post a new message
Dataseries X:
31806
34571
37121
40438
43635
48064
50846
53668
58465
58618
55826
60412
62714
63332
66050
62948
59535
57298
56599
57686
57472
60463
60784
63154
64042
65460
65268
65774
66028
67104
68102
69897
72185
73538
72325
74820
74813
74533
76916
80371
81261
81557
81446
81995
79948


Summary of computational transaction
Raw Inputview raw input (R code)
Raw Outputview raw output of R engine
Computing time8 seconds
R Server'George Udny Yule' @ 72.249.76.132

\begin{tabular}{lllllllll}
\hline
Summary of computational transaction \tabularnewline
Raw Input & view raw input (R code)  \tabularnewline
Raw Output & view raw output of R engine  \tabularnewline
Computing time & 8 seconds \tabularnewline
R Server & 'George Udny Yule' @ 72.249.76.132 \tabularnewline
\hline
\end{tabular}
%Source: https://freestatistics.org/blog/index.php?pk=114284&T=0

[TABLE]
[ROW][C]Summary of computational transaction[/C][/ROW]
[ROW][C]Raw Input[/C][C]view raw input (R code) [/C][/ROW]
[ROW][C]Raw Output[/C][C]view raw output of R engine [/C][/ROW]
[ROW][C]Computing time[/C][C]8 seconds[/C][/ROW]
[ROW][C]R Server[/C][C]'George Udny Yule' @ 72.249.76.132[/C][/ROW]
[/TABLE]
Source: https://freestatistics.org/blog/index.php?pk=114284&T=0

Globally Unique Identifier (entire table): ba.freestatistics.org/blog/index.php?pk=114284&T=0

As an alternative you can also use a QR Code:  

The GUIDs for individual cells are displayed in the table below:

Summary of computational transaction
Raw Inputview raw input (R code)
Raw Outputview raw output of R engine
Computing time8 seconds
R Server'George Udny Yule' @ 72.249.76.132


ARIMA Parameter Estimation and Backward Selection
Iterationar1ar2ar3ma1sar1sar2sma1
Estimates ( 1 )0.03380.13940.22920.2746-0.47360.0060.6036
(p-val)(0.9523 )(0.5579 )(0.1399 )(0.6294 )(0.6992 )(0.9816 )(0.6149 )
Estimates ( 2 )0.0230.14360.22920.2844-0.443600.5744
(p-val)(0.9677 )(0.548 )(0.1374 )(0.6177 )(0.6363 )(NA )(0.5135 )
Estimates ( 3 )00.15120.23050.307-0.438700.572
(p-val)(NA )(0.3215 )(0.1264 )(0.0573 )(0.6344 )(NA )(0.5097 )
Estimates ( 4 )00.14910.2270.3226000.1337
(p-val)(NA )(0.3302 )(0.1302 )(0.0396 )(NA )(NA )(0.4245 )
Estimates ( 5 )00.15410.24330.3261000
(p-val)(NA )(0.3124 )(0.1042 )(0.0324 )(NA )(NA )(NA )
Estimates ( 6 )000.26340.2935000
(p-val)(NA )(NA )(0.0839 )(0.0281 )(NA )(NA )(NA )
Estimates ( 7 )0000.3554000
(p-val)(NA )(NA )(NA )(0.0149 )(NA )(NA )(NA )
Estimates ( 8 )NANANANANANANA
(p-val)(NA )(NA )(NA )(NA )(NA )(NA )(NA )
Estimates ( 9 )NANANANANANANA
(p-val)(NA )(NA )(NA )(NA )(NA )(NA )(NA )
Estimates ( 10 )NANANANANANANA
(p-val)(NA )(NA )(NA )(NA )(NA )(NA )(NA )
Estimates ( 11 )NANANANANANANA
(p-val)(NA )(NA )(NA )(NA )(NA )(NA )(NA )
Estimates ( 12 )NANANANANANANA
(p-val)(NA )(NA )(NA )(NA )(NA )(NA )(NA )
Estimates ( 13 )NANANANANANANA
(p-val)(NA )(NA )(NA )(NA )(NA )(NA )(NA )

\begin{tabular}{lllllllll}
\hline
ARIMA Parameter Estimation and Backward Selection \tabularnewline
Iteration & ar1 & ar2 & ar3 & ma1 & sar1 & sar2 & sma1 \tabularnewline
Estimates ( 1 ) & 0.0338 & 0.1394 & 0.2292 & 0.2746 & -0.4736 & 0.006 & 0.6036 \tabularnewline
(p-val) & (0.9523 ) & (0.5579 ) & (0.1399 ) & (0.6294 ) & (0.6992 ) & (0.9816 ) & (0.6149 ) \tabularnewline
Estimates ( 2 ) & 0.023 & 0.1436 & 0.2292 & 0.2844 & -0.4436 & 0 & 0.5744 \tabularnewline
(p-val) & (0.9677 ) & (0.548 ) & (0.1374 ) & (0.6177 ) & (0.6363 ) & (NA ) & (0.5135 ) \tabularnewline
Estimates ( 3 ) & 0 & 0.1512 & 0.2305 & 0.307 & -0.4387 & 0 & 0.572 \tabularnewline
(p-val) & (NA ) & (0.3215 ) & (0.1264 ) & (0.0573 ) & (0.6344 ) & (NA ) & (0.5097 ) \tabularnewline
Estimates ( 4 ) & 0 & 0.1491 & 0.227 & 0.3226 & 0 & 0 & 0.1337 \tabularnewline
(p-val) & (NA ) & (0.3302 ) & (0.1302 ) & (0.0396 ) & (NA ) & (NA ) & (0.4245 ) \tabularnewline
Estimates ( 5 ) & 0 & 0.1541 & 0.2433 & 0.3261 & 0 & 0 & 0 \tabularnewline
(p-val) & (NA ) & (0.3124 ) & (0.1042 ) & (0.0324 ) & (NA ) & (NA ) & (NA ) \tabularnewline
Estimates ( 6 ) & 0 & 0 & 0.2634 & 0.2935 & 0 & 0 & 0 \tabularnewline
(p-val) & (NA ) & (NA ) & (0.0839 ) & (0.0281 ) & (NA ) & (NA ) & (NA ) \tabularnewline
Estimates ( 7 ) & 0 & 0 & 0 & 0.3554 & 0 & 0 & 0 \tabularnewline
(p-val) & (NA ) & (NA ) & (NA ) & (0.0149 ) & (NA ) & (NA ) & (NA ) \tabularnewline
Estimates ( 8 ) & NA & NA & NA & NA & NA & NA & NA \tabularnewline
(p-val) & (NA ) & (NA ) & (NA ) & (NA ) & (NA ) & (NA ) & (NA ) \tabularnewline
Estimates ( 9 ) & NA & NA & NA & NA & NA & NA & NA \tabularnewline
(p-val) & (NA ) & (NA ) & (NA ) & (NA ) & (NA ) & (NA ) & (NA ) \tabularnewline
Estimates ( 10 ) & NA & NA & NA & NA & NA & NA & NA \tabularnewline
(p-val) & (NA ) & (NA ) & (NA ) & (NA ) & (NA ) & (NA ) & (NA ) \tabularnewline
Estimates ( 11 ) & NA & NA & NA & NA & NA & NA & NA \tabularnewline
(p-val) & (NA ) & (NA ) & (NA ) & (NA ) & (NA ) & (NA ) & (NA ) \tabularnewline
Estimates ( 12 ) & NA & NA & NA & NA & NA & NA & NA \tabularnewline
(p-val) & (NA ) & (NA ) & (NA ) & (NA ) & (NA ) & (NA ) & (NA ) \tabularnewline
Estimates ( 13 ) & NA & NA & NA & NA & NA & NA & NA \tabularnewline
(p-val) & (NA ) & (NA ) & (NA ) & (NA ) & (NA ) & (NA ) & (NA ) \tabularnewline
\hline
\end{tabular}
%Source: https://freestatistics.org/blog/index.php?pk=114284&T=1

[TABLE]
[ROW][C]ARIMA Parameter Estimation and Backward Selection[/C][/ROW]
[ROW][C]Iteration[/C][C]ar1[/C][C]ar2[/C][C]ar3[/C][C]ma1[/C][C]sar1[/C][C]sar2[/C][C]sma1[/C][/ROW]
[ROW][C]Estimates ( 1 )[/C][C]0.0338[/C][C]0.1394[/C][C]0.2292[/C][C]0.2746[/C][C]-0.4736[/C][C]0.006[/C][C]0.6036[/C][/ROW]
[ROW][C](p-val)[/C][C](0.9523 )[/C][C](0.5579 )[/C][C](0.1399 )[/C][C](0.6294 )[/C][C](0.6992 )[/C][C](0.9816 )[/C][C](0.6149 )[/C][/ROW]
[ROW][C]Estimates ( 2 )[/C][C]0.023[/C][C]0.1436[/C][C]0.2292[/C][C]0.2844[/C][C]-0.4436[/C][C]0[/C][C]0.5744[/C][/ROW]
[ROW][C](p-val)[/C][C](0.9677 )[/C][C](0.548 )[/C][C](0.1374 )[/C][C](0.6177 )[/C][C](0.6363 )[/C][C](NA )[/C][C](0.5135 )[/C][/ROW]
[ROW][C]Estimates ( 3 )[/C][C]0[/C][C]0.1512[/C][C]0.2305[/C][C]0.307[/C][C]-0.4387[/C][C]0[/C][C]0.572[/C][/ROW]
[ROW][C](p-val)[/C][C](NA )[/C][C](0.3215 )[/C][C](0.1264 )[/C][C](0.0573 )[/C][C](0.6344 )[/C][C](NA )[/C][C](0.5097 )[/C][/ROW]
[ROW][C]Estimates ( 4 )[/C][C]0[/C][C]0.1491[/C][C]0.227[/C][C]0.3226[/C][C]0[/C][C]0[/C][C]0.1337[/C][/ROW]
[ROW][C](p-val)[/C][C](NA )[/C][C](0.3302 )[/C][C](0.1302 )[/C][C](0.0396 )[/C][C](NA )[/C][C](NA )[/C][C](0.4245 )[/C][/ROW]
[ROW][C]Estimates ( 5 )[/C][C]0[/C][C]0.1541[/C][C]0.2433[/C][C]0.3261[/C][C]0[/C][C]0[/C][C]0[/C][/ROW]
[ROW][C](p-val)[/C][C](NA )[/C][C](0.3124 )[/C][C](0.1042 )[/C][C](0.0324 )[/C][C](NA )[/C][C](NA )[/C][C](NA )[/C][/ROW]
[ROW][C]Estimates ( 6 )[/C][C]0[/C][C]0[/C][C]0.2634[/C][C]0.2935[/C][C]0[/C][C]0[/C][C]0[/C][/ROW]
[ROW][C](p-val)[/C][C](NA )[/C][C](NA )[/C][C](0.0839 )[/C][C](0.0281 )[/C][C](NA )[/C][C](NA )[/C][C](NA )[/C][/ROW]
[ROW][C]Estimates ( 7 )[/C][C]0[/C][C]0[/C][C]0[/C][C]0.3554[/C][C]0[/C][C]0[/C][C]0[/C][/ROW]
[ROW][C](p-val)[/C][C](NA )[/C][C](NA )[/C][C](NA )[/C][C](0.0149 )[/C][C](NA )[/C][C](NA )[/C][C](NA )[/C][/ROW]
[ROW][C]Estimates ( 8 )[/C][C]NA[/C][C]NA[/C][C]NA[/C][C]NA[/C][C]NA[/C][C]NA[/C][C]NA[/C][/ROW]
[ROW][C](p-val)[/C][C](NA )[/C][C](NA )[/C][C](NA )[/C][C](NA )[/C][C](NA )[/C][C](NA )[/C][C](NA )[/C][/ROW]
[ROW][C]Estimates ( 9 )[/C][C]NA[/C][C]NA[/C][C]NA[/C][C]NA[/C][C]NA[/C][C]NA[/C][C]NA[/C][/ROW]
[ROW][C](p-val)[/C][C](NA )[/C][C](NA )[/C][C](NA )[/C][C](NA )[/C][C](NA )[/C][C](NA )[/C][C](NA )[/C][/ROW]
[ROW][C]Estimates ( 10 )[/C][C]NA[/C][C]NA[/C][C]NA[/C][C]NA[/C][C]NA[/C][C]NA[/C][C]NA[/C][/ROW]
[ROW][C](p-val)[/C][C](NA )[/C][C](NA )[/C][C](NA )[/C][C](NA )[/C][C](NA )[/C][C](NA )[/C][C](NA )[/C][/ROW]
[ROW][C]Estimates ( 11 )[/C][C]NA[/C][C]NA[/C][C]NA[/C][C]NA[/C][C]NA[/C][C]NA[/C][C]NA[/C][/ROW]
[ROW][C](p-val)[/C][C](NA )[/C][C](NA )[/C][C](NA )[/C][C](NA )[/C][C](NA )[/C][C](NA )[/C][C](NA )[/C][/ROW]
[ROW][C]Estimates ( 12 )[/C][C]NA[/C][C]NA[/C][C]NA[/C][C]NA[/C][C]NA[/C][C]NA[/C][C]NA[/C][/ROW]
[ROW][C](p-val)[/C][C](NA )[/C][C](NA )[/C][C](NA )[/C][C](NA )[/C][C](NA )[/C][C](NA )[/C][C](NA )[/C][/ROW]
[ROW][C]Estimates ( 13 )[/C][C]NA[/C][C]NA[/C][C]NA[/C][C]NA[/C][C]NA[/C][C]NA[/C][C]NA[/C][/ROW]
[ROW][C](p-val)[/C][C](NA )[/C][C](NA )[/C][C](NA )[/C][C](NA )[/C][C](NA )[/C][C](NA )[/C][C](NA )[/C][/ROW]
[/TABLE]
Source: https://freestatistics.org/blog/index.php?pk=114284&T=1

Globally Unique Identifier (entire table): ba.freestatistics.org/blog/index.php?pk=114284&T=1

As an alternative you can also use a QR Code:  

The GUIDs for individual cells are displayed in the table below:

ARIMA Parameter Estimation and Backward Selection
Iterationar1ar2ar3ma1sar1sar2sma1
Estimates ( 1 )0.03380.13940.22920.2746-0.47360.0060.6036
(p-val)(0.9523 )(0.5579 )(0.1399 )(0.6294 )(0.6992 )(0.9816 )(0.6149 )
Estimates ( 2 )0.0230.14360.22920.2844-0.443600.5744
(p-val)(0.9677 )(0.548 )(0.1374 )(0.6177 )(0.6363 )(NA )(0.5135 )
Estimates ( 3 )00.15120.23050.307-0.438700.572
(p-val)(NA )(0.3215 )(0.1264 )(0.0573 )(0.6344 )(NA )(0.5097 )
Estimates ( 4 )00.14910.2270.3226000.1337
(p-val)(NA )(0.3302 )(0.1302 )(0.0396 )(NA )(NA )(0.4245 )
Estimates ( 5 )00.15410.24330.3261000
(p-val)(NA )(0.3124 )(0.1042 )(0.0324 )(NA )(NA )(NA )
Estimates ( 6 )000.26340.2935000
(p-val)(NA )(NA )(0.0839 )(0.0281 )(NA )(NA )(NA )
Estimates ( 7 )0000.3554000
(p-val)(NA )(NA )(NA )(0.0149 )(NA )(NA )(NA )
Estimates ( 8 )NANANANANANANA
(p-val)(NA )(NA )(NA )(NA )(NA )(NA )(NA )
Estimates ( 9 )NANANANANANANA
(p-val)(NA )(NA )(NA )(NA )(NA )(NA )(NA )
Estimates ( 10 )NANANANANANANA
(p-val)(NA )(NA )(NA )(NA )(NA )(NA )(NA )
Estimates ( 11 )NANANANANANANA
(p-val)(NA )(NA )(NA )(NA )(NA )(NA )(NA )
Estimates ( 12 )NANANANANANANA
(p-val)(NA )(NA )(NA )(NA )(NA )(NA )(NA )
Estimates ( 13 )NANANANANANANA
(p-val)(NA )(NA )(NA )(NA )(NA )(NA )(NA )


Estimated ARIMA Residuals
Value
1011621.04566149
169885114.309031
128080468.377748
200098040.389014
163445479.491777
310079769.830092
116420351.770093
189971348.877523
375167924.571966
-164674786.120075
-348887892.16982
493771969.960841
133802371.814752
122794325.731134
175206251.098169
-526232400.888818
-284111532.98597
-270603802.781642
105208589.930260
203465306.947512
-15514174.4860120
378267949.290902
-104818877.025929
330987345.750125
-77106425.1079097
196011452.763986
-159998751.931424
83512355.9589748
-39403082.4187551
161425822.056401
70093378.8490658
218318414.805662
223276696.320623
96091227.541646
-270382199.259152
360849604.923820
-158886526.585575
51419770.4196978
249106899.21803
470593172.239736
16755116.0628824
-51788941.5394487
-146038363.97678
94697009.0182676
-371984386.906946

\begin{tabular}{lllllllll}
\hline
Estimated ARIMA Residuals \tabularnewline
Value \tabularnewline
1011621.04566149 \tabularnewline
169885114.309031 \tabularnewline
128080468.377748 \tabularnewline
200098040.389014 \tabularnewline
163445479.491777 \tabularnewline
310079769.830092 \tabularnewline
116420351.770093 \tabularnewline
189971348.877523 \tabularnewline
375167924.571966 \tabularnewline
-164674786.120075 \tabularnewline
-348887892.16982 \tabularnewline
493771969.960841 \tabularnewline
133802371.814752 \tabularnewline
122794325.731134 \tabularnewline
175206251.098169 \tabularnewline
-526232400.888818 \tabularnewline
-284111532.98597 \tabularnewline
-270603802.781642 \tabularnewline
105208589.930260 \tabularnewline
203465306.947512 \tabularnewline
-15514174.4860120 \tabularnewline
378267949.290902 \tabularnewline
-104818877.025929 \tabularnewline
330987345.750125 \tabularnewline
-77106425.1079097 \tabularnewline
196011452.763986 \tabularnewline
-159998751.931424 \tabularnewline
83512355.9589748 \tabularnewline
-39403082.4187551 \tabularnewline
161425822.056401 \tabularnewline
70093378.8490658 \tabularnewline
218318414.805662 \tabularnewline
223276696.320623 \tabularnewline
96091227.541646 \tabularnewline
-270382199.259152 \tabularnewline
360849604.923820 \tabularnewline
-158886526.585575 \tabularnewline
51419770.4196978 \tabularnewline
249106899.21803 \tabularnewline
470593172.239736 \tabularnewline
16755116.0628824 \tabularnewline
-51788941.5394487 \tabularnewline
-146038363.97678 \tabularnewline
94697009.0182676 \tabularnewline
-371984386.906946 \tabularnewline
\hline
\end{tabular}
%Source: https://freestatistics.org/blog/index.php?pk=114284&T=2

[TABLE]
[ROW][C]Estimated ARIMA Residuals[/C][/ROW]
[ROW][C]Value[/C][/ROW]
[ROW][C]1011621.04566149[/C][/ROW]
[ROW][C]169885114.309031[/C][/ROW]
[ROW][C]128080468.377748[/C][/ROW]
[ROW][C]200098040.389014[/C][/ROW]
[ROW][C]163445479.491777[/C][/ROW]
[ROW][C]310079769.830092[/C][/ROW]
[ROW][C]116420351.770093[/C][/ROW]
[ROW][C]189971348.877523[/C][/ROW]
[ROW][C]375167924.571966[/C][/ROW]
[ROW][C]-164674786.120075[/C][/ROW]
[ROW][C]-348887892.16982[/C][/ROW]
[ROW][C]493771969.960841[/C][/ROW]
[ROW][C]133802371.814752[/C][/ROW]
[ROW][C]122794325.731134[/C][/ROW]
[ROW][C]175206251.098169[/C][/ROW]
[ROW][C]-526232400.888818[/C][/ROW]
[ROW][C]-284111532.98597[/C][/ROW]
[ROW][C]-270603802.781642[/C][/ROW]
[ROW][C]105208589.930260[/C][/ROW]
[ROW][C]203465306.947512[/C][/ROW]
[ROW][C]-15514174.4860120[/C][/ROW]
[ROW][C]378267949.290902[/C][/ROW]
[ROW][C]-104818877.025929[/C][/ROW]
[ROW][C]330987345.750125[/C][/ROW]
[ROW][C]-77106425.1079097[/C][/ROW]
[ROW][C]196011452.763986[/C][/ROW]
[ROW][C]-159998751.931424[/C][/ROW]
[ROW][C]83512355.9589748[/C][/ROW]
[ROW][C]-39403082.4187551[/C][/ROW]
[ROW][C]161425822.056401[/C][/ROW]
[ROW][C]70093378.8490658[/C][/ROW]
[ROW][C]218318414.805662[/C][/ROW]
[ROW][C]223276696.320623[/C][/ROW]
[ROW][C]96091227.541646[/C][/ROW]
[ROW][C]-270382199.259152[/C][/ROW]
[ROW][C]360849604.923820[/C][/ROW]
[ROW][C]-158886526.585575[/C][/ROW]
[ROW][C]51419770.4196978[/C][/ROW]
[ROW][C]249106899.21803[/C][/ROW]
[ROW][C]470593172.239736[/C][/ROW]
[ROW][C]16755116.0628824[/C][/ROW]
[ROW][C]-51788941.5394487[/C][/ROW]
[ROW][C]-146038363.97678[/C][/ROW]
[ROW][C]94697009.0182676[/C][/ROW]
[ROW][C]-371984386.906946[/C][/ROW]
[/TABLE]
Source: https://freestatistics.org/blog/index.php?pk=114284&T=2

Globally Unique Identifier (entire table): ba.freestatistics.org/blog/index.php?pk=114284&T=2

As an alternative you can also use a QR Code:  

The GUIDs for individual cells are displayed in the table below:

Estimated ARIMA Residuals
Value
1011621.04566149
169885114.309031
128080468.377748
200098040.389014
163445479.491777
310079769.830092
116420351.770093
189971348.877523
375167924.571966
-164674786.120075
-348887892.16982
493771969.960841
133802371.814752
122794325.731134
175206251.098169
-526232400.888818
-284111532.98597
-270603802.781642
105208589.930260
203465306.947512
-15514174.4860120
378267949.290902
-104818877.025929
330987345.750125
-77106425.1079097
196011452.763986
-159998751.931424
83512355.9589748
-39403082.4187551
161425822.056401
70093378.8490658
218318414.805662
223276696.320623
96091227.541646
-270382199.259152
360849604.923820
-158886526.585575
51419770.4196978
249106899.21803
470593172.239736
16755116.0628824
-51788941.5394487
-146038363.97678
94697009.0182676
-371984386.906946


Parameters (Session):
par1 = FALSE ; par2 = 2.0 ; par3 = 1 ; par4 = 0 ; par5 = 6 ; par6 = 3 ; par7 = 1 ; par8 = 2 ; par9 = 1 ;
Parameters (R input):
par1 = FALSE ; par2 = 2.0 ; par3 = 1 ; par4 = 0 ; par5 = 6 ; par6 = 3 ; par7 = 1 ; par8 = 2 ; par9 = 1 ;
R code (references can be found in the software module):
library(lattice)
if (par1 == 'TRUE') par1 <- TRUE
if (par1 == 'FALSE') par1 <- FALSE
par2 <- as.numeric(par2) #Box-Cox lambda transformation parameter
par3 <- as.numeric(par3) #degree of non-seasonal differencing
par4 <- as.numeric(par4) #degree of seasonal differencing
par5 <- as.numeric(par5) #seasonal period
par6 <- as.numeric(par6) #degree (p) of the non-seasonal AR(p) polynomial
par7 <- as.numeric(par7) #degree (q) of the non-seasonal MA(q) polynomial
par8 <- as.numeric(par8) #degree (P) of the seasonal AR(P) polynomial
par9 <- as.numeric(par9) #degree (Q) of the seasonal MA(Q) polynomial
armaGR <- function(arima.out, names, n){
try1 <- arima.out$coef
try2 <- sqrt(diag(arima.out$var.coef))
try.data.frame <- data.frame(matrix(NA,ncol=4,nrow=length(names)))
dimnames(try.data.frame) <- list(names,c('coef','std','tstat','pv'))
try.data.frame[,1] <- try1
for(i in 1:length(try2)) try.data.frame[which(rownames(try.data.frame)==names(try2)[i]),2] <- try2[i]
try.data.frame[,3] <- try.data.frame[,1] / try.data.frame[,2]
try.data.frame[,4] <- round((1-pt(abs(try.data.frame[,3]),df=n-(length(try2)+1)))*2,5)
vector <- rep(NA,length(names))
vector[is.na(try.data.frame[,4])] <- 0
maxi <- which.max(try.data.frame[,4])
continue <- max(try.data.frame[,4],na.rm=TRUE) > .05
vector[maxi] <- 0
list(summary=try.data.frame,next.vector=vector,continue=continue)
}
arimaSelect <- function(series, order=c(13,0,0), seasonal=list(order=c(2,0,0),period=12), include.mean=F){
nrc <- order[1]+order[3]+seasonal$order[1]+seasonal$order[3]
coeff <- matrix(NA, nrow=nrc*2, ncol=nrc)
pval <- matrix(NA, nrow=nrc*2, ncol=nrc)
mylist <- rep(list(NULL), nrc)
names <- NULL
if(order[1] > 0) names <- paste('ar',1:order[1],sep='')
if(order[3] > 0) names <- c( names , paste('ma',1:order[3],sep='') )
if(seasonal$order[1] > 0) names <- c(names, paste('sar',1:seasonal$order[1],sep=''))
if(seasonal$order[3] > 0) names <- c(names, paste('sma',1:seasonal$order[3],sep=''))
arima.out <- arima(series, order=order, seasonal=seasonal, include.mean=include.mean, method='ML')
mylist[[1]] <- arima.out
last.arma <- armaGR(arima.out, names, length(series))
mystop <- FALSE
i <- 1
coeff[i,] <- last.arma[[1]][,1]
pval [i,] <- last.arma[[1]][,4]
i <- 2
aic <- arima.out$aic
while(!mystop){
mylist[[i]] <- arima.out
arima.out <- arima(series, order=order, seasonal=seasonal, include.mean=include.mean, method='ML', fixed=last.arma$next.vector)
aic <- c(aic, arima.out$aic)
last.arma <- armaGR(arima.out, names, length(series))
mystop <- !last.arma$continue
coeff[i,] <- last.arma[[1]][,1]
pval [i,] <- last.arma[[1]][,4]
i <- i+1
}
list(coeff, pval, mylist, aic=aic)
}
arimaSelectplot <- function(arimaSelect.out,noms,choix){
noms <- names(arimaSelect.out[[3]][[1]]$coef)
coeff <- arimaSelect.out[[1]]
k <- min(which(is.na(coeff[,1])))-1
coeff <- coeff[1:k,]
pval <- arimaSelect.out[[2]][1:k,]
aic <- arimaSelect.out$aic[1:k]
coeff[coeff==0] <- NA
n <- ncol(coeff)
if(missing(choix)) choix <- k
layout(matrix(c(1,1,1,2,
3,3,3,2,
3,3,3,4,
5,6,7,7),nr=4),
widths=c(10,35,45,15),
heights=c(30,30,15,15))
couleurs <- rainbow(75)[1:50]#(50)
ticks <- pretty(coeff)
par(mar=c(1,1,3,1))
plot(aic,k:1-.5,type='o',pch=21,bg='blue',cex=2,axes=F,lty=2,xpd=NA)
points(aic[choix],k-choix+.5,pch=21,cex=4,bg=2,xpd=NA)
title('aic',line=2)
par(mar=c(3,0,0,0))
plot(0,axes=F,xlab='',ylab='',xlim=range(ticks),ylim=c(.1,1))
rect(xleft = min(ticks) + (0:49)/50*(max(ticks)-min(ticks)),
xright = min(ticks) + (1:50)/50*(max(ticks)-min(ticks)),
ytop = rep(1,50),
ybottom= rep(0,50),col=couleurs,border=NA)
axis(1,ticks)
rect(xleft=min(ticks),xright=max(ticks),ytop=1,ybottom=0)
text(mean(coeff,na.rm=T),.5,'coefficients',cex=2,font=2)
par(mar=c(1,1,3,1))
image(1:n,1:k,t(coeff[k:1,]),axes=F,col=couleurs,zlim=range(ticks))
for(i in 1:n) for(j in 1:k) if(!is.na(coeff[j,i])) {
if(pval[j,i]<.01) symb = 'green'
else if( (pval[j,i]<.05) & (pval[j,i]>=.01)) symb = 'orange'
else if( (pval[j,i]<.1) & (pval[j,i]>=.05)) symb = 'red'
else symb = 'black'
polygon(c(i+.5 ,i+.2 ,i+.5 ,i+.5),
c(k-j+0.5,k-j+0.5,k-j+0.8,k-j+0.5),
col=symb)
if(j==choix) {
rect(xleft=i-.5,
xright=i+.5,
ybottom=k-j+1.5,
ytop=k-j+.5,
lwd=4)
text(i,
k-j+1,
round(coeff[j,i],2),
cex=1.2,
font=2)
}
else{
rect(xleft=i-.5,xright=i+.5,ybottom=k-j+1.5,ytop=k-j+.5)
text(i,k-j+1,round(coeff[j,i],2),cex=1.2,font=1)
}
}
axis(3,1:n,noms)
par(mar=c(0.5,0,0,0.5))
plot(0,axes=F,xlab='',ylab='',type='n',xlim=c(0,8),ylim=c(-.2,.8))
cols <- c('green','orange','red','black')
niv <- c('0','0.01','0.05','0.1')
for(i in 0:3){
polygon(c(1+2*i ,1+2*i ,1+2*i-.5 ,1+2*i),
c(.4 ,.7 , .4 , .4),
col=cols[i+1])
text(2*i,0.5,niv[i+1],cex=1.5)
}
text(8,.5,1,cex=1.5)
text(4,0,'p-value',cex=2)
box()
residus <- arimaSelect.out[[3]][[choix]]$res
par(mar=c(1,2,4,1))
acf(residus,main='')
title('acf',line=.5)
par(mar=c(1,2,4,1))
pacf(residus,main='')
title('pacf',line=.5)
par(mar=c(2,2,4,1))
qqnorm(residus,main='')
title('qq-norm',line=.5)
qqline(residus)
residus
}
if (par2 == 0) x <- log(x)
if (par2 != 0) x <- x^par2
(selection <- arimaSelect(x, order=c(par6,par3,par7), seasonal=list(order=c(par8,par4,par9), period=par5)))
bitmap(file='test1.png')
resid <- arimaSelectplot(selection)
dev.off()
resid
bitmap(file='test2.png')
acf(resid,length(resid)/2, main='Residual Autocorrelation Function')
dev.off()
bitmap(file='test3.png')
pacf(resid,length(resid)/2, main='Residual Partial Autocorrelation Function')
dev.off()
bitmap(file='test4.png')
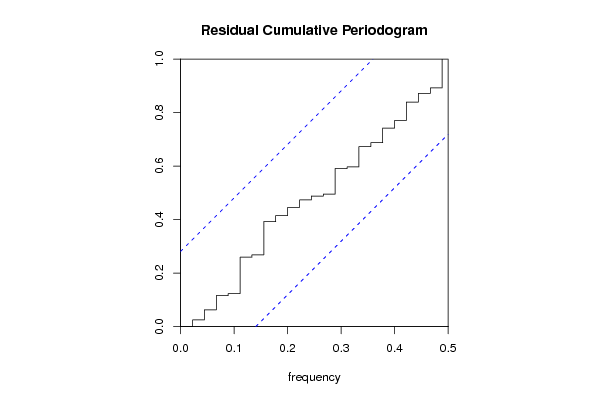
cpgram(resid, main='Residual Cumulative Periodogram')
dev.off()
bitmap(file='test5.png')
hist(resid, main='Residual Histogram', xlab='values of Residuals')
dev.off()
bitmap(file='test6.png')
densityplot(~resid,col='black',main='Residual Density Plot', xlab='values of Residuals')
dev.off()
bitmap(file='test7.png')
qqnorm(resid, main='Residual Normal Q-Q Plot')
qqline(resid)
dev.off()
ncols <- length(selection[[1]][1,])
nrows <- length(selection[[2]][,1])-1
load(file='createtable')
a<-table.start()
a<-table.row.start(a)
a<-table.element(a,'ARIMA Parameter Estimation and Backward Selection', ncols+1,TRUE)
a<-table.row.end(a)
a<-table.row.start(a)
a<-table.element(a,'Iteration', header=TRUE)
for (i in 1:ncols) {
a<-table.element(a,names(selection[[3]][[1]]$coef)[i],header=TRUE)
}
a<-table.row.end(a)
for (j in 1:nrows) {
a<-table.row.start(a)
mydum <- 'Estimates ('
mydum <- paste(mydum,j)
mydum <- paste(mydum,')')
a<-table.element(a,mydum, header=TRUE)
for (i in 1:ncols) {
a<-table.element(a,round(selection[[1]][j,i],4))
}
a<-table.row.end(a)
a<-table.row.start(a)
a<-table.element(a,'(p-val)', header=TRUE)
for (i in 1:ncols) {
mydum <- '('
mydum <- paste(mydum,round(selection[[2]][j,i],4),sep='')
mydum <- paste(mydum,')')
a<-table.element(a,mydum)
}
a<-table.row.end(a)
}
a<-table.end(a)
table.save(a,file='mytable.tab')
a<-table.start()
a<-table.row.start(a)
a<-table.element(a,'Estimated ARIMA Residuals', 1,TRUE)
a<-table.row.end(a)
a<-table.row.start(a)
a<-table.element(a,'Value', 1,TRUE)
a<-table.row.end(a)
for (i in (par4*par5+par3):length(resid)) {
a<-table.row.start(a)
a<-table.element(a,resid[i])
a<-table.row.end(a)
}
a<-table.end(a)
table.save(a,file='mytable1.tab')