Free Statistics

of Irreproducible Research!

Author's title

Author*The author of this computation has been verified*
R Software Modulerwasp_autocorrelation.wasp
Title produced by software(Partial) Autocorrelation Function
Date of computationWed, 22 Dec 2010 14:37:44 +0000
Cite this page as followsStatistical Computations at FreeStatistics.org, Office for Research Development and Education, URL https://freestatistics.org/blog/index.php?v=date/2010/Dec/22/t1293028766dn78usz2ckoibzn.htm/, Retrieved Mon, 06 May 2024 00:06:55 +0000
Statistical Computations at FreeStatistics.org, Office for Research Development and Education, URL https://freestatistics.org/blog/index.php?pk=114273, Retrieved Mon, 06 May 2024 00:06:55 +0000
QR Codes:

Original text written by user:
IsPrivate?No (this computation is public)
User-defined keywords
Estimated Impact100
Family? (F = Feedback message, R = changed R code, M = changed R Module, P = changed Parameters, D = changed Data)
-       [(Partial) Autocorrelation Function] [Statistiek Paper 8] [2010-12-22 14:37:44] [97dee3ad7274585c4a7ecb4c981cc7fb] [Current]
Feedback Forum

Post a new message
Dataseries X:
5732
6938
6660
6695
6484
7716
5927
4768
7081
6947
7723
7319
6285
6655
7331
6468
7653
7330
5907
5257
7029
8885
9477
6822
8595
8738
11380
9831
10560
10336
8872
7598
9713
10858
10430
7516
8344
8623
9238
10350
9415
9550
8301
6405
10251
10082
8683
7829
6712
7354
8402
8211
8377
9133
8301
5932
9080
9459
9647
8646
7503
10000
10441
6435
8102
9983
8662
6575
9088
9336
9089


Summary of computational transaction
Raw Inputview raw input (R code)
Raw Outputview raw output of R engine
Computing time2 seconds
R Server'RServer@AstonUniversity' @ vre.aston.ac.uk

\begin{tabular}{lllllllll}
\hline
Summary of computational transaction \tabularnewline
Raw Input & view raw input (R code)  \tabularnewline
Raw Output & view raw output of R engine  \tabularnewline
Computing time & 2 seconds \tabularnewline
R Server & 'RServer@AstonUniversity' @ vre.aston.ac.uk \tabularnewline
\hline
\end{tabular}
%Source: https://freestatistics.org/blog/index.php?pk=114273&T=0

[TABLE]
[ROW][C]Summary of computational transaction[/C][/ROW]
[ROW][C]Raw Input[/C][C]view raw input (R code) [/C][/ROW]
[ROW][C]Raw Output[/C][C]view raw output of R engine [/C][/ROW]
[ROW][C]Computing time[/C][C]2 seconds[/C][/ROW]
[ROW][C]R Server[/C][C]'RServer@AstonUniversity' @ vre.aston.ac.uk[/C][/ROW]
[/TABLE]
Source: https://freestatistics.org/blog/index.php?pk=114273&T=0

Globally Unique Identifier (entire table): ba.freestatistics.org/blog/index.php?pk=114273&T=0

As an alternative you can also use a QR Code:  

The GUIDs for individual cells are displayed in the table below:

Summary of computational transaction
Raw Inputview raw input (R code)
Raw Outputview raw output of R engine
Computing time2 seconds
R Server'RServer@AstonUniversity' @ vre.aston.ac.uk


Autocorrelation Function
Time lag kACF(k)T-STATP-value
1-0.423142-3.22260.001043
2-0.05232-0.39850.345878
30.1743631.32790.094705
4-0.185413-1.41210.081637
50.165421.25980.106393
6-0.03731-0.28410.388657
7-0.05971-0.45470.325497
80.1937351.47540.072751
9-0.249293-1.89860.031301
100.03370.25670.399178
110.008460.06440.474426
12-0.05493-0.41830.338623
130.0094130.07170.471549
14-0.062184-0.47360.318789
150.2097371.59730.057815
16-0.282659-2.15270.017758
170.0714160.54390.294301
180.168061.27990.102837
19-0.212745-1.62020.055305
200.0915520.69720.244219
21-0.010867-0.08280.467163
22-0.12436-0.94710.17376
230.2726522.07650.021146
24-0.36836-2.80530.003415
250.165741.26220.105958
260.0477060.36330.358845
27-0.164804-1.25510.107236
280.1815461.38260.086042
29-0.023276-0.17730.429959
30-0.06311-0.48060.316292
310.009230.07030.4721
320.0159950.12180.451733
330.0717880.54670.293335
340.0023750.01810.492815
350.0030810.02350.49068
360.0423270.32240.374171
37-0.03325-0.25320.400494
38-0.008789-0.06690.473431
39-0.072592-0.55280.291247
400.1609391.22570.112638
41-0.027714-0.21110.416789
42-0.108557-0.82670.205885
430.0759520.57840.282604
44-0.06128-0.46670.321232
450.0112810.08590.465916
460.0516050.3930.347876
47-0.062129-0.47320.318938
480.0195850.14920.440973
49-0.035351-0.26920.394355
500.0261950.19950.421287
510.0154220.11740.453456
52-0.02784-0.2120.416418
530.0187910.14310.443351
54-0.014775-0.11250.455399
550.0084040.0640.474593
56-0.003466-0.02640.489515
570.0037580.02860.488633
58NANANA
59NANANA
60NANANA

\begin{tabular}{lllllllll}
\hline
Autocorrelation Function \tabularnewline
Time lag k & ACF(k) & T-STAT & P-value \tabularnewline
1 & -0.423142 & -3.2226 & 0.001043 \tabularnewline
2 & -0.05232 & -0.3985 & 0.345878 \tabularnewline
3 & 0.174363 & 1.3279 & 0.094705 \tabularnewline
4 & -0.185413 & -1.4121 & 0.081637 \tabularnewline
5 & 0.16542 & 1.2598 & 0.106393 \tabularnewline
6 & -0.03731 & -0.2841 & 0.388657 \tabularnewline
7 & -0.05971 & -0.4547 & 0.325497 \tabularnewline
8 & 0.193735 & 1.4754 & 0.072751 \tabularnewline
9 & -0.249293 & -1.8986 & 0.031301 \tabularnewline
10 & 0.0337 & 0.2567 & 0.399178 \tabularnewline
11 & 0.00846 & 0.0644 & 0.474426 \tabularnewline
12 & -0.05493 & -0.4183 & 0.338623 \tabularnewline
13 & 0.009413 & 0.0717 & 0.471549 \tabularnewline
14 & -0.062184 & -0.4736 & 0.318789 \tabularnewline
15 & 0.209737 & 1.5973 & 0.057815 \tabularnewline
16 & -0.282659 & -2.1527 & 0.017758 \tabularnewline
17 & 0.071416 & 0.5439 & 0.294301 \tabularnewline
18 & 0.16806 & 1.2799 & 0.102837 \tabularnewline
19 & -0.212745 & -1.6202 & 0.055305 \tabularnewline
20 & 0.091552 & 0.6972 & 0.244219 \tabularnewline
21 & -0.010867 & -0.0828 & 0.467163 \tabularnewline
22 & -0.12436 & -0.9471 & 0.17376 \tabularnewline
23 & 0.272652 & 2.0765 & 0.021146 \tabularnewline
24 & -0.36836 & -2.8053 & 0.003415 \tabularnewline
25 & 0.16574 & 1.2622 & 0.105958 \tabularnewline
26 & 0.047706 & 0.3633 & 0.358845 \tabularnewline
27 & -0.164804 & -1.2551 & 0.107236 \tabularnewline
28 & 0.181546 & 1.3826 & 0.086042 \tabularnewline
29 & -0.023276 & -0.1773 & 0.429959 \tabularnewline
30 & -0.06311 & -0.4806 & 0.316292 \tabularnewline
31 & 0.00923 & 0.0703 & 0.4721 \tabularnewline
32 & 0.015995 & 0.1218 & 0.451733 \tabularnewline
33 & 0.071788 & 0.5467 & 0.293335 \tabularnewline
34 & 0.002375 & 0.0181 & 0.492815 \tabularnewline
35 & 0.003081 & 0.0235 & 0.49068 \tabularnewline
36 & 0.042327 & 0.3224 & 0.374171 \tabularnewline
37 & -0.03325 & -0.2532 & 0.400494 \tabularnewline
38 & -0.008789 & -0.0669 & 0.473431 \tabularnewline
39 & -0.072592 & -0.5528 & 0.291247 \tabularnewline
40 & 0.160939 & 1.2257 & 0.112638 \tabularnewline
41 & -0.027714 & -0.2111 & 0.416789 \tabularnewline
42 & -0.108557 & -0.8267 & 0.205885 \tabularnewline
43 & 0.075952 & 0.5784 & 0.282604 \tabularnewline
44 & -0.06128 & -0.4667 & 0.321232 \tabularnewline
45 & 0.011281 & 0.0859 & 0.465916 \tabularnewline
46 & 0.051605 & 0.393 & 0.347876 \tabularnewline
47 & -0.062129 & -0.4732 & 0.318938 \tabularnewline
48 & 0.019585 & 0.1492 & 0.440973 \tabularnewline
49 & -0.035351 & -0.2692 & 0.394355 \tabularnewline
50 & 0.026195 & 0.1995 & 0.421287 \tabularnewline
51 & 0.015422 & 0.1174 & 0.453456 \tabularnewline
52 & -0.02784 & -0.212 & 0.416418 \tabularnewline
53 & 0.018791 & 0.1431 & 0.443351 \tabularnewline
54 & -0.014775 & -0.1125 & 0.455399 \tabularnewline
55 & 0.008404 & 0.064 & 0.474593 \tabularnewline
56 & -0.003466 & -0.0264 & 0.489515 \tabularnewline
57 & 0.003758 & 0.0286 & 0.488633 \tabularnewline
58 & NA & NA & NA \tabularnewline
59 & NA & NA & NA \tabularnewline
60 & NA & NA & NA \tabularnewline
\hline
\end{tabular}
%Source: https://freestatistics.org/blog/index.php?pk=114273&T=1

[TABLE]
[ROW][C]Autocorrelation Function[/C][/ROW]
[ROW][C]Time lag k[/C][C]ACF(k)[/C][C]T-STAT[/C][C]P-value[/C][/ROW]
[ROW][C]1[/C][C]-0.423142[/C][C]-3.2226[/C][C]0.001043[/C][/ROW]
[ROW][C]2[/C][C]-0.05232[/C][C]-0.3985[/C][C]0.345878[/C][/ROW]
[ROW][C]3[/C][C]0.174363[/C][C]1.3279[/C][C]0.094705[/C][/ROW]
[ROW][C]4[/C][C]-0.185413[/C][C]-1.4121[/C][C]0.081637[/C][/ROW]
[ROW][C]5[/C][C]0.16542[/C][C]1.2598[/C][C]0.106393[/C][/ROW]
[ROW][C]6[/C][C]-0.03731[/C][C]-0.2841[/C][C]0.388657[/C][/ROW]
[ROW][C]7[/C][C]-0.05971[/C][C]-0.4547[/C][C]0.325497[/C][/ROW]
[ROW][C]8[/C][C]0.193735[/C][C]1.4754[/C][C]0.072751[/C][/ROW]
[ROW][C]9[/C][C]-0.249293[/C][C]-1.8986[/C][C]0.031301[/C][/ROW]
[ROW][C]10[/C][C]0.0337[/C][C]0.2567[/C][C]0.399178[/C][/ROW]
[ROW][C]11[/C][C]0.00846[/C][C]0.0644[/C][C]0.474426[/C][/ROW]
[ROW][C]12[/C][C]-0.05493[/C][C]-0.4183[/C][C]0.338623[/C][/ROW]
[ROW][C]13[/C][C]0.009413[/C][C]0.0717[/C][C]0.471549[/C][/ROW]
[ROW][C]14[/C][C]-0.062184[/C][C]-0.4736[/C][C]0.318789[/C][/ROW]
[ROW][C]15[/C][C]0.209737[/C][C]1.5973[/C][C]0.057815[/C][/ROW]
[ROW][C]16[/C][C]-0.282659[/C][C]-2.1527[/C][C]0.017758[/C][/ROW]
[ROW][C]17[/C][C]0.071416[/C][C]0.5439[/C][C]0.294301[/C][/ROW]
[ROW][C]18[/C][C]0.16806[/C][C]1.2799[/C][C]0.102837[/C][/ROW]
[ROW][C]19[/C][C]-0.212745[/C][C]-1.6202[/C][C]0.055305[/C][/ROW]
[ROW][C]20[/C][C]0.091552[/C][C]0.6972[/C][C]0.244219[/C][/ROW]
[ROW][C]21[/C][C]-0.010867[/C][C]-0.0828[/C][C]0.467163[/C][/ROW]
[ROW][C]22[/C][C]-0.12436[/C][C]-0.9471[/C][C]0.17376[/C][/ROW]
[ROW][C]23[/C][C]0.272652[/C][C]2.0765[/C][C]0.021146[/C][/ROW]
[ROW][C]24[/C][C]-0.36836[/C][C]-2.8053[/C][C]0.003415[/C][/ROW]
[ROW][C]25[/C][C]0.16574[/C][C]1.2622[/C][C]0.105958[/C][/ROW]
[ROW][C]26[/C][C]0.047706[/C][C]0.3633[/C][C]0.358845[/C][/ROW]
[ROW][C]27[/C][C]-0.164804[/C][C]-1.2551[/C][C]0.107236[/C][/ROW]
[ROW][C]28[/C][C]0.181546[/C][C]1.3826[/C][C]0.086042[/C][/ROW]
[ROW][C]29[/C][C]-0.023276[/C][C]-0.1773[/C][C]0.429959[/C][/ROW]
[ROW][C]30[/C][C]-0.06311[/C][C]-0.4806[/C][C]0.316292[/C][/ROW]
[ROW][C]31[/C][C]0.00923[/C][C]0.0703[/C][C]0.4721[/C][/ROW]
[ROW][C]32[/C][C]0.015995[/C][C]0.1218[/C][C]0.451733[/C][/ROW]
[ROW][C]33[/C][C]0.071788[/C][C]0.5467[/C][C]0.293335[/C][/ROW]
[ROW][C]34[/C][C]0.002375[/C][C]0.0181[/C][C]0.492815[/C][/ROW]
[ROW][C]35[/C][C]0.003081[/C][C]0.0235[/C][C]0.49068[/C][/ROW]
[ROW][C]36[/C][C]0.042327[/C][C]0.3224[/C][C]0.374171[/C][/ROW]
[ROW][C]37[/C][C]-0.03325[/C][C]-0.2532[/C][C]0.400494[/C][/ROW]
[ROW][C]38[/C][C]-0.008789[/C][C]-0.0669[/C][C]0.473431[/C][/ROW]
[ROW][C]39[/C][C]-0.072592[/C][C]-0.5528[/C][C]0.291247[/C][/ROW]
[ROW][C]40[/C][C]0.160939[/C][C]1.2257[/C][C]0.112638[/C][/ROW]
[ROW][C]41[/C][C]-0.027714[/C][C]-0.2111[/C][C]0.416789[/C][/ROW]
[ROW][C]42[/C][C]-0.108557[/C][C]-0.8267[/C][C]0.205885[/C][/ROW]
[ROW][C]43[/C][C]0.075952[/C][C]0.5784[/C][C]0.282604[/C][/ROW]
[ROW][C]44[/C][C]-0.06128[/C][C]-0.4667[/C][C]0.321232[/C][/ROW]
[ROW][C]45[/C][C]0.011281[/C][C]0.0859[/C][C]0.465916[/C][/ROW]
[ROW][C]46[/C][C]0.051605[/C][C]0.393[/C][C]0.347876[/C][/ROW]
[ROW][C]47[/C][C]-0.062129[/C][C]-0.4732[/C][C]0.318938[/C][/ROW]
[ROW][C]48[/C][C]0.019585[/C][C]0.1492[/C][C]0.440973[/C][/ROW]
[ROW][C]49[/C][C]-0.035351[/C][C]-0.2692[/C][C]0.394355[/C][/ROW]
[ROW][C]50[/C][C]0.026195[/C][C]0.1995[/C][C]0.421287[/C][/ROW]
[ROW][C]51[/C][C]0.015422[/C][C]0.1174[/C][C]0.453456[/C][/ROW]
[ROW][C]52[/C][C]-0.02784[/C][C]-0.212[/C][C]0.416418[/C][/ROW]
[ROW][C]53[/C][C]0.018791[/C][C]0.1431[/C][C]0.443351[/C][/ROW]
[ROW][C]54[/C][C]-0.014775[/C][C]-0.1125[/C][C]0.455399[/C][/ROW]
[ROW][C]55[/C][C]0.008404[/C][C]0.064[/C][C]0.474593[/C][/ROW]
[ROW][C]56[/C][C]-0.003466[/C][C]-0.0264[/C][C]0.489515[/C][/ROW]
[ROW][C]57[/C][C]0.003758[/C][C]0.0286[/C][C]0.488633[/C][/ROW]
[ROW][C]58[/C][C]NA[/C][C]NA[/C][C]NA[/C][/ROW]
[ROW][C]59[/C][C]NA[/C][C]NA[/C][C]NA[/C][/ROW]
[ROW][C]60[/C][C]NA[/C][C]NA[/C][C]NA[/C][/ROW]
[/TABLE]
Source: https://freestatistics.org/blog/index.php?pk=114273&T=1

Globally Unique Identifier (entire table): ba.freestatistics.org/blog/index.php?pk=114273&T=1

As an alternative you can also use a QR Code:  

The GUIDs for individual cells are displayed in the table below:

Autocorrelation Function
Time lag kACF(k)T-STATP-value
1-0.423142-3.22260.001043
2-0.05232-0.39850.345878
30.1743631.32790.094705
4-0.185413-1.41210.081637
50.165421.25980.106393
6-0.03731-0.28410.388657
7-0.05971-0.45470.325497
80.1937351.47540.072751
9-0.249293-1.89860.031301
100.03370.25670.399178
110.008460.06440.474426
12-0.05493-0.41830.338623
130.0094130.07170.471549
14-0.062184-0.47360.318789
150.2097371.59730.057815
16-0.282659-2.15270.017758
170.0714160.54390.294301
180.168061.27990.102837
19-0.212745-1.62020.055305
200.0915520.69720.244219
21-0.010867-0.08280.467163
22-0.12436-0.94710.17376
230.2726522.07650.021146
24-0.36836-2.80530.003415
250.165741.26220.105958
260.0477060.36330.358845
27-0.164804-1.25510.107236
280.1815461.38260.086042
29-0.023276-0.17730.429959
30-0.06311-0.48060.316292
310.009230.07030.4721
320.0159950.12180.451733
330.0717880.54670.293335
340.0023750.01810.492815
350.0030810.02350.49068
360.0423270.32240.374171
37-0.03325-0.25320.400494
38-0.008789-0.06690.473431
39-0.072592-0.55280.291247
400.1609391.22570.112638
41-0.027714-0.21110.416789
42-0.108557-0.82670.205885
430.0759520.57840.282604
44-0.06128-0.46670.321232
450.0112810.08590.465916
460.0516050.3930.347876
47-0.062129-0.47320.318938
480.0195850.14920.440973
49-0.035351-0.26920.394355
500.0261950.19950.421287
510.0154220.11740.453456
52-0.02784-0.2120.416418
530.0187910.14310.443351
54-0.014775-0.11250.455399
550.0084040.0640.474593
56-0.003466-0.02640.489515
570.0037580.02860.488633
58NANANA
59NANANA
60NANANA


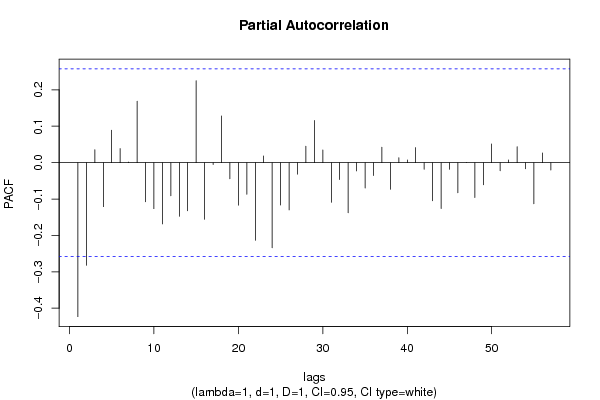
Partial Autocorrelation Function
Time lag kPACF(k)T-STATP-value
1-0.423142-3.22260.001043
2-0.28183-2.14640.01802
30.0353710.26940.394298
4-0.121029-0.92170.180245
50.0888750.67680.250596
60.0384890.29310.385236
70.0014730.01120.495543
80.168671.28460.102027
9-0.107724-0.82040.207674
10-0.126459-0.96310.169752
11-0.168363-1.28220.102435
12-0.091121-0.6940.245239
13-0.147271-1.12160.133331
14-0.132083-1.00590.159318
150.2250181.71370.045964
16-0.155636-1.18530.120369
17-0.005393-0.04110.483689
180.128430.97810.166045
19-0.044594-0.33960.367685
20-0.11681-0.88960.188678
21-0.08689-0.66170.25538
22-0.213141-1.62320.054981
230.0184350.14040.444417
24-0.234121-1.7830.039909
25-0.116377-0.88630.189558
26-0.129874-0.98910.163363
27-0.03159-0.24060.405363
280.0448370.34150.366993
290.1157980.88190.190737
300.0346420.26380.396425
31-0.108816-0.82870.205331
32-0.046678-0.35550.361755
33-0.137882-1.05010.149019
34-0.022793-0.17360.431397
35-0.069917-0.53250.298218
36-0.035689-0.27180.393371
370.0421940.32130.374554
38-0.073392-0.55890.289177
390.0137080.10440.458607
400.0070920.0540.478557
410.0413550.3150.376964
42-0.018233-0.13890.445021
43-0.104719-0.79750.214202
44-0.126295-0.96180.170063
45-0.018222-0.13880.445056
46-0.082581-0.62890.265937
47-0.000108-8e-040.499672
48-0.095843-0.72990.23419
49-0.060854-0.46350.322387
500.0511510.38960.349147
51-0.022588-0.1720.432008
520.0074780.05690.477391
530.0434560.33090.370938
54-0.016836-0.12820.449208
55-0.113076-0.86120.196349
560.0267090.20340.419762
57-0.020516-0.15620.438192
58NANANA
59NANANA
60NANANA

\begin{tabular}{lllllllll}
\hline
Partial Autocorrelation Function \tabularnewline
Time lag k & PACF(k) & T-STAT & P-value \tabularnewline
1 & -0.423142 & -3.2226 & 0.001043 \tabularnewline
2 & -0.28183 & -2.1464 & 0.01802 \tabularnewline
3 & 0.035371 & 0.2694 & 0.394298 \tabularnewline
4 & -0.121029 & -0.9217 & 0.180245 \tabularnewline
5 & 0.088875 & 0.6768 & 0.250596 \tabularnewline
6 & 0.038489 & 0.2931 & 0.385236 \tabularnewline
7 & 0.001473 & 0.0112 & 0.495543 \tabularnewline
8 & 0.16867 & 1.2846 & 0.102027 \tabularnewline
9 & -0.107724 & -0.8204 & 0.207674 \tabularnewline
10 & -0.126459 & -0.9631 & 0.169752 \tabularnewline
11 & -0.168363 & -1.2822 & 0.102435 \tabularnewline
12 & -0.091121 & -0.694 & 0.245239 \tabularnewline
13 & -0.147271 & -1.1216 & 0.133331 \tabularnewline
14 & -0.132083 & -1.0059 & 0.159318 \tabularnewline
15 & 0.225018 & 1.7137 & 0.045964 \tabularnewline
16 & -0.155636 & -1.1853 & 0.120369 \tabularnewline
17 & -0.005393 & -0.0411 & 0.483689 \tabularnewline
18 & 0.12843 & 0.9781 & 0.166045 \tabularnewline
19 & -0.044594 & -0.3396 & 0.367685 \tabularnewline
20 & -0.11681 & -0.8896 & 0.188678 \tabularnewline
21 & -0.08689 & -0.6617 & 0.25538 \tabularnewline
22 & -0.213141 & -1.6232 & 0.054981 \tabularnewline
23 & 0.018435 & 0.1404 & 0.444417 \tabularnewline
24 & -0.234121 & -1.783 & 0.039909 \tabularnewline
25 & -0.116377 & -0.8863 & 0.189558 \tabularnewline
26 & -0.129874 & -0.9891 & 0.163363 \tabularnewline
27 & -0.03159 & -0.2406 & 0.405363 \tabularnewline
28 & 0.044837 & 0.3415 & 0.366993 \tabularnewline
29 & 0.115798 & 0.8819 & 0.190737 \tabularnewline
30 & 0.034642 & 0.2638 & 0.396425 \tabularnewline
31 & -0.108816 & -0.8287 & 0.205331 \tabularnewline
32 & -0.046678 & -0.3555 & 0.361755 \tabularnewline
33 & -0.137882 & -1.0501 & 0.149019 \tabularnewline
34 & -0.022793 & -0.1736 & 0.431397 \tabularnewline
35 & -0.069917 & -0.5325 & 0.298218 \tabularnewline
36 & -0.035689 & -0.2718 & 0.393371 \tabularnewline
37 & 0.042194 & 0.3213 & 0.374554 \tabularnewline
38 & -0.073392 & -0.5589 & 0.289177 \tabularnewline
39 & 0.013708 & 0.1044 & 0.458607 \tabularnewline
40 & 0.007092 & 0.054 & 0.478557 \tabularnewline
41 & 0.041355 & 0.315 & 0.376964 \tabularnewline
42 & -0.018233 & -0.1389 & 0.445021 \tabularnewline
43 & -0.104719 & -0.7975 & 0.214202 \tabularnewline
44 & -0.126295 & -0.9618 & 0.170063 \tabularnewline
45 & -0.018222 & -0.1388 & 0.445056 \tabularnewline
46 & -0.082581 & -0.6289 & 0.265937 \tabularnewline
47 & -0.000108 & -8e-04 & 0.499672 \tabularnewline
48 & -0.095843 & -0.7299 & 0.23419 \tabularnewline
49 & -0.060854 & -0.4635 & 0.322387 \tabularnewline
50 & 0.051151 & 0.3896 & 0.349147 \tabularnewline
51 & -0.022588 & -0.172 & 0.432008 \tabularnewline
52 & 0.007478 & 0.0569 & 0.477391 \tabularnewline
53 & 0.043456 & 0.3309 & 0.370938 \tabularnewline
54 & -0.016836 & -0.1282 & 0.449208 \tabularnewline
55 & -0.113076 & -0.8612 & 0.196349 \tabularnewline
56 & 0.026709 & 0.2034 & 0.419762 \tabularnewline
57 & -0.020516 & -0.1562 & 0.438192 \tabularnewline
58 & NA & NA & NA \tabularnewline
59 & NA & NA & NA \tabularnewline
60 & NA & NA & NA \tabularnewline
\hline
\end{tabular}
%Source: https://freestatistics.org/blog/index.php?pk=114273&T=2

[TABLE]
[ROW][C]Partial Autocorrelation Function[/C][/ROW]
[ROW][C]Time lag k[/C][C]PACF(k)[/C][C]T-STAT[/C][C]P-value[/C][/ROW]
[ROW][C]1[/C][C]-0.423142[/C][C]-3.2226[/C][C]0.001043[/C][/ROW]
[ROW][C]2[/C][C]-0.28183[/C][C]-2.1464[/C][C]0.01802[/C][/ROW]
[ROW][C]3[/C][C]0.035371[/C][C]0.2694[/C][C]0.394298[/C][/ROW]
[ROW][C]4[/C][C]-0.121029[/C][C]-0.9217[/C][C]0.180245[/C][/ROW]
[ROW][C]5[/C][C]0.088875[/C][C]0.6768[/C][C]0.250596[/C][/ROW]
[ROW][C]6[/C][C]0.038489[/C][C]0.2931[/C][C]0.385236[/C][/ROW]
[ROW][C]7[/C][C]0.001473[/C][C]0.0112[/C][C]0.495543[/C][/ROW]
[ROW][C]8[/C][C]0.16867[/C][C]1.2846[/C][C]0.102027[/C][/ROW]
[ROW][C]9[/C][C]-0.107724[/C][C]-0.8204[/C][C]0.207674[/C][/ROW]
[ROW][C]10[/C][C]-0.126459[/C][C]-0.9631[/C][C]0.169752[/C][/ROW]
[ROW][C]11[/C][C]-0.168363[/C][C]-1.2822[/C][C]0.102435[/C][/ROW]
[ROW][C]12[/C][C]-0.091121[/C][C]-0.694[/C][C]0.245239[/C][/ROW]
[ROW][C]13[/C][C]-0.147271[/C][C]-1.1216[/C][C]0.133331[/C][/ROW]
[ROW][C]14[/C][C]-0.132083[/C][C]-1.0059[/C][C]0.159318[/C][/ROW]
[ROW][C]15[/C][C]0.225018[/C][C]1.7137[/C][C]0.045964[/C][/ROW]
[ROW][C]16[/C][C]-0.155636[/C][C]-1.1853[/C][C]0.120369[/C][/ROW]
[ROW][C]17[/C][C]-0.005393[/C][C]-0.0411[/C][C]0.483689[/C][/ROW]
[ROW][C]18[/C][C]0.12843[/C][C]0.9781[/C][C]0.166045[/C][/ROW]
[ROW][C]19[/C][C]-0.044594[/C][C]-0.3396[/C][C]0.367685[/C][/ROW]
[ROW][C]20[/C][C]-0.11681[/C][C]-0.8896[/C][C]0.188678[/C][/ROW]
[ROW][C]21[/C][C]-0.08689[/C][C]-0.6617[/C][C]0.25538[/C][/ROW]
[ROW][C]22[/C][C]-0.213141[/C][C]-1.6232[/C][C]0.054981[/C][/ROW]
[ROW][C]23[/C][C]0.018435[/C][C]0.1404[/C][C]0.444417[/C][/ROW]
[ROW][C]24[/C][C]-0.234121[/C][C]-1.783[/C][C]0.039909[/C][/ROW]
[ROW][C]25[/C][C]-0.116377[/C][C]-0.8863[/C][C]0.189558[/C][/ROW]
[ROW][C]26[/C][C]-0.129874[/C][C]-0.9891[/C][C]0.163363[/C][/ROW]
[ROW][C]27[/C][C]-0.03159[/C][C]-0.2406[/C][C]0.405363[/C][/ROW]
[ROW][C]28[/C][C]0.044837[/C][C]0.3415[/C][C]0.366993[/C][/ROW]
[ROW][C]29[/C][C]0.115798[/C][C]0.8819[/C][C]0.190737[/C][/ROW]
[ROW][C]30[/C][C]0.034642[/C][C]0.2638[/C][C]0.396425[/C][/ROW]
[ROW][C]31[/C][C]-0.108816[/C][C]-0.8287[/C][C]0.205331[/C][/ROW]
[ROW][C]32[/C][C]-0.046678[/C][C]-0.3555[/C][C]0.361755[/C][/ROW]
[ROW][C]33[/C][C]-0.137882[/C][C]-1.0501[/C][C]0.149019[/C][/ROW]
[ROW][C]34[/C][C]-0.022793[/C][C]-0.1736[/C][C]0.431397[/C][/ROW]
[ROW][C]35[/C][C]-0.069917[/C][C]-0.5325[/C][C]0.298218[/C][/ROW]
[ROW][C]36[/C][C]-0.035689[/C][C]-0.2718[/C][C]0.393371[/C][/ROW]
[ROW][C]37[/C][C]0.042194[/C][C]0.3213[/C][C]0.374554[/C][/ROW]
[ROW][C]38[/C][C]-0.073392[/C][C]-0.5589[/C][C]0.289177[/C][/ROW]
[ROW][C]39[/C][C]0.013708[/C][C]0.1044[/C][C]0.458607[/C][/ROW]
[ROW][C]40[/C][C]0.007092[/C][C]0.054[/C][C]0.478557[/C][/ROW]
[ROW][C]41[/C][C]0.041355[/C][C]0.315[/C][C]0.376964[/C][/ROW]
[ROW][C]42[/C][C]-0.018233[/C][C]-0.1389[/C][C]0.445021[/C][/ROW]
[ROW][C]43[/C][C]-0.104719[/C][C]-0.7975[/C][C]0.214202[/C][/ROW]
[ROW][C]44[/C][C]-0.126295[/C][C]-0.9618[/C][C]0.170063[/C][/ROW]
[ROW][C]45[/C][C]-0.018222[/C][C]-0.1388[/C][C]0.445056[/C][/ROW]
[ROW][C]46[/C][C]-0.082581[/C][C]-0.6289[/C][C]0.265937[/C][/ROW]
[ROW][C]47[/C][C]-0.000108[/C][C]-8e-04[/C][C]0.499672[/C][/ROW]
[ROW][C]48[/C][C]-0.095843[/C][C]-0.7299[/C][C]0.23419[/C][/ROW]
[ROW][C]49[/C][C]-0.060854[/C][C]-0.4635[/C][C]0.322387[/C][/ROW]
[ROW][C]50[/C][C]0.051151[/C][C]0.3896[/C][C]0.349147[/C][/ROW]
[ROW][C]51[/C][C]-0.022588[/C][C]-0.172[/C][C]0.432008[/C][/ROW]
[ROW][C]52[/C][C]0.007478[/C][C]0.0569[/C][C]0.477391[/C][/ROW]
[ROW][C]53[/C][C]0.043456[/C][C]0.3309[/C][C]0.370938[/C][/ROW]
[ROW][C]54[/C][C]-0.016836[/C][C]-0.1282[/C][C]0.449208[/C][/ROW]
[ROW][C]55[/C][C]-0.113076[/C][C]-0.8612[/C][C]0.196349[/C][/ROW]
[ROW][C]56[/C][C]0.026709[/C][C]0.2034[/C][C]0.419762[/C][/ROW]
[ROW][C]57[/C][C]-0.020516[/C][C]-0.1562[/C][C]0.438192[/C][/ROW]
[ROW][C]58[/C][C]NA[/C][C]NA[/C][C]NA[/C][/ROW]
[ROW][C]59[/C][C]NA[/C][C]NA[/C][C]NA[/C][/ROW]
[ROW][C]60[/C][C]NA[/C][C]NA[/C][C]NA[/C][/ROW]
[/TABLE]
Source: https://freestatistics.org/blog/index.php?pk=114273&T=2

Globally Unique Identifier (entire table): ba.freestatistics.org/blog/index.php?pk=114273&T=2

As an alternative you can also use a QR Code:  

The GUIDs for individual cells are displayed in the table below:

Partial Autocorrelation Function
Time lag kPACF(k)T-STATP-value
1-0.423142-3.22260.001043
2-0.28183-2.14640.01802
30.0353710.26940.394298
4-0.121029-0.92170.180245
50.0888750.67680.250596
60.0384890.29310.385236
70.0014730.01120.495543
80.168671.28460.102027
9-0.107724-0.82040.207674
10-0.126459-0.96310.169752
11-0.168363-1.28220.102435
12-0.091121-0.6940.245239
13-0.147271-1.12160.133331
14-0.132083-1.00590.159318
150.2250181.71370.045964
16-0.155636-1.18530.120369
17-0.005393-0.04110.483689
180.128430.97810.166045
19-0.044594-0.33960.367685
20-0.11681-0.88960.188678
21-0.08689-0.66170.25538
22-0.213141-1.62320.054981
230.0184350.14040.444417
24-0.234121-1.7830.039909
25-0.116377-0.88630.189558
26-0.129874-0.98910.163363
27-0.03159-0.24060.405363
280.0448370.34150.366993
290.1157980.88190.190737
300.0346420.26380.396425
31-0.108816-0.82870.205331
32-0.046678-0.35550.361755
33-0.137882-1.05010.149019
34-0.022793-0.17360.431397
35-0.069917-0.53250.298218
36-0.035689-0.27180.393371
370.0421940.32130.374554
38-0.073392-0.55890.289177
390.0137080.10440.458607
400.0070920.0540.478557
410.0413550.3150.376964
42-0.018233-0.13890.445021
43-0.104719-0.79750.214202
44-0.126295-0.96180.170063
45-0.018222-0.13880.445056
46-0.082581-0.62890.265937
47-0.000108-8e-040.499672
48-0.095843-0.72990.23419
49-0.060854-0.46350.322387
500.0511510.38960.349147
51-0.022588-0.1720.432008
520.0074780.05690.477391
530.0434560.33090.370938
54-0.016836-0.12820.449208
55-0.113076-0.86120.196349
560.0267090.20340.419762
57-0.020516-0.15620.438192
58NANANA
59NANANA
60NANANA


Parameters (Session):
par1 = 60 ; par2 = 1 ; par3 = 1 ; par4 = 1 ; par5 = 12 ; par6 = White Noise ; par7 = 0.95 ;
Parameters (R input):
par1 = 60 ; par2 = 1 ; par3 = 1 ; par4 = 1 ; par5 = 12 ; par6 = White Noise ; par7 = 0.95 ; par8 = ;
R code (references can be found in the software module):
if (par1 == 'Default') {
par1 = 10*log10(length(x))
} else {
par1 <- as.numeric(par1)
}
par2 <- as.numeric(par2)
par3 <- as.numeric(par3)
par4 <- as.numeric(par4)
par5 <- as.numeric(par5)
if (par6 == 'White Noise') par6 <- 'white' else par6 <- 'ma'
par7 <- as.numeric(par7)
if (par8 != '') par8 <- as.numeric(par8)
ox <- x
if (par8 == '') {
if (par2 == 0) {
x <- log(x)
} else {
x <- (x ^ par2 - 1) / par2
}
} else {
x <- log(x,base=par8)
}
if (par3 > 0) x <- diff(x,lag=1,difference=par3)
if (par4 > 0) x <- diff(x,lag=par5,difference=par4)
bitmap(file='picts.png')
op <- par(mfrow=c(2,1))
plot(ox,type='l',main='Original Time Series',xlab='time',ylab='value')
if (par8=='') {
mytitle <- paste('Working Time Series (lambda=',par2,', d=',par3,', D=',par4,')',sep='')
mysub <- paste('(lambda=',par2,', d=',par3,', D=',par4,', CI=', par7, ', CI type=',par6,')',sep='')
} else {
mytitle <- paste('Working Time Series (base=',par8,', d=',par3,', D=',par4,')',sep='')
mysub <- paste('(base=',par8,', d=',par3,', D=',par4,', CI=', par7, ', CI type=',par6,')',sep='')
}
plot(x,type='l', main=mytitle,xlab='time',ylab='value')
par(op)
dev.off()
bitmap(file='pic1.png')
racf <- acf(x, par1, main='Autocorrelation', xlab='time lag', ylab='ACF', ci.type=par6, ci=par7, sub=mysub)
dev.off()
bitmap(file='pic2.png')
rpacf <- pacf(x,par1,main='Partial Autocorrelation',xlab='lags',ylab='PACF',sub=mysub)
dev.off()
(myacf <- c(racf$acf))
(mypacf <- c(rpacf$acf))
lengthx <- length(x)
sqrtn <- sqrt(lengthx)
load(file='createtable')
a<-table.start()
a<-table.row.start(a)
a<-table.element(a,'Autocorrelation Function',4,TRUE)
a<-table.row.end(a)
a<-table.row.start(a)
a<-table.element(a,'Time lag k',header=TRUE)
a<-table.element(a,hyperlink('basics.htm','ACF(k)','click here for more information about the Autocorrelation Function'),header=TRUE)
a<-table.element(a,'T-STAT',header=TRUE)
a<-table.element(a,'P-value',header=TRUE)
a<-table.row.end(a)
for (i in 2:(par1+1)) {
a<-table.row.start(a)
a<-table.element(a,i-1,header=TRUE)
a<-table.element(a,round(myacf[i],6))
mytstat <- myacf[i]*sqrtn
a<-table.element(a,round(mytstat,4))
a<-table.element(a,round(1-pt(abs(mytstat),lengthx),6))
a<-table.row.end(a)
}
a<-table.end(a)
table.save(a,file='mytable.tab')
a<-table.start()
a<-table.row.start(a)
a<-table.element(a,'Partial Autocorrelation Function',4,TRUE)
a<-table.row.end(a)
a<-table.row.start(a)
a<-table.element(a,'Time lag k',header=TRUE)
a<-table.element(a,hyperlink('basics.htm','PACF(k)','click here for more information about the Partial Autocorrelation Function'),header=TRUE)
a<-table.element(a,'T-STAT',header=TRUE)
a<-table.element(a,'P-value',header=TRUE)
a<-table.row.end(a)
for (i in 1:par1) {
a<-table.row.start(a)
a<-table.element(a,i,header=TRUE)
a<-table.element(a,round(mypacf[i],6))
mytstat <- mypacf[i]*sqrtn
a<-table.element(a,round(mytstat,4))
a<-table.element(a,round(1-pt(abs(mytstat),lengthx),6))
a<-table.row.end(a)
}
a<-table.end(a)
table.save(a,file='mytable1.tab')