Free Statistics

of Irreproducible Research!

Author's title

Author*The author of this computation has been verified*
R Software Modulerwasp_autocorrelation.wasp
Title produced by software(Partial) Autocorrelation Function
Date of computationWed, 22 Dec 2010 14:25:17 +0000
Cite this page as followsStatistical Computations at FreeStatistics.org, Office for Research Development and Education, URL https://freestatistics.org/blog/index.php?v=date/2010/Dec/22/t1293027811eyiew2j9zlm5t07.htm/, Retrieved Mon, 06 May 2024 01:24:51 +0000
Statistical Computations at FreeStatistics.org, Office for Research Development and Education, URL https://freestatistics.org/blog/index.php?pk=114248, Retrieved Mon, 06 May 2024 01:24:51 +0000
QR Codes:

Original text written by user:
IsPrivate?No (this computation is public)
User-defined keywords
Estimated Impact108
Family? (F = Feedback message, R = changed R code, M = changed R Module, P = changed Parameters, D = changed Data)
-     [Univariate Data Series] [Tijdreeks Totaal ...] [2008-12-19 10:47:31] [063e4b67ad7d3a8a83eccec794cd5aa7]
- RMPD    [(Partial) Autocorrelation Function] [Autocorrelatie fu...] [2010-12-22 14:25:17] [55fca7c82a53ae69fe96aa1750b06058] [Current]
Feedback Forum

Post a new message
Dataseries X:
716
677
710
839
886
891
917
820
793
932
906
844
801
957
1159
1264
1097
1240
1411
1535
1862
1894
2239
2465
2423
2692
2856
3450
4162
4260
4225
4092
4160
3896
3628
3754
3749
3907
4449
5272
6197
6446
7157
7559
7674
6929
7156
6805
7095
7222
7593
7910
7878


Summary of computational transaction
Raw Inputview raw input (R code)
Raw Outputview raw output of R engine
Computing time2 seconds
R Server'RServer@AstonUniversity' @ vre.aston.ac.uk

\begin{tabular}{lllllllll}
\hline
Summary of computational transaction \tabularnewline
Raw Input & view raw input (R code)  \tabularnewline
Raw Output & view raw output of R engine  \tabularnewline
Computing time & 2 seconds \tabularnewline
R Server & 'RServer@AstonUniversity' @ vre.aston.ac.uk \tabularnewline
\hline
\end{tabular}
%Source: https://freestatistics.org/blog/index.php?pk=114248&T=0

[TABLE]
[ROW][C]Summary of computational transaction[/C][/ROW]
[ROW][C]Raw Input[/C][C]view raw input (R code) [/C][/ROW]
[ROW][C]Raw Output[/C][C]view raw output of R engine [/C][/ROW]
[ROW][C]Computing time[/C][C]2 seconds[/C][/ROW]
[ROW][C]R Server[/C][C]'RServer@AstonUniversity' @ vre.aston.ac.uk[/C][/ROW]
[/TABLE]
Source: https://freestatistics.org/blog/index.php?pk=114248&T=0

Globally Unique Identifier (entire table): ba.freestatistics.org/blog/index.php?pk=114248&T=0

As an alternative you can also use a QR Code:  

The GUIDs for individual cells are displayed in the table below:

Summary of computational transaction
Raw Inputview raw input (R code)
Raw Outputview raw output of R engine
Computing time2 seconds
R Server'RServer@AstonUniversity' @ vre.aston.ac.uk


Autocorrelation Function
Time lag kACF(k)T-STATP-value
10.3674572.64980.005322
20.2992172.15770.017797
30.0110780.07990.468317
4-0.043743-0.31540.376847
5-0.283871-2.0470.022862
6-0.376336-2.71380.004501
7-0.268385-1.93530.029197
8-0.134138-0.96730.16894
9-0.135471-0.97690.166572
100.024320.17540.430733
110.1818331.31120.097773
120.1704161.22890.112323
130.1248970.90060.185964
140.157551.13610.13056
150.1108060.7990.213953
16-0.007841-0.05650.477565
17-0.115031-0.82950.205306
18-0.060197-0.43410.333009
19-0.054157-0.39050.348869
20-0.032815-0.23660.406936
210.031370.22620.410963
220.0104790.07560.470027
230.0268210.19340.423697
24-0.018982-0.13690.445827
25-0.044434-0.32040.374969
264.9e-054e-040.499861
27-0.087982-0.63440.264285
28-0.004565-0.03290.486934
290.0385450.2780.391076
30-0.049508-0.3570.361266
31-0.040061-0.28890.386909
32-0.09737-0.70210.242861
33-0.037257-0.26870.394626
34-0.052998-0.38220.351946
35-0.042391-0.30570.380532
36-0.033562-0.2420.404858
37-0.009705-0.070.472237
38-0.039181-0.28250.389326
39-0.02278-0.16430.435078
400.0169720.12240.451533
41-0.008094-0.05840.476839
42-0.001096-0.00790.496862
430.0084270.06080.475889
440.0226960.16370.435315
450.0055160.03980.484212
460.0102750.07410.470609
47-0.004975-0.03590.485758
48-0.002008-0.01450.494252

\begin{tabular}{lllllllll}
\hline
Autocorrelation Function \tabularnewline
Time lag k & ACF(k) & T-STAT & P-value \tabularnewline
1 & 0.367457 & 2.6498 & 0.005322 \tabularnewline
2 & 0.299217 & 2.1577 & 0.017797 \tabularnewline
3 & 0.011078 & 0.0799 & 0.468317 \tabularnewline
4 & -0.043743 & -0.3154 & 0.376847 \tabularnewline
5 & -0.283871 & -2.047 & 0.022862 \tabularnewline
6 & -0.376336 & -2.7138 & 0.004501 \tabularnewline
7 & -0.268385 & -1.9353 & 0.029197 \tabularnewline
8 & -0.134138 & -0.9673 & 0.16894 \tabularnewline
9 & -0.135471 & -0.9769 & 0.166572 \tabularnewline
10 & 0.02432 & 0.1754 & 0.430733 \tabularnewline
11 & 0.181833 & 1.3112 & 0.097773 \tabularnewline
12 & 0.170416 & 1.2289 & 0.112323 \tabularnewline
13 & 0.124897 & 0.9006 & 0.185964 \tabularnewline
14 & 0.15755 & 1.1361 & 0.13056 \tabularnewline
15 & 0.110806 & 0.799 & 0.213953 \tabularnewline
16 & -0.007841 & -0.0565 & 0.477565 \tabularnewline
17 & -0.115031 & -0.8295 & 0.205306 \tabularnewline
18 & -0.060197 & -0.4341 & 0.333009 \tabularnewline
19 & -0.054157 & -0.3905 & 0.348869 \tabularnewline
20 & -0.032815 & -0.2366 & 0.406936 \tabularnewline
21 & 0.03137 & 0.2262 & 0.410963 \tabularnewline
22 & 0.010479 & 0.0756 & 0.470027 \tabularnewline
23 & 0.026821 & 0.1934 & 0.423697 \tabularnewline
24 & -0.018982 & -0.1369 & 0.445827 \tabularnewline
25 & -0.044434 & -0.3204 & 0.374969 \tabularnewline
26 & 4.9e-05 & 4e-04 & 0.499861 \tabularnewline
27 & -0.087982 & -0.6344 & 0.264285 \tabularnewline
28 & -0.004565 & -0.0329 & 0.486934 \tabularnewline
29 & 0.038545 & 0.278 & 0.391076 \tabularnewline
30 & -0.049508 & -0.357 & 0.361266 \tabularnewline
31 & -0.040061 & -0.2889 & 0.386909 \tabularnewline
32 & -0.09737 & -0.7021 & 0.242861 \tabularnewline
33 & -0.037257 & -0.2687 & 0.394626 \tabularnewline
34 & -0.052998 & -0.3822 & 0.351946 \tabularnewline
35 & -0.042391 & -0.3057 & 0.380532 \tabularnewline
36 & -0.033562 & -0.242 & 0.404858 \tabularnewline
37 & -0.009705 & -0.07 & 0.472237 \tabularnewline
38 & -0.039181 & -0.2825 & 0.389326 \tabularnewline
39 & -0.02278 & -0.1643 & 0.435078 \tabularnewline
40 & 0.016972 & 0.1224 & 0.451533 \tabularnewline
41 & -0.008094 & -0.0584 & 0.476839 \tabularnewline
42 & -0.001096 & -0.0079 & 0.496862 \tabularnewline
43 & 0.008427 & 0.0608 & 0.475889 \tabularnewline
44 & 0.022696 & 0.1637 & 0.435315 \tabularnewline
45 & 0.005516 & 0.0398 & 0.484212 \tabularnewline
46 & 0.010275 & 0.0741 & 0.470609 \tabularnewline
47 & -0.004975 & -0.0359 & 0.485758 \tabularnewline
48 & -0.002008 & -0.0145 & 0.494252 \tabularnewline
\hline
\end{tabular}
%Source: https://freestatistics.org/blog/index.php?pk=114248&T=1

[TABLE]
[ROW][C]Autocorrelation Function[/C][/ROW]
[ROW][C]Time lag k[/C][C]ACF(k)[/C][C]T-STAT[/C][C]P-value[/C][/ROW]
[ROW][C]1[/C][C]0.367457[/C][C]2.6498[/C][C]0.005322[/C][/ROW]
[ROW][C]2[/C][C]0.299217[/C][C]2.1577[/C][C]0.017797[/C][/ROW]
[ROW][C]3[/C][C]0.011078[/C][C]0.0799[/C][C]0.468317[/C][/ROW]
[ROW][C]4[/C][C]-0.043743[/C][C]-0.3154[/C][C]0.376847[/C][/ROW]
[ROW][C]5[/C][C]-0.283871[/C][C]-2.047[/C][C]0.022862[/C][/ROW]
[ROW][C]6[/C][C]-0.376336[/C][C]-2.7138[/C][C]0.004501[/C][/ROW]
[ROW][C]7[/C][C]-0.268385[/C][C]-1.9353[/C][C]0.029197[/C][/ROW]
[ROW][C]8[/C][C]-0.134138[/C][C]-0.9673[/C][C]0.16894[/C][/ROW]
[ROW][C]9[/C][C]-0.135471[/C][C]-0.9769[/C][C]0.166572[/C][/ROW]
[ROW][C]10[/C][C]0.02432[/C][C]0.1754[/C][C]0.430733[/C][/ROW]
[ROW][C]11[/C][C]0.181833[/C][C]1.3112[/C][C]0.097773[/C][/ROW]
[ROW][C]12[/C][C]0.170416[/C][C]1.2289[/C][C]0.112323[/C][/ROW]
[ROW][C]13[/C][C]0.124897[/C][C]0.9006[/C][C]0.185964[/C][/ROW]
[ROW][C]14[/C][C]0.15755[/C][C]1.1361[/C][C]0.13056[/C][/ROW]
[ROW][C]15[/C][C]0.110806[/C][C]0.799[/C][C]0.213953[/C][/ROW]
[ROW][C]16[/C][C]-0.007841[/C][C]-0.0565[/C][C]0.477565[/C][/ROW]
[ROW][C]17[/C][C]-0.115031[/C][C]-0.8295[/C][C]0.205306[/C][/ROW]
[ROW][C]18[/C][C]-0.060197[/C][C]-0.4341[/C][C]0.333009[/C][/ROW]
[ROW][C]19[/C][C]-0.054157[/C][C]-0.3905[/C][C]0.348869[/C][/ROW]
[ROW][C]20[/C][C]-0.032815[/C][C]-0.2366[/C][C]0.406936[/C][/ROW]
[ROW][C]21[/C][C]0.03137[/C][C]0.2262[/C][C]0.410963[/C][/ROW]
[ROW][C]22[/C][C]0.010479[/C][C]0.0756[/C][C]0.470027[/C][/ROW]
[ROW][C]23[/C][C]0.026821[/C][C]0.1934[/C][C]0.423697[/C][/ROW]
[ROW][C]24[/C][C]-0.018982[/C][C]-0.1369[/C][C]0.445827[/C][/ROW]
[ROW][C]25[/C][C]-0.044434[/C][C]-0.3204[/C][C]0.374969[/C][/ROW]
[ROW][C]26[/C][C]4.9e-05[/C][C]4e-04[/C][C]0.499861[/C][/ROW]
[ROW][C]27[/C][C]-0.087982[/C][C]-0.6344[/C][C]0.264285[/C][/ROW]
[ROW][C]28[/C][C]-0.004565[/C][C]-0.0329[/C][C]0.486934[/C][/ROW]
[ROW][C]29[/C][C]0.038545[/C][C]0.278[/C][C]0.391076[/C][/ROW]
[ROW][C]30[/C][C]-0.049508[/C][C]-0.357[/C][C]0.361266[/C][/ROW]
[ROW][C]31[/C][C]-0.040061[/C][C]-0.2889[/C][C]0.386909[/C][/ROW]
[ROW][C]32[/C][C]-0.09737[/C][C]-0.7021[/C][C]0.242861[/C][/ROW]
[ROW][C]33[/C][C]-0.037257[/C][C]-0.2687[/C][C]0.394626[/C][/ROW]
[ROW][C]34[/C][C]-0.052998[/C][C]-0.3822[/C][C]0.351946[/C][/ROW]
[ROW][C]35[/C][C]-0.042391[/C][C]-0.3057[/C][C]0.380532[/C][/ROW]
[ROW][C]36[/C][C]-0.033562[/C][C]-0.242[/C][C]0.404858[/C][/ROW]
[ROW][C]37[/C][C]-0.009705[/C][C]-0.07[/C][C]0.472237[/C][/ROW]
[ROW][C]38[/C][C]-0.039181[/C][C]-0.2825[/C][C]0.389326[/C][/ROW]
[ROW][C]39[/C][C]-0.02278[/C][C]-0.1643[/C][C]0.435078[/C][/ROW]
[ROW][C]40[/C][C]0.016972[/C][C]0.1224[/C][C]0.451533[/C][/ROW]
[ROW][C]41[/C][C]-0.008094[/C][C]-0.0584[/C][C]0.476839[/C][/ROW]
[ROW][C]42[/C][C]-0.001096[/C][C]-0.0079[/C][C]0.496862[/C][/ROW]
[ROW][C]43[/C][C]0.008427[/C][C]0.0608[/C][C]0.475889[/C][/ROW]
[ROW][C]44[/C][C]0.022696[/C][C]0.1637[/C][C]0.435315[/C][/ROW]
[ROW][C]45[/C][C]0.005516[/C][C]0.0398[/C][C]0.484212[/C][/ROW]
[ROW][C]46[/C][C]0.010275[/C][C]0.0741[/C][C]0.470609[/C][/ROW]
[ROW][C]47[/C][C]-0.004975[/C][C]-0.0359[/C][C]0.485758[/C][/ROW]
[ROW][C]48[/C][C]-0.002008[/C][C]-0.0145[/C][C]0.494252[/C][/ROW]
[/TABLE]
Source: https://freestatistics.org/blog/index.php?pk=114248&T=1

Globally Unique Identifier (entire table): ba.freestatistics.org/blog/index.php?pk=114248&T=1

As an alternative you can also use a QR Code:  

The GUIDs for individual cells are displayed in the table below:

Autocorrelation Function
Time lag kACF(k)T-STATP-value
10.3674572.64980.005322
20.2992172.15770.017797
30.0110780.07990.468317
4-0.043743-0.31540.376847
5-0.283871-2.0470.022862
6-0.376336-2.71380.004501
7-0.268385-1.93530.029197
8-0.134138-0.96730.16894
9-0.135471-0.97690.166572
100.024320.17540.430733
110.1818331.31120.097773
120.1704161.22890.112323
130.1248970.90060.185964
140.157551.13610.13056
150.1108060.7990.213953
16-0.007841-0.05650.477565
17-0.115031-0.82950.205306
18-0.060197-0.43410.333009
19-0.054157-0.39050.348869
20-0.032815-0.23660.406936
210.031370.22620.410963
220.0104790.07560.470027
230.0268210.19340.423697
24-0.018982-0.13690.445827
25-0.044434-0.32040.374969
264.9e-054e-040.499861
27-0.087982-0.63440.264285
28-0.004565-0.03290.486934
290.0385450.2780.391076
30-0.049508-0.3570.361266
31-0.040061-0.28890.386909
32-0.09737-0.70210.242861
33-0.037257-0.26870.394626
34-0.052998-0.38220.351946
35-0.042391-0.30570.380532
36-0.033562-0.2420.404858
37-0.009705-0.070.472237
38-0.039181-0.28250.389326
39-0.02278-0.16430.435078
400.0169720.12240.451533
41-0.008094-0.05840.476839
42-0.001096-0.00790.496862
430.0084270.06080.475889
440.0226960.16370.435315
450.0055160.03980.484212
460.0102750.07410.470609
47-0.004975-0.03590.485758
48-0.002008-0.01450.494252


Partial Autocorrelation Function
Time lag kPACF(k)T-STATP-value
10.3674572.64980.005322
20.1898231.36880.088468
3-0.177202-1.27780.103494
4-0.067956-0.490.313085
5-0.250677-1.80770.038223
6-0.254061-1.83210.036336
70.0347830.25080.401469
80.0807770.58250.281377
9-0.132826-0.95780.171292
100.0396390.28580.388068
110.1332790.96110.170477
12-0.091966-0.66320.255073
13-0.038387-0.27680.39151
140.1336430.96370.169826
15-0.024568-0.17720.430033
16-0.070652-0.50950.306286
170.0076690.05530.478056
180.043160.31120.378434
190.0134750.09720.461483
200.1032840.74480.229874
210.0946960.68290.248862
22-0.160091-1.15440.1268
23-0.025114-0.18110.428495
240.0427070.3080.379669
25-0.124254-0.8960.187188
260.069710.50270.308654
270.0064380.04640.481575
28-0.015796-0.11390.454875
290.0739510.53330.298061
30-0.14605-1.05320.148563
31-0.10738-0.77430.221122
32-0.078908-0.5690.285897
33-0.002776-0.020.492053
34-0.006682-0.04820.480878
35-0.018609-0.13420.446884
36-0.061473-0.44330.329699
37-0.06313-0.45520.325417
38-0.039043-0.28150.389707
39-0.062717-0.45230.326481
400.0008250.00590.497639
41-0.040099-0.28920.386806
42-0.041617-0.30010.382646
430.0186290.13430.446828
44-0.015536-0.1120.455615
450.0139260.10040.460197
460.0780360.56270.28802
47-0.053503-0.38580.350603
48-0.031118-0.22440.411666

\begin{tabular}{lllllllll}
\hline
Partial Autocorrelation Function \tabularnewline
Time lag k & PACF(k) & T-STAT & P-value \tabularnewline
1 & 0.367457 & 2.6498 & 0.005322 \tabularnewline
2 & 0.189823 & 1.3688 & 0.088468 \tabularnewline
3 & -0.177202 & -1.2778 & 0.103494 \tabularnewline
4 & -0.067956 & -0.49 & 0.313085 \tabularnewline
5 & -0.250677 & -1.8077 & 0.038223 \tabularnewline
6 & -0.254061 & -1.8321 & 0.036336 \tabularnewline
7 & 0.034783 & 0.2508 & 0.401469 \tabularnewline
8 & 0.080777 & 0.5825 & 0.281377 \tabularnewline
9 & -0.132826 & -0.9578 & 0.171292 \tabularnewline
10 & 0.039639 & 0.2858 & 0.388068 \tabularnewline
11 & 0.133279 & 0.9611 & 0.170477 \tabularnewline
12 & -0.091966 & -0.6632 & 0.255073 \tabularnewline
13 & -0.038387 & -0.2768 & 0.39151 \tabularnewline
14 & 0.133643 & 0.9637 & 0.169826 \tabularnewline
15 & -0.024568 & -0.1772 & 0.430033 \tabularnewline
16 & -0.070652 & -0.5095 & 0.306286 \tabularnewline
17 & 0.007669 & 0.0553 & 0.478056 \tabularnewline
18 & 0.04316 & 0.3112 & 0.378434 \tabularnewline
19 & 0.013475 & 0.0972 & 0.461483 \tabularnewline
20 & 0.103284 & 0.7448 & 0.229874 \tabularnewline
21 & 0.094696 & 0.6829 & 0.248862 \tabularnewline
22 & -0.160091 & -1.1544 & 0.1268 \tabularnewline
23 & -0.025114 & -0.1811 & 0.428495 \tabularnewline
24 & 0.042707 & 0.308 & 0.379669 \tabularnewline
25 & -0.124254 & -0.896 & 0.187188 \tabularnewline
26 & 0.06971 & 0.5027 & 0.308654 \tabularnewline
27 & 0.006438 & 0.0464 & 0.481575 \tabularnewline
28 & -0.015796 & -0.1139 & 0.454875 \tabularnewline
29 & 0.073951 & 0.5333 & 0.298061 \tabularnewline
30 & -0.14605 & -1.0532 & 0.148563 \tabularnewline
31 & -0.10738 & -0.7743 & 0.221122 \tabularnewline
32 & -0.078908 & -0.569 & 0.285897 \tabularnewline
33 & -0.002776 & -0.02 & 0.492053 \tabularnewline
34 & -0.006682 & -0.0482 & 0.480878 \tabularnewline
35 & -0.018609 & -0.1342 & 0.446884 \tabularnewline
36 & -0.061473 & -0.4433 & 0.329699 \tabularnewline
37 & -0.06313 & -0.4552 & 0.325417 \tabularnewline
38 & -0.039043 & -0.2815 & 0.389707 \tabularnewline
39 & -0.062717 & -0.4523 & 0.326481 \tabularnewline
40 & 0.000825 & 0.0059 & 0.497639 \tabularnewline
41 & -0.040099 & -0.2892 & 0.386806 \tabularnewline
42 & -0.041617 & -0.3001 & 0.382646 \tabularnewline
43 & 0.018629 & 0.1343 & 0.446828 \tabularnewline
44 & -0.015536 & -0.112 & 0.455615 \tabularnewline
45 & 0.013926 & 0.1004 & 0.460197 \tabularnewline
46 & 0.078036 & 0.5627 & 0.28802 \tabularnewline
47 & -0.053503 & -0.3858 & 0.350603 \tabularnewline
48 & -0.031118 & -0.2244 & 0.411666 \tabularnewline
\hline
\end{tabular}
%Source: https://freestatistics.org/blog/index.php?pk=114248&T=2

[TABLE]
[ROW][C]Partial Autocorrelation Function[/C][/ROW]
[ROW][C]Time lag k[/C][C]PACF(k)[/C][C]T-STAT[/C][C]P-value[/C][/ROW]
[ROW][C]1[/C][C]0.367457[/C][C]2.6498[/C][C]0.005322[/C][/ROW]
[ROW][C]2[/C][C]0.189823[/C][C]1.3688[/C][C]0.088468[/C][/ROW]
[ROW][C]3[/C][C]-0.177202[/C][C]-1.2778[/C][C]0.103494[/C][/ROW]
[ROW][C]4[/C][C]-0.067956[/C][C]-0.49[/C][C]0.313085[/C][/ROW]
[ROW][C]5[/C][C]-0.250677[/C][C]-1.8077[/C][C]0.038223[/C][/ROW]
[ROW][C]6[/C][C]-0.254061[/C][C]-1.8321[/C][C]0.036336[/C][/ROW]
[ROW][C]7[/C][C]0.034783[/C][C]0.2508[/C][C]0.401469[/C][/ROW]
[ROW][C]8[/C][C]0.080777[/C][C]0.5825[/C][C]0.281377[/C][/ROW]
[ROW][C]9[/C][C]-0.132826[/C][C]-0.9578[/C][C]0.171292[/C][/ROW]
[ROW][C]10[/C][C]0.039639[/C][C]0.2858[/C][C]0.388068[/C][/ROW]
[ROW][C]11[/C][C]0.133279[/C][C]0.9611[/C][C]0.170477[/C][/ROW]
[ROW][C]12[/C][C]-0.091966[/C][C]-0.6632[/C][C]0.255073[/C][/ROW]
[ROW][C]13[/C][C]-0.038387[/C][C]-0.2768[/C][C]0.39151[/C][/ROW]
[ROW][C]14[/C][C]0.133643[/C][C]0.9637[/C][C]0.169826[/C][/ROW]
[ROW][C]15[/C][C]-0.024568[/C][C]-0.1772[/C][C]0.430033[/C][/ROW]
[ROW][C]16[/C][C]-0.070652[/C][C]-0.5095[/C][C]0.306286[/C][/ROW]
[ROW][C]17[/C][C]0.007669[/C][C]0.0553[/C][C]0.478056[/C][/ROW]
[ROW][C]18[/C][C]0.04316[/C][C]0.3112[/C][C]0.378434[/C][/ROW]
[ROW][C]19[/C][C]0.013475[/C][C]0.0972[/C][C]0.461483[/C][/ROW]
[ROW][C]20[/C][C]0.103284[/C][C]0.7448[/C][C]0.229874[/C][/ROW]
[ROW][C]21[/C][C]0.094696[/C][C]0.6829[/C][C]0.248862[/C][/ROW]
[ROW][C]22[/C][C]-0.160091[/C][C]-1.1544[/C][C]0.1268[/C][/ROW]
[ROW][C]23[/C][C]-0.025114[/C][C]-0.1811[/C][C]0.428495[/C][/ROW]
[ROW][C]24[/C][C]0.042707[/C][C]0.308[/C][C]0.379669[/C][/ROW]
[ROW][C]25[/C][C]-0.124254[/C][C]-0.896[/C][C]0.187188[/C][/ROW]
[ROW][C]26[/C][C]0.06971[/C][C]0.5027[/C][C]0.308654[/C][/ROW]
[ROW][C]27[/C][C]0.006438[/C][C]0.0464[/C][C]0.481575[/C][/ROW]
[ROW][C]28[/C][C]-0.015796[/C][C]-0.1139[/C][C]0.454875[/C][/ROW]
[ROW][C]29[/C][C]0.073951[/C][C]0.5333[/C][C]0.298061[/C][/ROW]
[ROW][C]30[/C][C]-0.14605[/C][C]-1.0532[/C][C]0.148563[/C][/ROW]
[ROW][C]31[/C][C]-0.10738[/C][C]-0.7743[/C][C]0.221122[/C][/ROW]
[ROW][C]32[/C][C]-0.078908[/C][C]-0.569[/C][C]0.285897[/C][/ROW]
[ROW][C]33[/C][C]-0.002776[/C][C]-0.02[/C][C]0.492053[/C][/ROW]
[ROW][C]34[/C][C]-0.006682[/C][C]-0.0482[/C][C]0.480878[/C][/ROW]
[ROW][C]35[/C][C]-0.018609[/C][C]-0.1342[/C][C]0.446884[/C][/ROW]
[ROW][C]36[/C][C]-0.061473[/C][C]-0.4433[/C][C]0.329699[/C][/ROW]
[ROW][C]37[/C][C]-0.06313[/C][C]-0.4552[/C][C]0.325417[/C][/ROW]
[ROW][C]38[/C][C]-0.039043[/C][C]-0.2815[/C][C]0.389707[/C][/ROW]
[ROW][C]39[/C][C]-0.062717[/C][C]-0.4523[/C][C]0.326481[/C][/ROW]
[ROW][C]40[/C][C]0.000825[/C][C]0.0059[/C][C]0.497639[/C][/ROW]
[ROW][C]41[/C][C]-0.040099[/C][C]-0.2892[/C][C]0.386806[/C][/ROW]
[ROW][C]42[/C][C]-0.041617[/C][C]-0.3001[/C][C]0.382646[/C][/ROW]
[ROW][C]43[/C][C]0.018629[/C][C]0.1343[/C][C]0.446828[/C][/ROW]
[ROW][C]44[/C][C]-0.015536[/C][C]-0.112[/C][C]0.455615[/C][/ROW]
[ROW][C]45[/C][C]0.013926[/C][C]0.1004[/C][C]0.460197[/C][/ROW]
[ROW][C]46[/C][C]0.078036[/C][C]0.5627[/C][C]0.28802[/C][/ROW]
[ROW][C]47[/C][C]-0.053503[/C][C]-0.3858[/C][C]0.350603[/C][/ROW]
[ROW][C]48[/C][C]-0.031118[/C][C]-0.2244[/C][C]0.411666[/C][/ROW]
[/TABLE]
Source: https://freestatistics.org/blog/index.php?pk=114248&T=2

Globally Unique Identifier (entire table): ba.freestatistics.org/blog/index.php?pk=114248&T=2

As an alternative you can also use a QR Code:  

The GUIDs for individual cells are displayed in the table below:

Partial Autocorrelation Function
Time lag kPACF(k)T-STATP-value
10.3674572.64980.005322
20.1898231.36880.088468
3-0.177202-1.27780.103494
4-0.067956-0.490.313085
5-0.250677-1.80770.038223
6-0.254061-1.83210.036336
70.0347830.25080.401469
80.0807770.58250.281377
9-0.132826-0.95780.171292
100.0396390.28580.388068
110.1332790.96110.170477
12-0.091966-0.66320.255073
13-0.038387-0.27680.39151
140.1336430.96370.169826
15-0.024568-0.17720.430033
16-0.070652-0.50950.306286
170.0076690.05530.478056
180.043160.31120.378434
190.0134750.09720.461483
200.1032840.74480.229874
210.0946960.68290.248862
22-0.160091-1.15440.1268
23-0.025114-0.18110.428495
240.0427070.3080.379669
25-0.124254-0.8960.187188
260.069710.50270.308654
270.0064380.04640.481575
28-0.015796-0.11390.454875
290.0739510.53330.298061
30-0.14605-1.05320.148563
31-0.10738-0.77430.221122
32-0.078908-0.5690.285897
33-0.002776-0.020.492053
34-0.006682-0.04820.480878
35-0.018609-0.13420.446884
36-0.061473-0.44330.329699
37-0.06313-0.45520.325417
38-0.039043-0.28150.389707
39-0.062717-0.45230.326481
400.0008250.00590.497639
41-0.040099-0.28920.386806
42-0.041617-0.30010.382646
430.0186290.13430.446828
44-0.015536-0.1120.455615
450.0139260.10040.460197
460.0780360.56270.28802
47-0.053503-0.38580.350603
48-0.031118-0.22440.411666


Parameters (Session):
Parameters (R input):
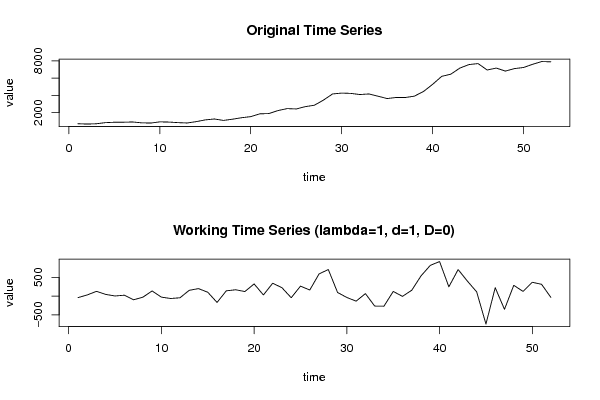
par1 = 48 ; par2 = 1 ; par3 = 1 ; par4 = 0 ; par5 = 1 ; par6 = White Noise ; par7 = 0.95 ; par8 = ;
R code (references can be found in the software module):
if (par1 == 'Default') {
par1 = 10*log10(length(x))
} else {
par1 <- as.numeric(par1)
}
par2 <- as.numeric(par2)
par3 <- as.numeric(par3)
par4 <- as.numeric(par4)
par5 <- as.numeric(par5)
if (par6 == 'White Noise') par6 <- 'white' else par6 <- 'ma'
par7 <- as.numeric(par7)
if (par8 != '') par8 <- as.numeric(par8)
ox <- x
if (par8 == '') {
if (par2 == 0) {
x <- log(x)
} else {
x <- (x ^ par2 - 1) / par2
}
} else {
x <- log(x,base=par8)
}
if (par3 > 0) x <- diff(x,lag=1,difference=par3)
if (par4 > 0) x <- diff(x,lag=par5,difference=par4)
bitmap(file='picts.png')
op <- par(mfrow=c(2,1))
plot(ox,type='l',main='Original Time Series',xlab='time',ylab='value')
if (par8=='') {
mytitle <- paste('Working Time Series (lambda=',par2,', d=',par3,', D=',par4,')',sep='')
mysub <- paste('(lambda=',par2,', d=',par3,', D=',par4,', CI=', par7, ', CI type=',par6,')',sep='')
} else {
mytitle <- paste('Working Time Series (base=',par8,', d=',par3,', D=',par4,')',sep='')
mysub <- paste('(base=',par8,', d=',par3,', D=',par4,', CI=', par7, ', CI type=',par6,')',sep='')
}
plot(x,type='l', main=mytitle,xlab='time',ylab='value')
par(op)
dev.off()
bitmap(file='pic1.png')
racf <- acf(x, par1, main='Autocorrelation', xlab='time lag', ylab='ACF', ci.type=par6, ci=par7, sub=mysub)
dev.off()
bitmap(file='pic2.png')
rpacf <- pacf(x,par1,main='Partial Autocorrelation',xlab='lags',ylab='PACF',sub=mysub)
dev.off()
(myacf <- c(racf$acf))
(mypacf <- c(rpacf$acf))
lengthx <- length(x)
sqrtn <- sqrt(lengthx)
load(file='createtable')
a<-table.start()
a<-table.row.start(a)
a<-table.element(a,'Autocorrelation Function',4,TRUE)
a<-table.row.end(a)
a<-table.row.start(a)
a<-table.element(a,'Time lag k',header=TRUE)
a<-table.element(a,hyperlink('basics.htm','ACF(k)','click here for more information about the Autocorrelation Function'),header=TRUE)
a<-table.element(a,'T-STAT',header=TRUE)
a<-table.element(a,'P-value',header=TRUE)
a<-table.row.end(a)
for (i in 2:(par1+1)) {
a<-table.row.start(a)
a<-table.element(a,i-1,header=TRUE)
a<-table.element(a,round(myacf[i],6))
mytstat <- myacf[i]*sqrtn
a<-table.element(a,round(mytstat,4))
a<-table.element(a,round(1-pt(abs(mytstat),lengthx),6))
a<-table.row.end(a)
}
a<-table.end(a)
table.save(a,file='mytable.tab')
a<-table.start()
a<-table.row.start(a)
a<-table.element(a,'Partial Autocorrelation Function',4,TRUE)
a<-table.row.end(a)
a<-table.row.start(a)
a<-table.element(a,'Time lag k',header=TRUE)
a<-table.element(a,hyperlink('basics.htm','PACF(k)','click here for more information about the Partial Autocorrelation Function'),header=TRUE)
a<-table.element(a,'T-STAT',header=TRUE)
a<-table.element(a,'P-value',header=TRUE)
a<-table.row.end(a)
for (i in 1:par1) {
a<-table.row.start(a)
a<-table.element(a,i,header=TRUE)
a<-table.element(a,round(mypacf[i],6))
mytstat <- mypacf[i]*sqrtn
a<-table.element(a,round(mytstat,4))
a<-table.element(a,round(1-pt(abs(mytstat),lengthx),6))
a<-table.row.end(a)
}
a<-table.end(a)
table.save(a,file='mytable1.tab')