| Multiple Linear Regression - Estimated Regression Equation |
| PS[t] = + 1.07450670640377 -0.003035386100425`log(tg)`[t] -0.110510450692137D[t] + e[t] |
| Multiple Linear Regression - Ordinary Least Squares | |||||
| Variable | Parameter | S.D. | T-STAT H0: parameter = 0 | 2-tail p-value | 1-tail p-value |
| (Intercept) | 1.07450670640377 | 0.128751 | 8.3456 | 0 | 0 |
| `log(tg)` | -0.003035386100425 | 0.000689 | -4.4052 | 9.1e-05 | 4.5e-05 |
| D | -0.110510450692137 | 0.022191 | -4.98 | 1.6e-05 | 8e-06 |
| Multiple Linear Regression - Regression Statistics | |
| Multiple R | 0.809091318764362 |
| R-squared | 0.654628762099855 |
| Adjusted R-squared | 0.635441471105403 |
| F-TEST (value) | 34.1178315526212 |
| F-TEST (DF numerator) | 2 |
| F-TEST (DF denominator) | 36 |
| p-value | 4.88822304856029e-09 |
| Multiple Linear Regression - Residual Statistics | |
| Residual Standard Deviation | 0.181764165893359 |
| Sum Squared Residuals | 1.1893756321047 |
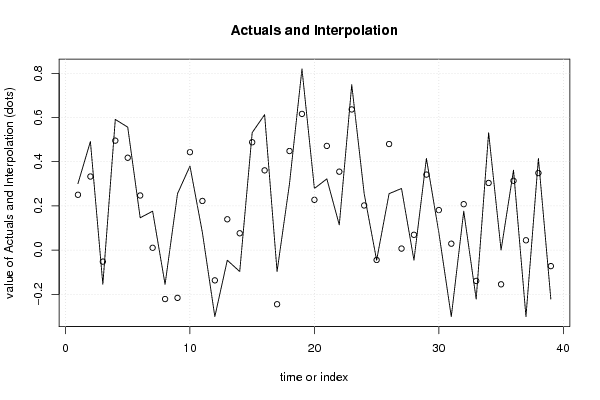
| Multiple Linear Regression - Actuals, Interpolation, and Residuals | |||
| Time or Index | Actuals | Interpolation Forecast | Residuals Prediction Error |
| 1 | 0.301029996 | 0.250256305575874 | 0.0507736904241262 |
| 2 | 0.491361694 | 0.332884848483471 | 0.158476845516529 |
| 3 | -0.15490196 | -0.0520966174353253 | -0.102805342564675 |
| 4 | 0.591064607 | 0.495311394103313 | 0.095753212896687 |
| 5 | 0.556302501 | 0.417827093117764 | 0.138475407882236 |
| 6 | 0.146128036 | 0.247120014215963 | -0.100991978215963 |
| 7 | 0.176091259 | 0.0104475131639319 | 0.165643745836068 |
| 8 | -0.15490196 | -0.221323576854084 | 0.0664216168540838 |
| 9 | 0.255272505 | -0.215980148383371 | 0.471252653383371 |
| 10 | 0.380211242 | 0.443124000878706 | -0.062912758878706 |
| 11 | 0.079181246 | 0.222374397791333 | -0.143193151791333 |
| 12 | -0.301029996 | -0.13680325088775 | -0.16422674511225 |
| 13 | -0.045757491 | 0.139508357249731 | -0.185265848249731 |
| 14 | -0.096910013 | 0.076227365346242 | -0.173137378346242 |
| 15 | 0.531478917 | 0.487988893895123 | 0.0434900231048766 |
| 16 | 0.612783857 | 0.360766756268011 | 0.25201710073199 |
| 17 | -0.096910013 | -0.244887279151683 | 0.147977266151683 |
| 18 | 0.301029996 | 0.44829326340773 | -0.14726326740773 |
| 19 | 0.819543936 | 0.616101548583625 | 0.203442387416375 |
| 20 | 0.278753601 | 0.227456783057409 | 0.0512968179425906 |
| 21 | 0.322219295 | 0.471277206960148 | -0.149057911960148 |
| 22 | 0.113943352 | 0.354825356735514 | -0.240882004735514 |
| 23 | 0.748188027 | 0.63642345852597 | 0.111764568474029 |
| 24 | 0.255272505 | 0.202052487848988 | 0.0532200171510118 |
| 25 | -0.045757491 | -0.0445627891340702 | -0.00119470186592975 |
| 26 | 0.255272505 | 0.479996722292704 | -0.224724217292704 |
| 27 | 0.278753601 | 0.00696288992064403 | 0.271790711079356 |
| 28 | -0.045757491 | 0.0692691114701035 | -0.115026602470103 |
| 29 | 0.414973348 | 0.341630533356967 | 0.0733428146430333 |
| 30 | 0.079181246 | 0.181196349952968 | -0.102015103952968 |
| 31 | -0.301029996 | 0.0289979065575937 | -0.330027902557594 |
| 32 | 0.176091259 | 0.207772304196153 | -0.0316810451961534 |
| 33 | -0.22184875 | -0.13945010756732 | -0.0823986424326797 |
| 34 | 0.531478917 | 0.303706419418257 | 0.227772497581743 |
| 35 | 0 | -0.154698738401891 | 0.154698738401891 |
| 36 | 0.361727836 | 0.313748625572427 | 0.0479792104275728 |
| 37 | -0.301029996 | 0.0445239064612675 | -0.345553902461267 |
| 38 | 0.414973348 | 0.348773945785231 | 0.0661994022147687 |
| 39 | -0.22184875 | -0.0724185273776706 | -0.149430222622329 |
| Goldfeld-Quandt test for Heteroskedasticity | |||
| p-values | Alternative Hypothesis | ||
| breakpoint index | greater | 2-sided | less |
| 6 | 0.126093090452611 | 0.252186180905223 | 0.873906909547389 |
| 7 | 0.182770644972334 | 0.365541289944667 | 0.817229355027666 |
| 8 | 0.113490130854106 | 0.226980261708212 | 0.886509869145894 |
| 9 | 0.648844149526556 | 0.702311700946887 | 0.351155850473444 |
| 10 | 0.556868125064445 | 0.88626374987111 | 0.443131874935555 |
| 11 | 0.574489960132378 | 0.851020079735243 | 0.425510039867622 |
| 12 | 0.603516385519951 | 0.792967228960098 | 0.396483614480049 |
| 13 | 0.65173405869358 | 0.696531882612841 | 0.348265941306421 |
| 14 | 0.620195628202534 | 0.759608743594932 | 0.379804371797466 |
| 15 | 0.541216674081091 | 0.917566651837818 | 0.458783325918909 |
| 16 | 0.616874986434096 | 0.766250027131808 | 0.383125013565904 |
| 17 | 0.578069788192396 | 0.843860423615208 | 0.421930211807604 |
| 18 | 0.542182933124469 | 0.915634133751062 | 0.457817066875531 |
| 19 | 0.555601903729981 | 0.888796192540038 | 0.444398096270019 |
| 20 | 0.471903090907946 | 0.943806181815892 | 0.528096909092054 |
| 21 | 0.431446347197001 | 0.862892694394003 | 0.568553652802999 |
| 22 | 0.497725901713171 | 0.995451803426342 | 0.502274098286829 |
| 23 | 0.429611119893234 | 0.859222239786469 | 0.570388880106766 |
| 24 | 0.350233909768944 | 0.700467819537887 | 0.649766090231056 |
| 25 | 0.262274836896263 | 0.524549673792525 | 0.737725163103737 |
| 26 | 0.329936577504114 | 0.659873155008229 | 0.670063422495886 |
| 27 | 0.515679807494474 | 0.968640385011053 | 0.484320192505526 |
| 28 | 0.467516609763114 | 0.935033219526228 | 0.532483390236886 |
| 29 | 0.367169165211152 | 0.734338330422304 | 0.632830834788848 |
| 30 | 0.271749259150248 | 0.543498518300495 | 0.728250740849752 |
| 31 | 0.390286463372514 | 0.780572926745028 | 0.609713536627486 |
| 32 | 0.282116520794539 | 0.564233041589077 | 0.717883479205461 |
| 33 | 0.210961785050195 | 0.42192357010039 | 0.789038214949805 |
| Meta Analysis of Goldfeld-Quandt test for Heteroskedasticity | |||
| Description | # significant tests | % significant tests | OK/NOK |
| 1% type I error level | 0 | 0 | OK |
| 5% type I error level | 0 | 0 | OK |
| 10% type I error level | 0 | 0 | OK |