| Multiple Linear Regression - Estimated Regression Equation |
| CVI[t] = + 0.130074320935853 + 0.252862994160068EconSit[t] -0.252878563273482Werkloos[t] + 0.268135621609646FinSit[t] + 0.224848607252311`Sparen `[t] + e[t] |
| Multiple Linear Regression - Ordinary Least Squares | |||||
| Variable | Parameter | S.D. | T-STAT H0: parameter = 0 | 2-tail p-value | 1-tail p-value |
| (Intercept) | 0.130074320935853 | 0.117933 | 1.103 | 0.274851 | 0.137425 |
| EconSit | 0.252862994160068 | 0.00631 | 40.0754 | 0 | 0 |
| Werkloos | -0.252878563273482 | 0.001989 | -127.1389 | 0 | 0 |
| FinSit | 0.268135621609646 | 0.033069 | 8.1084 | 0 | 0 |
| `Sparen ` | 0.224848607252311 | 0.015009 | 14.981 | 0 | 0 |
| Multiple Linear Regression - Regression Statistics | |
| Multiple R | 0.999189462068346 |
| R-squared | 0.99837958110843 |
| Adjusted R-squared | 0.998261732461772 |
| F-TEST (value) | 8471.71019275742 |
| F-TEST (DF numerator) | 4 |
| F-TEST (DF denominator) | 55 |
| p-value | 0 |
| Multiple Linear Regression - Residual Statistics | |
| Residual Standard Deviation | 0.311004478600877 |
| Sum Squared Residuals | 5.31980821403917 |
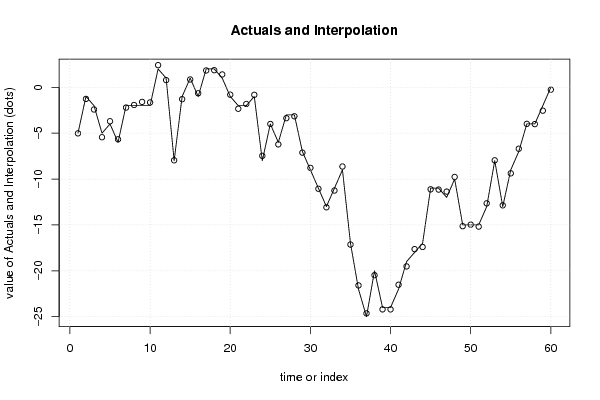
| Multiple Linear Regression - Actuals, Interpolation, and Residuals | |||
| Time or Index | Actuals | Interpolation Forecast | Residuals Prediction Error |
| 1 | -5 | -5.01868901521657 | 0.0186890152165668 |
| 2 | -1 | -1.26636012716076 | 0.266360127160759 |
| 3 | -2 | -2.41861755033006 | 0.418617550330064 |
| 4 | -5 | -5.4403407045866 | 0.440340704586605 |
| 5 | -4 | -3.6982207176934 | -0.301779282306598 |
| 6 | -6 | -5.66767347249007 | -0.332326527509928 |
| 7 | -2 | -2.20904157052734 | 0.209041570527336 |
| 8 | -2 | -1.92817975857292 | -0.0718202414270764 |
| 9 | -2 | -1.59113348166886 | -0.408866518331139 |
| 10 | -2 | -1.64970869258919 | -0.350291307410813 |
| 11 | 2 | 2.41399612409336 | -0.413996124093363 |
| 12 | 1 | 0.784011530398259 | 0.215988469601741 |
| 13 | -8 | -7.95635343963642 | -0.0436465603635842 |
| 14 | -1 | -1.2950301804917 | 0.295030180491698 |
| 15 | 1 | 0.853484437435377 | 0.146515562564623 |
| 16 | -1 | -0.650967337180266 | -0.349032662819734 |
| 17 | 2 | 1.83629749897154 | 0.163702501028463 |
| 18 | 2 | 1.86496755230248 | 0.135032447697522 |
| 19 | 1 | 1.39999771034828 | -0.399997710348279 |
| 20 | -1 | -0.80702984204547 | -0.192970157954531 |
| 21 | -2 | -2.33940258888839 | 0.339402588888389 |
| 22 | -2 | -1.81838840400526 | -0.181611595994739 |
| 23 | -1 | -0.82214677836091 | -0.17785322163909 |
| 24 | -8 | -7.47119711510967 | -0.528802884890334 |
| 25 | -4 | -3.99982345368875 | -0.00017654631124835 |
| 26 | -6 | -6.22212363353208 | 0.222123633532077 |
| 27 | -3 | -3.36672058294777 | 0.366720582947768 |
| 28 | -3 | -3.1596443329096 | 0.159644332909603 |
| 29 | -7 | -7.12153363165473 | 0.121533631654732 |
| 30 | -9 | -8.778861376721 | -0.221138623279003 |
| 31 | -11 | -11.0596589219176 | 0.0596589219175801 |
| 32 | -13 | -13.080156560114 | 0.0801565601140388 |
| 33 | -11 | -11.2516182356403 | 0.251618235640302 |
| 34 | -9 | -8.6356807533347 | -0.364319246665302 |
| 35 | -17 | -17.1416107528466 | 0.141610752846634 |
| 36 | -22 | -21.5940779653696 | -0.405922034630368 |
| 37 | -25 | -24.6438310756473 | -0.356168924352662 |
| 38 | -20 | -20.4802170808224 | 0.48021708082241 |
| 39 | -24 | -24.2044693055168 | 0.204469305516808 |
| 40 | -24 | -24.2069690352814 | 0.206969035281379 |
| 41 | -22 | -21.5204636637009 | -0.47953633629907 |
| 42 | -19 | -19.5230276602233 | 0.523027660223331 |
| 43 | -18 | -17.6401800723682 | -0.359819927631842 |
| 44 | -17 | -17.4050582971954 | 0.405058297195412 |
| 45 | -11 | -11.1215841686609 | 0.121584168660938 |
| 46 | -11 | -11.1495985555687 | 0.149598555568694 |
| 47 | -12 | -11.3719162948296 | -0.628083705170392 |
| 48 | -10 | -9.7706640309191 | -0.229335969080901 |
| 49 | -15 | -15.1395022412216 | 0.13950224122158 |
| 50 | -15 | -14.9706824077848 | -0.0293175922152171 |
| 51 | -15 | -15.1827736864655 | 0.182773686465501 |
| 52 | -13 | -12.6515506004198 | -0.348449399580232 |
| 53 | -8 | -7.95968009607172 | -0.0403199039282814 |
| 54 | -13 | -12.8659859177309 | -0.134014082269082 |
| 55 | -9 | -9.37929292152018 | 0.379292921520184 |
| 56 | -7 | -6.69770916390181 | -0.302290836098189 |
| 57 | -4 | -3.9849244849611 | -0.0150755150388999 |
| 58 | -4 | -4.01289216452862 | 0.0128921645286169 |
| 59 | -2 | -2.54919653627891 | 0.549196536278911 |
| 60 | 0 | -0.260594414699635 | 0.260594414699635 |
| Goldfeld-Quandt test for Heteroskedasticity | |||
| p-values | Alternative Hypothesis | ||
| breakpoint index | greater | 2-sided | less |
| 8 | 0.549861111267784 | 0.900277777464432 | 0.450138888732216 |
| 9 | 0.455771359386105 | 0.91154271877221 | 0.544228640613895 |
| 10 | 0.453215841281762 | 0.906431682563524 | 0.546784158718238 |
| 11 | 0.432268954272629 | 0.864537908545258 | 0.567731045727371 |
| 12 | 0.417430944780833 | 0.834861889561665 | 0.582569055219167 |
| 13 | 0.390084748835817 | 0.780169497671633 | 0.609915251164183 |
| 14 | 0.321947222340155 | 0.64389444468031 | 0.678052777659845 |
| 15 | 0.336953888855423 | 0.673907777710846 | 0.663046111144577 |
| 16 | 0.263872591733422 | 0.527745183466845 | 0.736127408266578 |
| 17 | 0.239943765185825 | 0.47988753037165 | 0.760056234814175 |
| 18 | 0.207706422622355 | 0.41541284524471 | 0.792293577377645 |
| 19 | 0.189436749390779 | 0.378873498781559 | 0.81056325060922 |
| 20 | 0.158186220997399 | 0.316372441994797 | 0.841813779002601 |
| 21 | 0.391521506551332 | 0.783043013102664 | 0.608478493448668 |
| 22 | 0.342675088786893 | 0.685350177573786 | 0.657324911213107 |
| 23 | 0.280947935617974 | 0.561895871235949 | 0.719052064382026 |
| 24 | 0.318197021780682 | 0.636394043561365 | 0.681802978219318 |
| 25 | 0.303603176167946 | 0.607206352335893 | 0.696396823832054 |
| 26 | 0.389628268253707 | 0.779256536507414 | 0.610371731746293 |
| 27 | 0.399546224415517 | 0.799092448831034 | 0.600453775584483 |
| 28 | 0.382501639933937 | 0.765003279867874 | 0.617498360066063 |
| 29 | 0.328101144554625 | 0.656202289109249 | 0.671898855445375 |
| 30 | 0.28480268718677 | 0.56960537437354 | 0.71519731281323 |
| 31 | 0.246374358215479 | 0.492748716430959 | 0.75362564178452 |
| 32 | 0.188999021897585 | 0.37799804379517 | 0.811000978102415 |
| 33 | 0.169523129767837 | 0.339046259535674 | 0.830476870232163 |
| 34 | 0.233083026277128 | 0.466166052554257 | 0.766916973722872 |
| 35 | 0.177881571498902 | 0.355763142997804 | 0.822118428501098 |
| 36 | 0.235651493782901 | 0.471302987565802 | 0.764348506217099 |
| 37 | 0.288741552098209 | 0.577483104196418 | 0.711258447901791 |
| 38 | 0.345022801618083 | 0.690045603236165 | 0.654977198381917 |
| 39 | 0.275566989838129 | 0.551133979676259 | 0.72443301016187 |
| 40 | 0.216740076767327 | 0.433480153534654 | 0.783259923232673 |
| 41 | 0.311338309609321 | 0.622676619218642 | 0.688661690390679 |
| 42 | 0.691661291072412 | 0.616677417855176 | 0.308338708927588 |
| 43 | 0.633164567573825 | 0.73367086485235 | 0.366835432426175 |
| 44 | 0.703063744178288 | 0.593872511643423 | 0.296936255821712 |
| 45 | 0.620466628606177 | 0.759066742787646 | 0.379533371393823 |
| 46 | 0.531327195447518 | 0.937345609104964 | 0.468672804552482 |
| 47 | 0.864694114103274 | 0.270611771793451 | 0.135305885896726 |
| 48 | 0.797558235550036 | 0.404883528899928 | 0.202441764449964 |
| 49 | 0.773937072451338 | 0.452125855097324 | 0.226062927548662 |
| 50 | 0.662251360338236 | 0.675497279323527 | 0.337748639661764 |
| 51 | 0.899409450994253 | 0.201181098011494 | 0.100590549005747 |
| 52 | 0.993149177483076 | 0.0137016450338476 | 0.00685082251692381 |
| Meta Analysis of Goldfeld-Quandt test for Heteroskedasticity | |||
| Description | # significant tests | % significant tests | OK/NOK |
| 1% type I error level | 0 | 0 | OK |
| 5% type I error level | 1 | 0.0222222222222222 | OK |
| 10% type I error level | 1 | 0.0222222222222222 | OK |