| Multiple Linear Regression - Estimated Regression Equation |
| SWS[t] = + 11.6991087210001 -1.81485814734191`log(wb)`[t] -0.80621691930904D[t] + e[t] |
| Multiple Linear Regression - Ordinary Least Squares | |||||
| Variable | Parameter | S.D. | T-STAT H0: parameter = 0 | 2-tail p-value | 1-tail p-value |
| (Intercept) | 11.6991087210001 | 0.941095 | 12.4314 | 0 | 0 |
| `log(wb)` | -1.81485814734191 | 0.37295 | -4.8662 | 2.3e-05 | 1.1e-05 |
| D | -0.80621691930904 | 0.336956 | -2.3927 | 0.022068 | 0.011034 |
| Multiple Linear Regression - Regression Statistics | |
| Multiple R | 0.757704457897525 |
| R-squared | 0.574116045517782 |
| Adjusted R-squared | 0.550455825824325 |
| F-TEST (value) | 24.2650344314664 |
| F-TEST (DF numerator) | 2 |
| F-TEST (DF denominator) | 36 |
| p-value | 2.12443282854302e-07 |
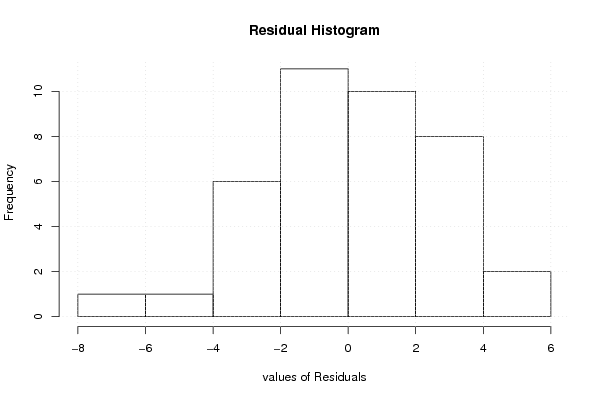
| Multiple Linear Regression - Residual Statistics | |
| Residual Standard Deviation | 2.66067288469349 |
| Sum Squared Residuals | 254.850487176355 |
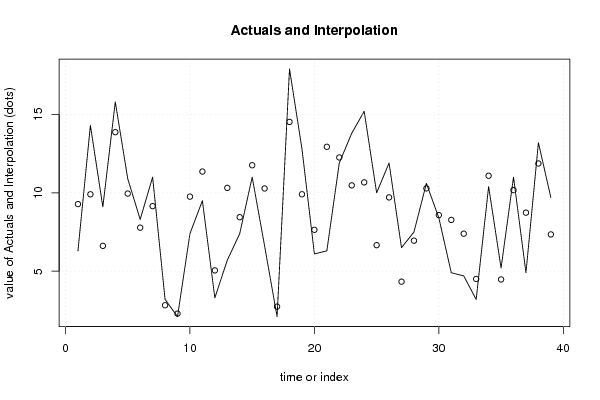
| Multiple Linear Regression - Actuals, Interpolation, and Residuals | |||
| Time or Index | Actuals | Interpolation Forecast | Residuals Prediction Error |
| 1 | 6.3 | 9.28045796307299 | -2.98045796307299 |
| 2 | 14.3 | 9.90548547932928 | 4.39451452067072 |
| 3 | 9.1 | 6.61718297994529 | 2.48281702005471 |
| 4 | 15.8 | 13.8661233860899 | 1.93387661391007 |
| 5 | 10.9 | 9.9518625531717 | 0.94813744682829 |
| 6 | 8.3 | 7.77616769744705 | 0.523832302552955 |
| 7 | 11 | 9.14866242179589 | 1.85133757820411 |
| 8 | 3.2 | 2.82697540005161 | 0.373024599948394 |
| 9 | 2.1 | 2.29278166284831 | -0.192781662848311 |
| 10 | 7.4 | 9.75524177428921 | -2.35524177428921 |
| 11 | 9.5 | 11.3552062888890 | -1.85520628888904 |
| 12 | 3.3 | 5.05126695557864 | -1.75126695557864 |
| 13 | 5.7 | 10.3134209671451 | -4.61342096714508 |
| 14 | 7.4 | 8.44332794970336 | -1.04332794970336 |
| 15 | 11 | 11.7578303003042 | -0.757830300304155 |
| 16 | 6.6 | 10.2774715419084 | -3.67747154190843 |
| 17 | 2.1 | 2.7373490478625 | -0.6373490478625 |
| 18 | 17.9 | 14.5226080963749 | 3.37739190362511 |
| 19 | 12.8 | 9.90548547932929 | 2.89451452067071 |
| 20 | 6.1 | 7.63995514168148 | -1.53995514168148 |
| 21 | 6.3 | 12.9344960337960 | -6.63449603379604 |
| 22 | 11.9 | 12.2536895474719 | -0.353689547471852 |
| 23 | 13.8 | 10.4746596998681 | 3.32534030013194 |
| 24 | 15.2 | 10.6651768204492 | 4.53482317955079 |
| 25 | 10 | 6.65938289642203 | 3.34061710357797 |
| 26 | 11.9 | 9.70643485041881 | 2.19356514958119 |
| 27 | 6.5 | 4.33037320547749 | 2.16962679452251 |
| 28 | 7.5 | 6.94581945696794 | 0.554180543032061 |
| 29 | 10.6 | 10.2837877147052 | 0.316212285294819 |
| 30 | 8.4 | 8.57578929888921 | -0.175789298889214 |
| 31 | 4.9 | 8.27084783674645 | -3.37084783674645 |
| 32 | 4.7 | 7.39127014420428 | -2.69127014420428 |
| 33 | 3.2 | 4.50237979290602 | -1.30237979290602 |
| 34 | 10.4 | 11.0874734296033 | -0.687473429603286 |
| 35 | 5.2 | 4.47407593489727 | 0.725924065102726 |
| 36 | 11 | 10.1697182377253 | 0.8302817622747 |
| 37 | 4.9 | 8.73413122223808 | -3.83413122223808 |
| 38 | 13.2 | 11.8706199356634 | 1.32938006433665 |
| 39 | 9.7 | 7.345010854732 | 2.35498914526799 |
| Goldfeld-Quandt test for Heteroskedasticity | |||
| p-values | Alternative Hypothesis | ||
| breakpoint index | greater | 2-sided | less |
| 6 | 0.712187317271278 | 0.575625365457443 | 0.287812682728722 |
| 7 | 0.596031172984503 | 0.807937654030995 | 0.403968827015497 |
| 8 | 0.443469083852791 | 0.886938167705582 | 0.556530916147209 |
| 9 | 0.314913513837011 | 0.629827027674022 | 0.685086486162989 |
| 10 | 0.383692779738502 | 0.767385559477005 | 0.616307220261498 |
| 11 | 0.363931831610967 | 0.727863663221935 | 0.636068168389033 |
| 12 | 0.302725560090153 | 0.605451120180306 | 0.697274439909847 |
| 13 | 0.506416030895124 | 0.987167938209751 | 0.493583969104876 |
| 14 | 0.40759565058882 | 0.81519130117764 | 0.59240434941118 |
| 15 | 0.31203306600729 | 0.62406613201458 | 0.68796693399271 |
| 16 | 0.372820354312307 | 0.745640708624614 | 0.627179645687693 |
| 17 | 0.283998062732427 | 0.567996125464854 | 0.716001937267573 |
| 18 | 0.346617301558219 | 0.693234603116437 | 0.653382698441781 |
| 19 | 0.355475504163258 | 0.710951008326516 | 0.644524495836742 |
| 20 | 0.295695785358704 | 0.591391570717408 | 0.704304214641296 |
| 21 | 0.73928158571412 | 0.521436828571761 | 0.260718414285881 |
| 22 | 0.665948284357399 | 0.668103431285202 | 0.334051715642601 |
| 23 | 0.697427813259401 | 0.605144373481199 | 0.302572186740599 |
| 24 | 0.841280365175721 | 0.317439269648557 | 0.158719634824279 |
| 25 | 0.87113482885487 | 0.257730342290258 | 0.128865171145129 |
| 26 | 0.874577049769459 | 0.250845900461083 | 0.125422950230541 |
| 27 | 0.881125657518662 | 0.237748684962677 | 0.118874342481338 |
| 28 | 0.809434321670801 | 0.381131356658398 | 0.190565678329199 |
| 29 | 0.712547243316935 | 0.574905513366129 | 0.287452756683065 |
| 30 | 0.606569034072032 | 0.786861931855936 | 0.393430965927968 |
| 31 | 0.632457155873452 | 0.735085688253096 | 0.367542844126548 |
| 32 | 0.542013859135083 | 0.915972281729833 | 0.457986140864917 |
| 33 | 0.401089266390941 | 0.802178532781883 | 0.598910733609059 |
| Meta Analysis of Goldfeld-Quandt test for Heteroskedasticity | |||
| Description | # significant tests | % significant tests | OK/NOK |
| 1% type I error level | 0 | 0 | OK |
| 5% type I error level | 0 | 0 | OK |
| 10% type I error level | 0 | 0 | OK |