Free Statistics

of Irreproducible Research!

Author's title

Author*The author of this computation has been verified*
R Software Modulerwasp_autocorrelation.wasp
Title produced by software(Partial) Autocorrelation Function
Date of computationTue, 21 Dec 2010 18:37:03 +0000
Cite this page as followsStatistical Computations at FreeStatistics.org, Office for Research Development and Education, URL https://freestatistics.org/blog/index.php?v=date/2010/Dec/21/t129295650680dnf5v253it0cy.htm/, Retrieved Sun, 19 May 2024 18:05:08 +0000
Statistical Computations at FreeStatistics.org, Office for Research Development and Education, URL https://freestatistics.org/blog/index.php?pk=113816, Retrieved Sun, 19 May 2024 18:05:08 +0000
QR Codes:

Original text written by user:
IsPrivate?No (this computation is public)
User-defined keywords
Estimated Impact107
Family? (F = Feedback message, R = changed R code, M = changed R Module, P = changed Parameters, D = changed Data)
-       [(Partial) Autocorrelation Function] [ACF - D=1 d=0 (ASO)] [2010-12-21 18:37:03] [194b0dcd1d575718d8c1582a0112d12c] [Current]
Feedback Forum

Post a new message
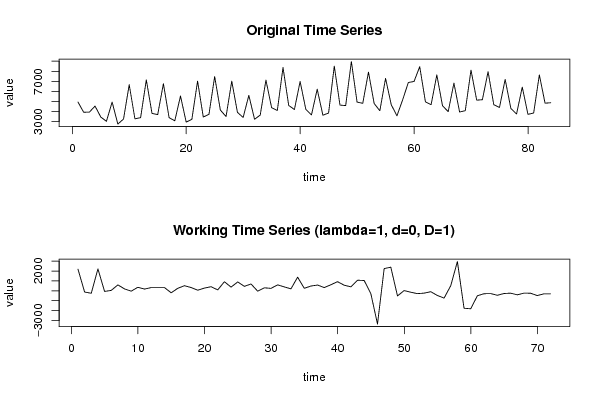
Dataseries X:
4940
3924
3927
4535
3446
3016
4934
2743
3242
6662
3262
3381
7144
3803
3684
6759
3386
3066
5538
2940
3215
7023
3443
3712
7475
4137
3491
7019
3908
3402
5604
3222
3636
7123
4368
4092
8377
4595
4188
6988
4218
3655
6211
3622
3841
8510
4627
4582
8967
4928
4809
7917
4790
4065
7290
4670
3561
5149
6880
6981
8454
4960
4670
7638
4560
3980
6825
3939
4079
8117
5121
5167
7960
4670
4397
7191
4293
3747
6425
3709
3840
7642
4821
4865


Summary of computational transaction
Raw Inputview raw input (R code)
Raw Outputview raw output of R engine
Computing time2 seconds
R Server'Gwilym Jenkins' @ 72.249.127.135

\begin{tabular}{lllllllll}
\hline
Summary of computational transaction \tabularnewline
Raw Input & view raw input (R code)  \tabularnewline
Raw Output & view raw output of R engine  \tabularnewline
Computing time & 2 seconds \tabularnewline
R Server & 'Gwilym Jenkins' @ 72.249.127.135 \tabularnewline
\hline
\end{tabular}
%Source: https://freestatistics.org/blog/index.php?pk=113816&T=0

[TABLE]
[ROW][C]Summary of computational transaction[/C][/ROW]
[ROW][C]Raw Input[/C][C]view raw input (R code) [/C][/ROW]
[ROW][C]Raw Output[/C][C]view raw output of R engine [/C][/ROW]
[ROW][C]Computing time[/C][C]2 seconds[/C][/ROW]
[ROW][C]R Server[/C][C]'Gwilym Jenkins' @ 72.249.127.135[/C][/ROW]
[/TABLE]
Source: https://freestatistics.org/blog/index.php?pk=113816&T=0

Globally Unique Identifier (entire table): ba.freestatistics.org/blog/index.php?pk=113816&T=0

As an alternative you can also use a QR Code:  

The GUIDs for individual cells are displayed in the table below:

Summary of computational transaction
Raw Inputview raw input (R code)
Raw Outputview raw output of R engine
Computing time2 seconds
R Server'Gwilym Jenkins' @ 72.249.127.135


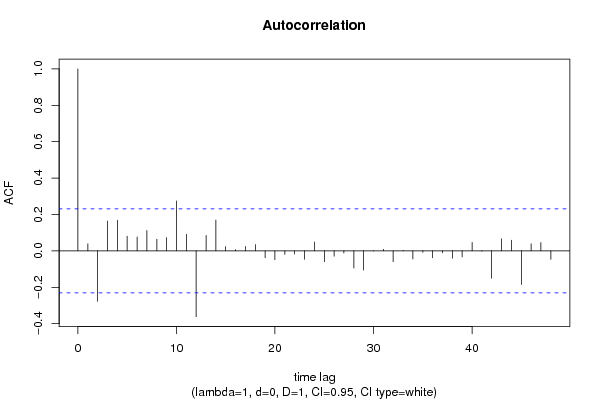
Autocorrelation Function
Time lag kACF(k)T-STATP-value
10.0387540.32880.371616
2-0.276967-2.35010.010755
30.1638991.39070.084296
40.1686261.43080.078401
50.0807130.68490.247812
60.0764720.64890.259239
70.1114650.94580.173703
80.0639390.54250.294562
90.0730490.61980.268659
100.2747742.33150.011264
110.0920420.7810.21868
12-0.361597-3.06830.001517
130.0849720.7210.236619
140.169441.43770.07742
150.0238790.20260.420001
160.0070060.05950.476379
170.0243950.2070.418298
180.0345760.29340.385036
19-0.037349-0.31690.376112
20-0.049349-0.41870.338325
21-0.019517-0.16560.434466
22-0.017802-0.15110.440179
23-0.046089-0.39110.348446
240.0484840.41140.341002
25-0.059617-0.50590.307248
26-0.029038-0.24640.40304
27-0.012385-0.10510.458298
28-0.094668-0.80330.212226
29-0.105192-0.89260.187526
30-6.9e-05-6e-040.499767
310.0089170.07570.469949
32-0.059379-0.50380.307954
330.0026150.02220.491178
34-0.044687-0.37920.352835
35-0.007954-0.06750.473188
36-0.038029-0.32270.373933
37-0.010933-0.09280.463171
38-0.040316-0.34210.36664
39-0.033285-0.28240.38921
400.0463170.3930.347737
41-0.001845-0.01570.493776
42-0.150451-1.27660.102919
430.0664290.56370.287366
440.0586580.49770.310095
45-0.185346-1.57270.060085
460.0385670.32730.372212
470.045910.38960.349007
48-0.046321-0.3930.347722

\begin{tabular}{lllllllll}
\hline
Autocorrelation Function \tabularnewline
Time lag k & ACF(k) & T-STAT & P-value \tabularnewline
1 & 0.038754 & 0.3288 & 0.371616 \tabularnewline
2 & -0.276967 & -2.3501 & 0.010755 \tabularnewline
3 & 0.163899 & 1.3907 & 0.084296 \tabularnewline
4 & 0.168626 & 1.4308 & 0.078401 \tabularnewline
5 & 0.080713 & 0.6849 & 0.247812 \tabularnewline
6 & 0.076472 & 0.6489 & 0.259239 \tabularnewline
7 & 0.111465 & 0.9458 & 0.173703 \tabularnewline
8 & 0.063939 & 0.5425 & 0.294562 \tabularnewline
9 & 0.073049 & 0.6198 & 0.268659 \tabularnewline
10 & 0.274774 & 2.3315 & 0.011264 \tabularnewline
11 & 0.092042 & 0.781 & 0.21868 \tabularnewline
12 & -0.361597 & -3.0683 & 0.001517 \tabularnewline
13 & 0.084972 & 0.721 & 0.236619 \tabularnewline
14 & 0.16944 & 1.4377 & 0.07742 \tabularnewline
15 & 0.023879 & 0.2026 & 0.420001 \tabularnewline
16 & 0.007006 & 0.0595 & 0.476379 \tabularnewline
17 & 0.024395 & 0.207 & 0.418298 \tabularnewline
18 & 0.034576 & 0.2934 & 0.385036 \tabularnewline
19 & -0.037349 & -0.3169 & 0.376112 \tabularnewline
20 & -0.049349 & -0.4187 & 0.338325 \tabularnewline
21 & -0.019517 & -0.1656 & 0.434466 \tabularnewline
22 & -0.017802 & -0.1511 & 0.440179 \tabularnewline
23 & -0.046089 & -0.3911 & 0.348446 \tabularnewline
24 & 0.048484 & 0.4114 & 0.341002 \tabularnewline
25 & -0.059617 & -0.5059 & 0.307248 \tabularnewline
26 & -0.029038 & -0.2464 & 0.40304 \tabularnewline
27 & -0.012385 & -0.1051 & 0.458298 \tabularnewline
28 & -0.094668 & -0.8033 & 0.212226 \tabularnewline
29 & -0.105192 & -0.8926 & 0.187526 \tabularnewline
30 & -6.9e-05 & -6e-04 & 0.499767 \tabularnewline
31 & 0.008917 & 0.0757 & 0.469949 \tabularnewline
32 & -0.059379 & -0.5038 & 0.307954 \tabularnewline
33 & 0.002615 & 0.0222 & 0.491178 \tabularnewline
34 & -0.044687 & -0.3792 & 0.352835 \tabularnewline
35 & -0.007954 & -0.0675 & 0.473188 \tabularnewline
36 & -0.038029 & -0.3227 & 0.373933 \tabularnewline
37 & -0.010933 & -0.0928 & 0.463171 \tabularnewline
38 & -0.040316 & -0.3421 & 0.36664 \tabularnewline
39 & -0.033285 & -0.2824 & 0.38921 \tabularnewline
40 & 0.046317 & 0.393 & 0.347737 \tabularnewline
41 & -0.001845 & -0.0157 & 0.493776 \tabularnewline
42 & -0.150451 & -1.2766 & 0.102919 \tabularnewline
43 & 0.066429 & 0.5637 & 0.287366 \tabularnewline
44 & 0.058658 & 0.4977 & 0.310095 \tabularnewline
45 & -0.185346 & -1.5727 & 0.060085 \tabularnewline
46 & 0.038567 & 0.3273 & 0.372212 \tabularnewline
47 & 0.04591 & 0.3896 & 0.349007 \tabularnewline
48 & -0.046321 & -0.393 & 0.347722 \tabularnewline
\hline
\end{tabular}
%Source: https://freestatistics.org/blog/index.php?pk=113816&T=1

[TABLE]
[ROW][C]Autocorrelation Function[/C][/ROW]
[ROW][C]Time lag k[/C][C]ACF(k)[/C][C]T-STAT[/C][C]P-value[/C][/ROW]
[ROW][C]1[/C][C]0.038754[/C][C]0.3288[/C][C]0.371616[/C][/ROW]
[ROW][C]2[/C][C]-0.276967[/C][C]-2.3501[/C][C]0.010755[/C][/ROW]
[ROW][C]3[/C][C]0.163899[/C][C]1.3907[/C][C]0.084296[/C][/ROW]
[ROW][C]4[/C][C]0.168626[/C][C]1.4308[/C][C]0.078401[/C][/ROW]
[ROW][C]5[/C][C]0.080713[/C][C]0.6849[/C][C]0.247812[/C][/ROW]
[ROW][C]6[/C][C]0.076472[/C][C]0.6489[/C][C]0.259239[/C][/ROW]
[ROW][C]7[/C][C]0.111465[/C][C]0.9458[/C][C]0.173703[/C][/ROW]
[ROW][C]8[/C][C]0.063939[/C][C]0.5425[/C][C]0.294562[/C][/ROW]
[ROW][C]9[/C][C]0.073049[/C][C]0.6198[/C][C]0.268659[/C][/ROW]
[ROW][C]10[/C][C]0.274774[/C][C]2.3315[/C][C]0.011264[/C][/ROW]
[ROW][C]11[/C][C]0.092042[/C][C]0.781[/C][C]0.21868[/C][/ROW]
[ROW][C]12[/C][C]-0.361597[/C][C]-3.0683[/C][C]0.001517[/C][/ROW]
[ROW][C]13[/C][C]0.084972[/C][C]0.721[/C][C]0.236619[/C][/ROW]
[ROW][C]14[/C][C]0.16944[/C][C]1.4377[/C][C]0.07742[/C][/ROW]
[ROW][C]15[/C][C]0.023879[/C][C]0.2026[/C][C]0.420001[/C][/ROW]
[ROW][C]16[/C][C]0.007006[/C][C]0.0595[/C][C]0.476379[/C][/ROW]
[ROW][C]17[/C][C]0.024395[/C][C]0.207[/C][C]0.418298[/C][/ROW]
[ROW][C]18[/C][C]0.034576[/C][C]0.2934[/C][C]0.385036[/C][/ROW]
[ROW][C]19[/C][C]-0.037349[/C][C]-0.3169[/C][C]0.376112[/C][/ROW]
[ROW][C]20[/C][C]-0.049349[/C][C]-0.4187[/C][C]0.338325[/C][/ROW]
[ROW][C]21[/C][C]-0.019517[/C][C]-0.1656[/C][C]0.434466[/C][/ROW]
[ROW][C]22[/C][C]-0.017802[/C][C]-0.1511[/C][C]0.440179[/C][/ROW]
[ROW][C]23[/C][C]-0.046089[/C][C]-0.3911[/C][C]0.348446[/C][/ROW]
[ROW][C]24[/C][C]0.048484[/C][C]0.4114[/C][C]0.341002[/C][/ROW]
[ROW][C]25[/C][C]-0.059617[/C][C]-0.5059[/C][C]0.307248[/C][/ROW]
[ROW][C]26[/C][C]-0.029038[/C][C]-0.2464[/C][C]0.40304[/C][/ROW]
[ROW][C]27[/C][C]-0.012385[/C][C]-0.1051[/C][C]0.458298[/C][/ROW]
[ROW][C]28[/C][C]-0.094668[/C][C]-0.8033[/C][C]0.212226[/C][/ROW]
[ROW][C]29[/C][C]-0.105192[/C][C]-0.8926[/C][C]0.187526[/C][/ROW]
[ROW][C]30[/C][C]-6.9e-05[/C][C]-6e-04[/C][C]0.499767[/C][/ROW]
[ROW][C]31[/C][C]0.008917[/C][C]0.0757[/C][C]0.469949[/C][/ROW]
[ROW][C]32[/C][C]-0.059379[/C][C]-0.5038[/C][C]0.307954[/C][/ROW]
[ROW][C]33[/C][C]0.002615[/C][C]0.0222[/C][C]0.491178[/C][/ROW]
[ROW][C]34[/C][C]-0.044687[/C][C]-0.3792[/C][C]0.352835[/C][/ROW]
[ROW][C]35[/C][C]-0.007954[/C][C]-0.0675[/C][C]0.473188[/C][/ROW]
[ROW][C]36[/C][C]-0.038029[/C][C]-0.3227[/C][C]0.373933[/C][/ROW]
[ROW][C]37[/C][C]-0.010933[/C][C]-0.0928[/C][C]0.463171[/C][/ROW]
[ROW][C]38[/C][C]-0.040316[/C][C]-0.3421[/C][C]0.36664[/C][/ROW]
[ROW][C]39[/C][C]-0.033285[/C][C]-0.2824[/C][C]0.38921[/C][/ROW]
[ROW][C]40[/C][C]0.046317[/C][C]0.393[/C][C]0.347737[/C][/ROW]
[ROW][C]41[/C][C]-0.001845[/C][C]-0.0157[/C][C]0.493776[/C][/ROW]
[ROW][C]42[/C][C]-0.150451[/C][C]-1.2766[/C][C]0.102919[/C][/ROW]
[ROW][C]43[/C][C]0.066429[/C][C]0.5637[/C][C]0.287366[/C][/ROW]
[ROW][C]44[/C][C]0.058658[/C][C]0.4977[/C][C]0.310095[/C][/ROW]
[ROW][C]45[/C][C]-0.185346[/C][C]-1.5727[/C][C]0.060085[/C][/ROW]
[ROW][C]46[/C][C]0.038567[/C][C]0.3273[/C][C]0.372212[/C][/ROW]
[ROW][C]47[/C][C]0.04591[/C][C]0.3896[/C][C]0.349007[/C][/ROW]
[ROW][C]48[/C][C]-0.046321[/C][C]-0.393[/C][C]0.347722[/C][/ROW]
[/TABLE]
Source: https://freestatistics.org/blog/index.php?pk=113816&T=1

Globally Unique Identifier (entire table): ba.freestatistics.org/blog/index.php?pk=113816&T=1

As an alternative you can also use a QR Code:  

The GUIDs for individual cells are displayed in the table below:

Autocorrelation Function
Time lag kACF(k)T-STATP-value
10.0387540.32880.371616
2-0.276967-2.35010.010755
30.1638991.39070.084296
40.1686261.43080.078401
50.0807130.68490.247812
60.0764720.64890.259239
70.1114650.94580.173703
80.0639390.54250.294562
90.0730490.61980.268659
100.2747742.33150.011264
110.0920420.7810.21868
12-0.361597-3.06830.001517
130.0849720.7210.236619
140.169441.43770.07742
150.0238790.20260.420001
160.0070060.05950.476379
170.0243950.2070.418298
180.0345760.29340.385036
19-0.037349-0.31690.376112
20-0.049349-0.41870.338325
21-0.019517-0.16560.434466
22-0.017802-0.15110.440179
23-0.046089-0.39110.348446
240.0484840.41140.341002
25-0.059617-0.50590.307248
26-0.029038-0.24640.40304
27-0.012385-0.10510.458298
28-0.094668-0.80330.212226
29-0.105192-0.89260.187526
30-6.9e-05-6e-040.499767
310.0089170.07570.469949
32-0.059379-0.50380.307954
330.0026150.02220.491178
34-0.044687-0.37920.352835
35-0.007954-0.06750.473188
36-0.038029-0.32270.373933
37-0.010933-0.09280.463171
38-0.040316-0.34210.36664
39-0.033285-0.28240.38921
400.0463170.3930.347737
41-0.001845-0.01570.493776
42-0.150451-1.27660.102919
430.0664290.56370.287366
440.0586580.49770.310095
45-0.185346-1.57270.060085
460.0385670.32730.372212
470.045910.38960.349007
48-0.046321-0.3930.347722


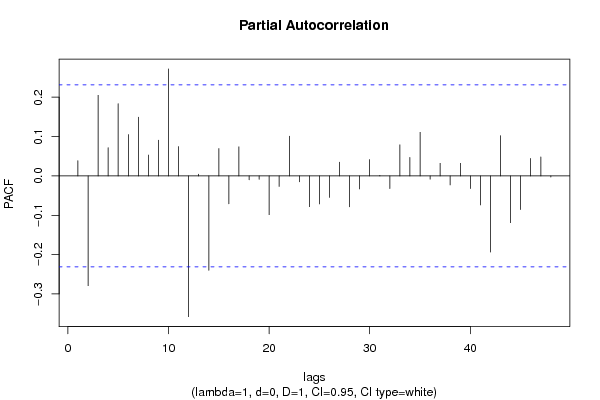
Partial Autocorrelation Function
Time lag kPACF(k)T-STATP-value
10.0387540.32880.371616
2-0.278887-2.36640.010327
30.2046341.73640.043388
40.0715950.60750.272713
50.1833891.55610.062034
60.1050950.89180.187747
70.1490161.26440.105075
80.0530720.45030.326913
90.0906320.7690.222192
100.2716892.30540.012016
110.0745340.63240.264551
12-0.357592-3.03430.001677
130.0044580.03780.484964
14-0.239776-2.03460.022789
150.0692780.58780.279237
16-0.071035-0.60280.274283
170.0737720.6260.266655
18-0.010109-0.08580.46594
19-0.00874-0.07420.470544
20-0.098596-0.83660.20279
21-0.026634-0.2260.410922
220.1010.8570.19714
23-0.014917-0.12660.449815
24-0.078287-0.66430.254314
25-0.071152-0.60370.273956
26-0.054782-0.46480.321724
270.0349190.29630.383927
28-0.078418-0.66540.25396
29-0.033141-0.28120.389678
300.0413960.35130.363212
310.0011780.010.496026
32-0.032301-0.27410.392404
330.079050.67080.252258
340.0470190.3990.345548
350.1106780.93910.175401
36-0.008309-0.07050.471992
370.0318010.26980.394026
38-0.022921-0.19450.42317
390.0318910.27060.393734
40-0.03231-0.27420.392373
41-0.073812-0.62630.266545
42-0.193483-1.64180.0525
430.1020640.8660.194671
44-0.118851-1.00850.158299
45-0.085663-0.72690.234831
460.0443190.37610.353988
470.0482520.40940.34172
48-0.002853-0.02420.490375

\begin{tabular}{lllllllll}
\hline
Partial Autocorrelation Function \tabularnewline
Time lag k & PACF(k) & T-STAT & P-value \tabularnewline
1 & 0.038754 & 0.3288 & 0.371616 \tabularnewline
2 & -0.278887 & -2.3664 & 0.010327 \tabularnewline
3 & 0.204634 & 1.7364 & 0.043388 \tabularnewline
4 & 0.071595 & 0.6075 & 0.272713 \tabularnewline
5 & 0.183389 & 1.5561 & 0.062034 \tabularnewline
6 & 0.105095 & 0.8918 & 0.187747 \tabularnewline
7 & 0.149016 & 1.2644 & 0.105075 \tabularnewline
8 & 0.053072 & 0.4503 & 0.326913 \tabularnewline
9 & 0.090632 & 0.769 & 0.222192 \tabularnewline
10 & 0.271689 & 2.3054 & 0.012016 \tabularnewline
11 & 0.074534 & 0.6324 & 0.264551 \tabularnewline
12 & -0.357592 & -3.0343 & 0.001677 \tabularnewline
13 & 0.004458 & 0.0378 & 0.484964 \tabularnewline
14 & -0.239776 & -2.0346 & 0.022789 \tabularnewline
15 & 0.069278 & 0.5878 & 0.279237 \tabularnewline
16 & -0.071035 & -0.6028 & 0.274283 \tabularnewline
17 & 0.073772 & 0.626 & 0.266655 \tabularnewline
18 & -0.010109 & -0.0858 & 0.46594 \tabularnewline
19 & -0.00874 & -0.0742 & 0.470544 \tabularnewline
20 & -0.098596 & -0.8366 & 0.20279 \tabularnewline
21 & -0.026634 & -0.226 & 0.410922 \tabularnewline
22 & 0.101 & 0.857 & 0.19714 \tabularnewline
23 & -0.014917 & -0.1266 & 0.449815 \tabularnewline
24 & -0.078287 & -0.6643 & 0.254314 \tabularnewline
25 & -0.071152 & -0.6037 & 0.273956 \tabularnewline
26 & -0.054782 & -0.4648 & 0.321724 \tabularnewline
27 & 0.034919 & 0.2963 & 0.383927 \tabularnewline
28 & -0.078418 & -0.6654 & 0.25396 \tabularnewline
29 & -0.033141 & -0.2812 & 0.389678 \tabularnewline
30 & 0.041396 & 0.3513 & 0.363212 \tabularnewline
31 & 0.001178 & 0.01 & 0.496026 \tabularnewline
32 & -0.032301 & -0.2741 & 0.392404 \tabularnewline
33 & 0.07905 & 0.6708 & 0.252258 \tabularnewline
34 & 0.047019 & 0.399 & 0.345548 \tabularnewline
35 & 0.110678 & 0.9391 & 0.175401 \tabularnewline
36 & -0.008309 & -0.0705 & 0.471992 \tabularnewline
37 & 0.031801 & 0.2698 & 0.394026 \tabularnewline
38 & -0.022921 & -0.1945 & 0.42317 \tabularnewline
39 & 0.031891 & 0.2706 & 0.393734 \tabularnewline
40 & -0.03231 & -0.2742 & 0.392373 \tabularnewline
41 & -0.073812 & -0.6263 & 0.266545 \tabularnewline
42 & -0.193483 & -1.6418 & 0.0525 \tabularnewline
43 & 0.102064 & 0.866 & 0.194671 \tabularnewline
44 & -0.118851 & -1.0085 & 0.158299 \tabularnewline
45 & -0.085663 & -0.7269 & 0.234831 \tabularnewline
46 & 0.044319 & 0.3761 & 0.353988 \tabularnewline
47 & 0.048252 & 0.4094 & 0.34172 \tabularnewline
48 & -0.002853 & -0.0242 & 0.490375 \tabularnewline
\hline
\end{tabular}
%Source: https://freestatistics.org/blog/index.php?pk=113816&T=2

[TABLE]
[ROW][C]Partial Autocorrelation Function[/C][/ROW]
[ROW][C]Time lag k[/C][C]PACF(k)[/C][C]T-STAT[/C][C]P-value[/C][/ROW]
[ROW][C]1[/C][C]0.038754[/C][C]0.3288[/C][C]0.371616[/C][/ROW]
[ROW][C]2[/C][C]-0.278887[/C][C]-2.3664[/C][C]0.010327[/C][/ROW]
[ROW][C]3[/C][C]0.204634[/C][C]1.7364[/C][C]0.043388[/C][/ROW]
[ROW][C]4[/C][C]0.071595[/C][C]0.6075[/C][C]0.272713[/C][/ROW]
[ROW][C]5[/C][C]0.183389[/C][C]1.5561[/C][C]0.062034[/C][/ROW]
[ROW][C]6[/C][C]0.105095[/C][C]0.8918[/C][C]0.187747[/C][/ROW]
[ROW][C]7[/C][C]0.149016[/C][C]1.2644[/C][C]0.105075[/C][/ROW]
[ROW][C]8[/C][C]0.053072[/C][C]0.4503[/C][C]0.326913[/C][/ROW]
[ROW][C]9[/C][C]0.090632[/C][C]0.769[/C][C]0.222192[/C][/ROW]
[ROW][C]10[/C][C]0.271689[/C][C]2.3054[/C][C]0.012016[/C][/ROW]
[ROW][C]11[/C][C]0.074534[/C][C]0.6324[/C][C]0.264551[/C][/ROW]
[ROW][C]12[/C][C]-0.357592[/C][C]-3.0343[/C][C]0.001677[/C][/ROW]
[ROW][C]13[/C][C]0.004458[/C][C]0.0378[/C][C]0.484964[/C][/ROW]
[ROW][C]14[/C][C]-0.239776[/C][C]-2.0346[/C][C]0.022789[/C][/ROW]
[ROW][C]15[/C][C]0.069278[/C][C]0.5878[/C][C]0.279237[/C][/ROW]
[ROW][C]16[/C][C]-0.071035[/C][C]-0.6028[/C][C]0.274283[/C][/ROW]
[ROW][C]17[/C][C]0.073772[/C][C]0.626[/C][C]0.266655[/C][/ROW]
[ROW][C]18[/C][C]-0.010109[/C][C]-0.0858[/C][C]0.46594[/C][/ROW]
[ROW][C]19[/C][C]-0.00874[/C][C]-0.0742[/C][C]0.470544[/C][/ROW]
[ROW][C]20[/C][C]-0.098596[/C][C]-0.8366[/C][C]0.20279[/C][/ROW]
[ROW][C]21[/C][C]-0.026634[/C][C]-0.226[/C][C]0.410922[/C][/ROW]
[ROW][C]22[/C][C]0.101[/C][C]0.857[/C][C]0.19714[/C][/ROW]
[ROW][C]23[/C][C]-0.014917[/C][C]-0.1266[/C][C]0.449815[/C][/ROW]
[ROW][C]24[/C][C]-0.078287[/C][C]-0.6643[/C][C]0.254314[/C][/ROW]
[ROW][C]25[/C][C]-0.071152[/C][C]-0.6037[/C][C]0.273956[/C][/ROW]
[ROW][C]26[/C][C]-0.054782[/C][C]-0.4648[/C][C]0.321724[/C][/ROW]
[ROW][C]27[/C][C]0.034919[/C][C]0.2963[/C][C]0.383927[/C][/ROW]
[ROW][C]28[/C][C]-0.078418[/C][C]-0.6654[/C][C]0.25396[/C][/ROW]
[ROW][C]29[/C][C]-0.033141[/C][C]-0.2812[/C][C]0.389678[/C][/ROW]
[ROW][C]30[/C][C]0.041396[/C][C]0.3513[/C][C]0.363212[/C][/ROW]
[ROW][C]31[/C][C]0.001178[/C][C]0.01[/C][C]0.496026[/C][/ROW]
[ROW][C]32[/C][C]-0.032301[/C][C]-0.2741[/C][C]0.392404[/C][/ROW]
[ROW][C]33[/C][C]0.07905[/C][C]0.6708[/C][C]0.252258[/C][/ROW]
[ROW][C]34[/C][C]0.047019[/C][C]0.399[/C][C]0.345548[/C][/ROW]
[ROW][C]35[/C][C]0.110678[/C][C]0.9391[/C][C]0.175401[/C][/ROW]
[ROW][C]36[/C][C]-0.008309[/C][C]-0.0705[/C][C]0.471992[/C][/ROW]
[ROW][C]37[/C][C]0.031801[/C][C]0.2698[/C][C]0.394026[/C][/ROW]
[ROW][C]38[/C][C]-0.022921[/C][C]-0.1945[/C][C]0.42317[/C][/ROW]
[ROW][C]39[/C][C]0.031891[/C][C]0.2706[/C][C]0.393734[/C][/ROW]
[ROW][C]40[/C][C]-0.03231[/C][C]-0.2742[/C][C]0.392373[/C][/ROW]
[ROW][C]41[/C][C]-0.073812[/C][C]-0.6263[/C][C]0.266545[/C][/ROW]
[ROW][C]42[/C][C]-0.193483[/C][C]-1.6418[/C][C]0.0525[/C][/ROW]
[ROW][C]43[/C][C]0.102064[/C][C]0.866[/C][C]0.194671[/C][/ROW]
[ROW][C]44[/C][C]-0.118851[/C][C]-1.0085[/C][C]0.158299[/C][/ROW]
[ROW][C]45[/C][C]-0.085663[/C][C]-0.7269[/C][C]0.234831[/C][/ROW]
[ROW][C]46[/C][C]0.044319[/C][C]0.3761[/C][C]0.353988[/C][/ROW]
[ROW][C]47[/C][C]0.048252[/C][C]0.4094[/C][C]0.34172[/C][/ROW]
[ROW][C]48[/C][C]-0.002853[/C][C]-0.0242[/C][C]0.490375[/C][/ROW]
[/TABLE]
Source: https://freestatistics.org/blog/index.php?pk=113816&T=2

Globally Unique Identifier (entire table): ba.freestatistics.org/blog/index.php?pk=113816&T=2

As an alternative you can also use a QR Code:  

The GUIDs for individual cells are displayed in the table below:

Partial Autocorrelation Function
Time lag kPACF(k)T-STATP-value
10.0387540.32880.371616
2-0.278887-2.36640.010327
30.2046341.73640.043388
40.0715950.60750.272713
50.1833891.55610.062034
60.1050950.89180.187747
70.1490161.26440.105075
80.0530720.45030.326913
90.0906320.7690.222192
100.2716892.30540.012016
110.0745340.63240.264551
12-0.357592-3.03430.001677
130.0044580.03780.484964
14-0.239776-2.03460.022789
150.0692780.58780.279237
16-0.071035-0.60280.274283
170.0737720.6260.266655
18-0.010109-0.08580.46594
19-0.00874-0.07420.470544
20-0.098596-0.83660.20279
21-0.026634-0.2260.410922
220.1010.8570.19714
23-0.014917-0.12660.449815
24-0.078287-0.66430.254314
25-0.071152-0.60370.273956
26-0.054782-0.46480.321724
270.0349190.29630.383927
28-0.078418-0.66540.25396
29-0.033141-0.28120.389678
300.0413960.35130.363212
310.0011780.010.496026
32-0.032301-0.27410.392404
330.079050.67080.252258
340.0470190.3990.345548
350.1106780.93910.175401
36-0.008309-0.07050.471992
370.0318010.26980.394026
38-0.022921-0.19450.42317
390.0318910.27060.393734
40-0.03231-0.27420.392373
41-0.073812-0.62630.266545
42-0.193483-1.64180.0525
430.1020640.8660.194671
44-0.118851-1.00850.158299
45-0.085663-0.72690.234831
460.0443190.37610.353988
470.0482520.40940.34172
48-0.002853-0.02420.490375


Parameters (Session):
par1 = 48 ; par2 = 1 ; par3 = 0 ; par4 = 1 ; par5 = 12 ; par6 = White Noise ; par7 = 0.95 ;
Parameters (R input):
par1 = 48 ; par2 = 1 ; par3 = 0 ; par4 = 1 ; par5 = 12 ; par6 = White Noise ; par7 = 0.95 ; par8 = ;
R code (references can be found in the software module):
if (par1 == 'Default') {
par1 = 10*log10(length(x))
} else {
par1 <- as.numeric(par1)
}
par2 <- as.numeric(par2)
par3 <- as.numeric(par3)
par4 <- as.numeric(par4)
par5 <- as.numeric(par5)
if (par6 == 'White Noise') par6 <- 'white' else par6 <- 'ma'
par7 <- as.numeric(par7)
if (par8 != '') par8 <- as.numeric(par8)
ox <- x
if (par8 == '') {
if (par2 == 0) {
x <- log(x)
} else {
x <- (x ^ par2 - 1) / par2
}
} else {
x <- log(x,base=par8)
}
if (par3 > 0) x <- diff(x,lag=1,difference=par3)
if (par4 > 0) x <- diff(x,lag=par5,difference=par4)
bitmap(file='picts.png')
op <- par(mfrow=c(2,1))
plot(ox,type='l',main='Original Time Series',xlab='time',ylab='value')
if (par8=='') {
mytitle <- paste('Working Time Series (lambda=',par2,', d=',par3,', D=',par4,')',sep='')
mysub <- paste('(lambda=',par2,', d=',par3,', D=',par4,', CI=', par7, ', CI type=',par6,')',sep='')
} else {
mytitle <- paste('Working Time Series (base=',par8,', d=',par3,', D=',par4,')',sep='')
mysub <- paste('(base=',par8,', d=',par3,', D=',par4,', CI=', par7, ', CI type=',par6,')',sep='')
}
plot(x,type='l', main=mytitle,xlab='time',ylab='value')
par(op)
dev.off()
bitmap(file='pic1.png')
racf <- acf(x, par1, main='Autocorrelation', xlab='time lag', ylab='ACF', ci.type=par6, ci=par7, sub=mysub)
dev.off()
bitmap(file='pic2.png')
rpacf <- pacf(x,par1,main='Partial Autocorrelation',xlab='lags',ylab='PACF',sub=mysub)
dev.off()
(myacf <- c(racf$acf))
(mypacf <- c(rpacf$acf))
lengthx <- length(x)
sqrtn <- sqrt(lengthx)
load(file='createtable')
a<-table.start()
a<-table.row.start(a)
a<-table.element(a,'Autocorrelation Function',4,TRUE)
a<-table.row.end(a)
a<-table.row.start(a)
a<-table.element(a,'Time lag k',header=TRUE)
a<-table.element(a,hyperlink('basics.htm','ACF(k)','click here for more information about the Autocorrelation Function'),header=TRUE)
a<-table.element(a,'T-STAT',header=TRUE)
a<-table.element(a,'P-value',header=TRUE)
a<-table.row.end(a)
for (i in 2:(par1+1)) {
a<-table.row.start(a)
a<-table.element(a,i-1,header=TRUE)
a<-table.element(a,round(myacf[i],6))
mytstat <- myacf[i]*sqrtn
a<-table.element(a,round(mytstat,4))
a<-table.element(a,round(1-pt(abs(mytstat),lengthx),6))
a<-table.row.end(a)
}
a<-table.end(a)
table.save(a,file='mytable.tab')
a<-table.start()
a<-table.row.start(a)
a<-table.element(a,'Partial Autocorrelation Function',4,TRUE)
a<-table.row.end(a)
a<-table.row.start(a)
a<-table.element(a,'Time lag k',header=TRUE)
a<-table.element(a,hyperlink('basics.htm','PACF(k)','click here for more information about the Partial Autocorrelation Function'),header=TRUE)
a<-table.element(a,'T-STAT',header=TRUE)
a<-table.element(a,'P-value',header=TRUE)
a<-table.row.end(a)
for (i in 1:par1) {
a<-table.row.start(a)
a<-table.element(a,i,header=TRUE)
a<-table.element(a,round(mypacf[i],6))
mytstat <- mypacf[i]*sqrtn
a<-table.element(a,round(mytstat,4))
a<-table.element(a,round(1-pt(abs(mytstat),lengthx),6))
a<-table.row.end(a)
}
a<-table.end(a)
table.save(a,file='mytable1.tab')