Free Statistics

of Irreproducible Research!

Author's title

Author*The author of this computation has been verified*
R Software Modulerwasp_smp.wasp
Title produced by softwareStandard Deviation-Mean Plot
Date of computationTue, 21 Dec 2010 12:52:06 +0000
Cite this page as followsStatistical Computations at FreeStatistics.org, Office for Research Development and Education, URL https://freestatistics.org/blog/index.php?v=date/2010/Dec/21/t1292936087d875z280ndw2yve.htm/, Retrieved Sun, 19 May 2024 21:16:45 +0000
Statistical Computations at FreeStatistics.org, Office for Research Development and Education, URL https://freestatistics.org/blog/index.php?pk=113443, Retrieved Sun, 19 May 2024 21:16:45 +0000
QR Codes:

Original text written by user:
IsPrivate?No (this computation is public)
User-defined keywords
Estimated Impact107
Family? (F = Feedback message, R = changed R code, M = changed R Module, P = changed Parameters, D = changed Data)
F       [Standard Deviation-Mean Plot] [SMP paper uitvoer...] [2010-12-21 12:52:06] [efffa7146cfe4c2b113f6c7f36d84ca0] [Current]
Feedback Forum
2011-02-14 19:22:16 [Rik Goetschalckx] [reply
Hier wordt een foute beredenering gemaakt. De alfa waarde in deze test is niet de alfa waarde die we gebruiken om de p-waarde mee te vergelijken. We behouden onze alfa waarde van 5% (de kans dat we ons vergissen bij het verwerpen van de nulhypothese (type 1 fout)). We zien dat de p-waarde nl. 14% hoger is dan deze waarde dus we aanvaarden de nulhypothese.

Post a new message
Dataseries X:
14544
15116
17413
16181
15607
17160
14915
13768
17487
16198
17535
16571
16198
16554
19554
15903
18003
18329
16260
14851
18174
18406
18466
16016
17428
17167
19630
17183
18344
19301
18147
16192
18374
20515
18957
16471
18746
19009
19211
20547
19325
20605
20056
16141
20359
19711
15638
14384
13855
14308
15290
14423
13779
15686
14733
12522
16189
16059
16007
15806
15160


Summary of computational transaction
Raw Inputview raw input (R code)
Raw Outputview raw output of R engine
Computing time6 seconds
R Server'Sir Ronald Aylmer Fisher' @ 193.190.124.24

\begin{tabular}{lllllllll}
\hline
Summary of computational transaction \tabularnewline
Raw Input & view raw input (R code)  \tabularnewline
Raw Output & view raw output of R engine  \tabularnewline
Computing time & 6 seconds \tabularnewline
R Server & 'Sir Ronald Aylmer Fisher' @ 193.190.124.24 \tabularnewline
\hline
\end{tabular}
%Source: https://freestatistics.org/blog/index.php?pk=113443&T=0

[TABLE]
[ROW][C]Summary of computational transaction[/C][/ROW]
[ROW][C]Raw Input[/C][C]view raw input (R code) [/C][/ROW]
[ROW][C]Raw Output[/C][C]view raw output of R engine [/C][/ROW]
[ROW][C]Computing time[/C][C]6 seconds[/C][/ROW]
[ROW][C]R Server[/C][C]'Sir Ronald Aylmer Fisher' @ 193.190.124.24[/C][/ROW]
[/TABLE]
Source: https://freestatistics.org/blog/index.php?pk=113443&T=0

Globally Unique Identifier (entire table): ba.freestatistics.org/blog/index.php?pk=113443&T=0

As an alternative you can also use a QR Code:  

The GUIDs for individual cells are displayed in the table below:

Summary of computational transaction
Raw Inputview raw input (R code)
Raw Outputview raw output of R engine
Computing time6 seconds
R Server'Sir Ronald Aylmer Fisher' @ 193.190.124.24


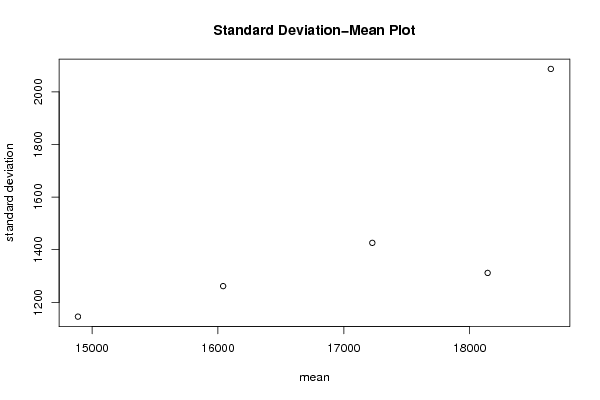
Standard Deviation-Mean Plot
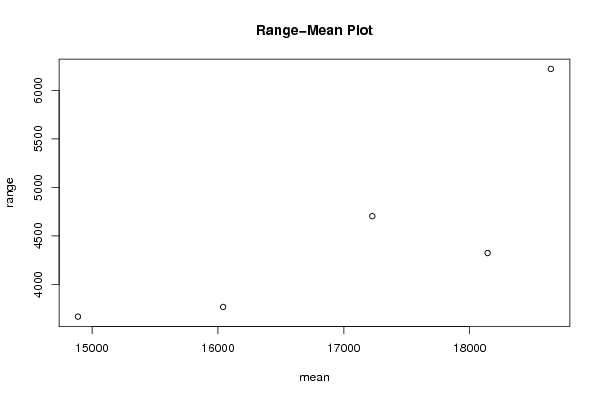
SectionMeanStandard DeviationRange
116041.251261.385971137233767
217226.16666666671425.903339407464703
318142.41666666671311.566478981484323
418644.33333333332087.144867269576221
514888.08333333331145.295155156193667

\begin{tabular}{lllllllll}
\hline
Standard Deviation-Mean Plot \tabularnewline
Section & Mean & Standard Deviation & Range \tabularnewline
1 & 16041.25 & 1261.38597113723 & 3767 \tabularnewline
2 & 17226.1666666667 & 1425.90333940746 & 4703 \tabularnewline
3 & 18142.4166666667 & 1311.56647898148 & 4323 \tabularnewline
4 & 18644.3333333333 & 2087.14486726957 & 6221 \tabularnewline
5 & 14888.0833333333 & 1145.29515515619 & 3667 \tabularnewline
\hline
\end{tabular}
%Source: https://freestatistics.org/blog/index.php?pk=113443&T=1

[TABLE]
[ROW][C]Standard Deviation-Mean Plot[/C][/ROW]
[ROW][C]Section[/C][C]Mean[/C][C]Standard Deviation[/C][C]Range[/C][/ROW]
[ROW][C]1[/C][C]16041.25[/C][C]1261.38597113723[/C][C]3767[/C][/ROW]
[ROW][C]2[/C][C]17226.1666666667[/C][C]1425.90333940746[/C][C]4703[/C][/ROW]
[ROW][C]3[/C][C]18142.4166666667[/C][C]1311.56647898148[/C][C]4323[/C][/ROW]
[ROW][C]4[/C][C]18644.3333333333[/C][C]2087.14486726957[/C][C]6221[/C][/ROW]
[ROW][C]5[/C][C]14888.0833333333[/C][C]1145.29515515619[/C][C]3667[/C][/ROW]
[/TABLE]
Source: https://freestatistics.org/blog/index.php?pk=113443&T=1

Globally Unique Identifier (entire table): ba.freestatistics.org/blog/index.php?pk=113443&T=1

As an alternative you can also use a QR Code:  

The GUIDs for individual cells are displayed in the table below:

Standard Deviation-Mean Plot
SectionMeanStandard DeviationRange
116041.251261.385971137233767
217226.16666666671425.903339407464703
318142.41666666671311.566478981484323
418644.33333333332087.144867269576221
514888.08333333331145.295155156193667


Regression: S.E.(k) = alpha + beta * Mean(k)
alpha-1628.25674196604
beta0.180976834517359
S.D.0.0929986623050274
T-STAT1.94601545905866
p-value0.146844763789135

\begin{tabular}{lllllllll}
\hline
Regression: S.E.(k) = alpha + beta * Mean(k) \tabularnewline
alpha & -1628.25674196604 \tabularnewline
beta & 0.180976834517359 \tabularnewline
S.D. & 0.0929986623050274 \tabularnewline
T-STAT & 1.94601545905866 \tabularnewline
p-value & 0.146844763789135 \tabularnewline
\hline
\end{tabular}
%Source: https://freestatistics.org/blog/index.php?pk=113443&T=2

[TABLE]
[ROW][C]Regression: S.E.(k) = alpha + beta * Mean(k)[/C][/ROW]
[ROW][C]alpha[/C][C]-1628.25674196604[/C][/ROW]
[ROW][C]beta[/C][C]0.180976834517359[/C][/ROW]
[ROW][C]S.D.[/C][C]0.0929986623050274[/C][/ROW]
[ROW][C]T-STAT[/C][C]1.94601545905866[/C][/ROW]
[ROW][C]p-value[/C][C]0.146844763789135[/C][/ROW]
[/TABLE]
Source: https://freestatistics.org/blog/index.php?pk=113443&T=2

Globally Unique Identifier (entire table): ba.freestatistics.org/blog/index.php?pk=113443&T=2

As an alternative you can also use a QR Code:  

The GUIDs for individual cells are displayed in the table below:

Regression: S.E.(k) = alpha + beta * Mean(k)
alpha-1628.25674196604
beta0.180976834517359
S.D.0.0929986623050274
T-STAT1.94601545905866
p-value0.146844763789135


Regression: ln S.E.(k) = alpha + beta * ln Mean(k)
alpha-11.6784664605038
beta1.94436357559351
S.D.0.925870919451095
T-STAT2.10003741854884
p-value0.126560694036806
Lambda-0.944363575593515

\begin{tabular}{lllllllll}
\hline
Regression: ln S.E.(k) = alpha + beta * ln Mean(k) \tabularnewline
alpha & -11.6784664605038 \tabularnewline
beta & 1.94436357559351 \tabularnewline
S.D. & 0.925870919451095 \tabularnewline
T-STAT & 2.10003741854884 \tabularnewline
p-value & 0.126560694036806 \tabularnewline
Lambda & -0.944363575593515 \tabularnewline
\hline
\end{tabular}
%Source: https://freestatistics.org/blog/index.php?pk=113443&T=3

[TABLE]
[ROW][C]Regression: ln S.E.(k) = alpha + beta * ln Mean(k)[/C][/ROW]
[ROW][C]alpha[/C][C]-11.6784664605038[/C][/ROW]
[ROW][C]beta[/C][C]1.94436357559351[/C][/ROW]
[ROW][C]S.D.[/C][C]0.925870919451095[/C][/ROW]
[ROW][C]T-STAT[/C][C]2.10003741854884[/C][/ROW]
[ROW][C]p-value[/C][C]0.126560694036806[/C][/ROW]
[ROW][C]Lambda[/C][C]-0.944363575593515[/C][/ROW]
[/TABLE]
Source: https://freestatistics.org/blog/index.php?pk=113443&T=3

Globally Unique Identifier (entire table): ba.freestatistics.org/blog/index.php?pk=113443&T=3

As an alternative you can also use a QR Code:  

The GUIDs for individual cells are displayed in the table below:

Regression: ln S.E.(k) = alpha + beta * ln Mean(k)
alpha-11.6784664605038
beta1.94436357559351
S.D.0.925870919451095
T-STAT2.10003741854884
p-value0.126560694036806
Lambda-0.944363575593515


Parameters (Session):
par1 = 12 ;
Parameters (R input):
par1 = 12 ;
R code (references can be found in the software module):
par1 <- as.numeric(par1)
(n <- length(x))
(np <- floor(n / par1))
arr <- array(NA,dim=c(par1,np))
j <- 0
k <- 1
for (i in 1:(np*par1))
{
j = j + 1
arr[j,k] <- x[i]
if (j == par1) {
j = 0
k=k+1
}
}
arr
arr.mean <- array(NA,dim=np)
arr.sd <- array(NA,dim=np)
arr.range <- array(NA,dim=np)
for (j in 1:np)
{
arr.mean[j] <- mean(arr[,j],na.rm=TRUE)
arr.sd[j] <- sd(arr[,j],na.rm=TRUE)
arr.range[j] <- max(arr[,j],na.rm=TRUE) - min(arr[,j],na.rm=TRUE)
}
arr.mean
arr.sd
arr.range
(lm1 <- lm(arr.sd~arr.mean))
(lnlm1 <- lm(log(arr.sd)~log(arr.mean)))
(lm2 <- lm(arr.range~arr.mean))
bitmap(file='test1.png')
plot(arr.mean,arr.sd,main='Standard Deviation-Mean Plot',xlab='mean',ylab='standard deviation')
dev.off()
bitmap(file='test2.png')
plot(arr.mean,arr.range,main='Range-Mean Plot',xlab='mean',ylab='range')
dev.off()
load(file='createtable')
a<-table.start()
a<-table.row.start(a)
a<-table.element(a,'Standard Deviation-Mean Plot',4,TRUE)
a<-table.row.end(a)
a<-table.row.start(a)
a<-table.element(a,'Section',header=TRUE)
a<-table.element(a,'Mean',header=TRUE)
a<-table.element(a,'Standard Deviation',header=TRUE)
a<-table.element(a,'Range',header=TRUE)
a<-table.row.end(a)
for (j in 1:np) {
a<-table.row.start(a)
a<-table.element(a,j,header=TRUE)
a<-table.element(a,arr.mean[j])
a<-table.element(a,arr.sd[j] )
a<-table.element(a,arr.range[j] )
a<-table.row.end(a)
}
a<-table.end(a)
table.save(a,file='mytable.tab')
a<-table.start()
a<-table.row.start(a)
a<-table.element(a,'Regression: S.E.(k) = alpha + beta * Mean(k)',2,TRUE)
a<-table.row.end(a)
a<-table.row.start(a)
a<-table.element(a,'alpha',header=TRUE)
a<-table.element(a,lm1$coefficients[[1]])
a<-table.row.end(a)
a<-table.row.start(a)
a<-table.element(a,'beta',header=TRUE)
a<-table.element(a,lm1$coefficients[[2]])
a<-table.row.end(a)
a<-table.row.start(a)
a<-table.element(a,'S.D.',header=TRUE)
a<-table.element(a,summary(lm1)$coefficients[2,2])
a<-table.row.end(a)
a<-table.row.start(a)
a<-table.element(a,'T-STAT',header=TRUE)
a<-table.element(a,summary(lm1)$coefficients[2,3])
a<-table.row.end(a)
a<-table.row.start(a)
a<-table.element(a,'p-value',header=TRUE)
a<-table.element(a,summary(lm1)$coefficients[2,4])
a<-table.row.end(a)
a<-table.end(a)
table.save(a,file='mytable1.tab')
a<-table.start()
a<-table.row.start(a)
a<-table.element(a,'Regression: ln S.E.(k) = alpha + beta * ln Mean(k)',2,TRUE)
a<-table.row.end(a)
a<-table.row.start(a)
a<-table.element(a,'alpha',header=TRUE)
a<-table.element(a,lnlm1$coefficients[[1]])
a<-table.row.end(a)
a<-table.row.start(a)
a<-table.element(a,'beta',header=TRUE)
a<-table.element(a,lnlm1$coefficients[[2]])
a<-table.row.end(a)
a<-table.row.start(a)
a<-table.element(a,'S.D.',header=TRUE)
a<-table.element(a,summary(lnlm1)$coefficients[2,2])
a<-table.row.end(a)
a<-table.row.start(a)
a<-table.element(a,'T-STAT',header=TRUE)
a<-table.element(a,summary(lnlm1)$coefficients[2,3])
a<-table.row.end(a)
a<-table.row.start(a)
a<-table.element(a,'p-value',header=TRUE)
a<-table.element(a,summary(lnlm1)$coefficients[2,4])
a<-table.row.end(a)
a<-table.row.start(a)
a<-table.element(a,'Lambda',header=TRUE)
a<-table.element(a,1-lnlm1$coefficients[[2]])
a<-table.row.end(a)
a<-table.end(a)
table.save(a,file='mytable2.tab')