Free Statistics
of Irreproducible Research!
Description of Statistical Computation | |||||||||||||||||||||||||||||||||||||||||
|---|---|---|---|---|---|---|---|---|---|---|---|---|---|---|---|---|---|---|---|---|---|---|---|---|---|---|---|---|---|---|---|---|---|---|---|---|---|---|---|---|---|
| Author's title | |||||||||||||||||||||||||||||||||||||||||
| Author | *The author of this computation has been verified* | ||||||||||||||||||||||||||||||||||||||||
| R Software Module | rwasp_univariatedataseries.wasp | ||||||||||||||||||||||||||||||||||||||||
| Title produced by software | Univariate Data Series | ||||||||||||||||||||||||||||||||||||||||
| Date of computation | Tue, 21 Dec 2010 12:02:14 +0000 | ||||||||||||||||||||||||||||||||||||||||
| Cite this page as follows | Statistical Computations at FreeStatistics.org, Office for Research Development and Education, URL https://freestatistics.org/blog/index.php?v=date/2010/Dec/21/t1292932868voqlgdhhy9o8qwg.htm/, Retrieved Sun, 19 May 2024 18:46:18 +0000 | ||||||||||||||||||||||||||||||||||||||||
| Statistical Computations at FreeStatistics.org, Office for Research Development and Education, URL https://freestatistics.org/blog/index.php?pk=113334, Retrieved Sun, 19 May 2024 18:46:18 +0000 | |||||||||||||||||||||||||||||||||||||||||
| QR Codes: | |||||||||||||||||||||||||||||||||||||||||
|
| |||||||||||||||||||||||||||||||||||||||||
| Original text written by user: | |||||||||||||||||||||||||||||||||||||||||
| IsPrivate? | No (this computation is public) | ||||||||||||||||||||||||||||||||||||||||
| User-defined keywords | |||||||||||||||||||||||||||||||||||||||||
| Estimated Impact | 110 | ||||||||||||||||||||||||||||||||||||||||
Tree of Dependent Computations | |||||||||||||||||||||||||||||||||||||||||
| Family? (F = Feedback message, R = changed R code, M = changed R Module, P = changed Parameters, D = changed Data) | |||||||||||||||||||||||||||||||||||||||||
| - [Univariate Data Series] [Totale Uitvoer va...] [2008-12-07 12:59:43] [299afd6311e4c20059ea2f05c8dd029d] - MPD [Univariate Data Series] [Olieprijs] [2010-12-21 12:02:14] [2e87ce7aa3eb3dfe16df617f31f74f3c] [Current] | |||||||||||||||||||||||||||||||||||||||||
| Feedback Forum | |||||||||||||||||||||||||||||||||||||||||
Post a new message | |||||||||||||||||||||||||||||||||||||||||
Dataset | |||||||||||||||||||||||||||||||||||||||||
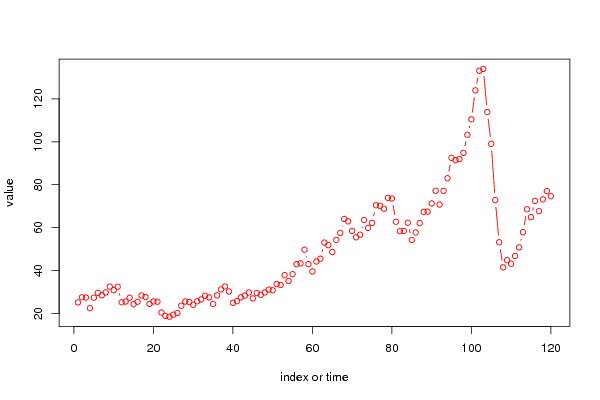
| Dataseries X: | |||||||||||||||||||||||||||||||||||||||||
25.22 27.63 27.47 22.54 27.4 29.68 28.51 29.89 32.62 30.93 32.52 25.28 25.64 27.41 24.4 25.55 28.45 27.72 24.54 25.67 25.54 20.48 18.94 18.6 19.49 20.29 23.69 25.65 25.43 24.13 25.77 26.63 28.34 27.55 24.5 28.52 31.29 32.65 30.34 25.02 25.81 27.55 28.4 29.83 27.1 29.59 28.77 29.88 31.18 30.87 33.8 33.36 37.92 35.19 38.37 43.03 43.38 49.77 43.05 39.65 44.28 45.56 53.08 51.86 48.67 54.31 57.58 64.09 62.98 58.52 55.54 56.75 63.57 59.92 62.25 70.44 70.19 68.86 73.9 73.61 62.77 58.38 58.48 62.31 54.3 57.76 62.14 67.4 67.48 71.32 77.2 70.8 77.13 83.04 92.53 91.45 91.92 94.82 103.28 110.44 123.94 133.05 133.9 113.85 99.06 72.84 53.24 41.58 44.86 43.24 46.84 50.85 57.94 68.59 64.92 72.5 67.69 73.19 77.04 74.67 | |||||||||||||||||||||||||||||||||||||||||
Tables (Output of Computation) | |||||||||||||||||||||||||||||||||||||||||
| |||||||||||||||||||||||||||||||||||||||||
Figures (Output of Computation) | |||||||||||||||||||||||||||||||||||||||||
Input Parameters & R Code | |||||||||||||||||||||||||||||||||||||||||
| Parameters (Session): | |||||||||||||||||||||||||||||||||||||||||
| par1 = Olieprijs ; par2 = www.mongabay.com ; par3 = Maandelijks verloop ; par4 = 12 ; | |||||||||||||||||||||||||||||||||||||||||
| Parameters (R input): | |||||||||||||||||||||||||||||||||||||||||
| par1 = Olieprijs ; par2 = www.mongabay.com ; par3 = Maandelijks verloop ; par4 = 12 ; | |||||||||||||||||||||||||||||||||||||||||
| R code (references can be found in the software module): | |||||||||||||||||||||||||||||||||||||||||
bitmap(file='test1.png') | |||||||||||||||||||||||||||||||||||||||||