Free Statistics

of Irreproducible Research!

Author's title

Author*The author of this computation has been verified*
R Software Modulerwasp_smp.wasp
Title produced by softwareStandard Deviation-Mean Plot
Date of computationTue, 21 Dec 2010 11:21:21 +0000
Cite this page as followsStatistical Computations at FreeStatistics.org, Office for Research Development and Education, URL https://freestatistics.org/blog/index.php?v=date/2010/Dec/21/t1292930350x8tjopmbul26u5f.htm/, Retrieved Sun, 19 May 2024 20:28:50 +0000
Statistical Computations at FreeStatistics.org, Office for Research Development and Education, URL https://freestatistics.org/blog/index.php?pk=113280, Retrieved Sun, 19 May 2024 20:28:50 +0000
QR Codes:

Original text written by user:
IsPrivate?No (this computation is public)
User-defined keywords
Estimated Impact155
Family? (F = Feedback message, R = changed R code, M = changed R Module, P = changed Parameters, D = changed Data)
-       [Standard Deviation-Mean Plot] [] [2010-12-21 11:21:21] [583fc5a74bfa894f261a865501f20e1c] [Current]
- R  D    [Standard Deviation-Mean Plot] [] [2011-12-22 23:20:01] [74be16979710d4c4e7c6647856088456]
Feedback Forum

Post a new message
Dataseries X:
5124
4742
5434
5684
6332
6334
5636
5940
6195
6022
4535
4320
4872
4662
4663
5491
6018
6393
5610
5777
6094
6478
5216
5201
4784
4205
4681
4896
5752
6452
5995
5601
6119
6569
5798
5492
5018
4773
5502
5908
5902
6125
5419
5559
5962
6023
5346
5379
4859
5156
5010
5508
6426
6043
5499
5191
5790
5949
5219
4729


Summary of computational transaction
Raw Inputview raw input (R code)
Raw Outputview raw output of R engine
Computing time2 seconds
R Server'Sir Ronald Aylmer Fisher' @ 193.190.124.24

\begin{tabular}{lllllllll}
\hline
Summary of computational transaction \tabularnewline
Raw Input & view raw input (R code)  \tabularnewline
Raw Output & view raw output of R engine  \tabularnewline
Computing time & 2 seconds \tabularnewline
R Server & 'Sir Ronald Aylmer Fisher' @ 193.190.124.24 \tabularnewline
\hline
\end{tabular}
%Source: https://freestatistics.org/blog/index.php?pk=113280&T=0

[TABLE]
[ROW][C]Summary of computational transaction[/C][/ROW]
[ROW][C]Raw Input[/C][C]view raw input (R code) [/C][/ROW]
[ROW][C]Raw Output[/C][C]view raw output of R engine [/C][/ROW]
[ROW][C]Computing time[/C][C]2 seconds[/C][/ROW]
[ROW][C]R Server[/C][C]'Sir Ronald Aylmer Fisher' @ 193.190.124.24[/C][/ROW]
[/TABLE]
Source: https://freestatistics.org/blog/index.php?pk=113280&T=0

Globally Unique Identifier (entire table): ba.freestatistics.org/blog/index.php?pk=113280&T=0

As an alternative you can also use a QR Code:  

The GUIDs for individual cells are displayed in the table below:

Summary of computational transaction
Raw Inputview raw input (R code)
Raw Outputview raw output of R engine
Computing time2 seconds
R Server'Sir Ronald Aylmer Fisher' @ 193.190.124.24


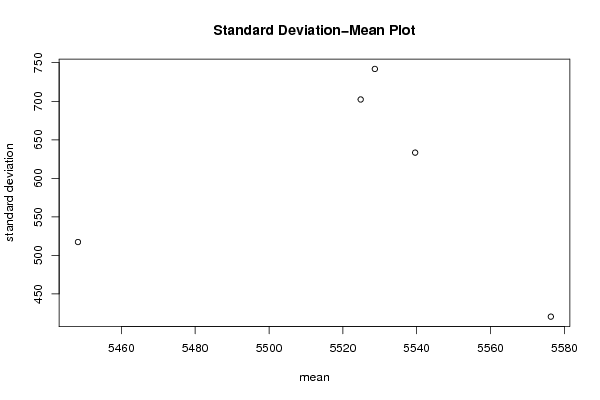
Standard Deviation-Mean Plot
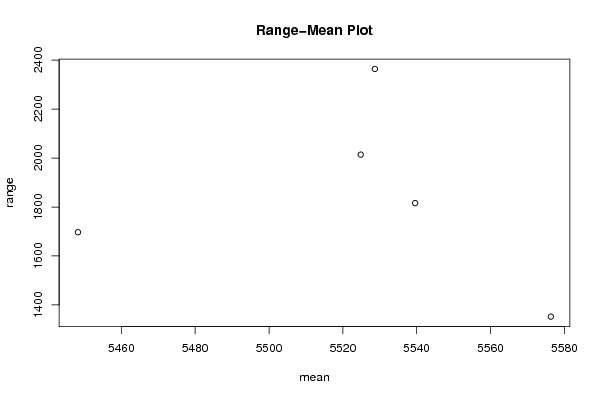
SectionMeanStandard DeviationRange
15524.83333333333702.3183470521472014
25539.58333333333633.3500336713621816
35528.66666666667741.9397590509662364
45576.33333333333420.4976128639051352
55448.25517.3493851969251697

\begin{tabular}{lllllllll}
\hline
Standard Deviation-Mean Plot \tabularnewline
Section & Mean & Standard Deviation & Range \tabularnewline
1 & 5524.83333333333 & 702.318347052147 & 2014 \tabularnewline
2 & 5539.58333333333 & 633.350033671362 & 1816 \tabularnewline
3 & 5528.66666666667 & 741.939759050966 & 2364 \tabularnewline
4 & 5576.33333333333 & 420.497612863905 & 1352 \tabularnewline
5 & 5448.25 & 517.349385196925 & 1697 \tabularnewline
\hline
\end{tabular}
%Source: https://freestatistics.org/blog/index.php?pk=113280&T=1

[TABLE]
[ROW][C]Standard Deviation-Mean Plot[/C][/ROW]
[ROW][C]Section[/C][C]Mean[/C][C]Standard Deviation[/C][C]Range[/C][/ROW]
[ROW][C]1[/C][C]5524.83333333333[/C][C]702.318347052147[/C][C]2014[/C][/ROW]
[ROW][C]2[/C][C]5539.58333333333[/C][C]633.350033671362[/C][C]1816[/C][/ROW]
[ROW][C]3[/C][C]5528.66666666667[/C][C]741.939759050966[/C][C]2364[/C][/ROW]
[ROW][C]4[/C][C]5576.33333333333[/C][C]420.497612863905[/C][C]1352[/C][/ROW]
[ROW][C]5[/C][C]5448.25[/C][C]517.349385196925[/C][C]1697[/C][/ROW]
[/TABLE]
Source: https://freestatistics.org/blog/index.php?pk=113280&T=1

Globally Unique Identifier (entire table): ba.freestatistics.org/blog/index.php?pk=113280&T=1

As an alternative you can also use a QR Code:  

The GUIDs for individual cells are displayed in the table below:

Standard Deviation-Mean Plot
SectionMeanStandard DeviationRange
15524.83333333333702.3183470521472014
25539.58333333333633.3500336713621816
35528.66666666667741.9397590509662364
45576.33333333333420.4976128639051352
55448.25517.3493851969251697


Regression: S.E.(k) = alpha + beta * Mean(k)
alpha1777.55603629227
beta-0.212629296837509
S.D.1.6377607911128
T-STAT-0.129829275429799
p-value0.904917509827751

\begin{tabular}{lllllllll}
\hline
Regression: S.E.(k) = alpha + beta * Mean(k) \tabularnewline
alpha & 1777.55603629227 \tabularnewline
beta & -0.212629296837509 \tabularnewline
S.D. & 1.6377607911128 \tabularnewline
T-STAT & -0.129829275429799 \tabularnewline
p-value & 0.904917509827751 \tabularnewline
\hline
\end{tabular}
%Source: https://freestatistics.org/blog/index.php?pk=113280&T=2

[TABLE]
[ROW][C]Regression: S.E.(k) = alpha + beta * Mean(k)[/C][/ROW]
[ROW][C]alpha[/C][C]1777.55603629227[/C][/ROW]
[ROW][C]beta[/C][C]-0.212629296837509[/C][/ROW]
[ROW][C]S.D.[/C][C]1.6377607911128[/C][/ROW]
[ROW][C]T-STAT[/C][C]-0.129829275429799[/C][/ROW]
[ROW][C]p-value[/C][C]0.904917509827751[/C][/ROW]
[/TABLE]
Source: https://freestatistics.org/blog/index.php?pk=113280&T=2

Globally Unique Identifier (entire table): ba.freestatistics.org/blog/index.php?pk=113280&T=2

As an alternative you can also use a QR Code:  

The GUIDs for individual cells are displayed in the table below:

Regression: S.E.(k) = alpha + beta * Mean(k)
alpha1777.55603629227
beta-0.212629296837509
S.D.1.6377607911128
T-STAT-0.129829275429799
p-value0.904917509827751


Regression: ln S.E.(k) = alpha + beta * ln Mean(k)
alpha35.0601673216983
beta-3.32831047999671
S.D.15.8315371595256
T-STAT-0.210232932308415
p-value0.846954717958304
Lambda4.32831047999671

\begin{tabular}{lllllllll}
\hline
Regression: ln S.E.(k) = alpha + beta * ln Mean(k) \tabularnewline
alpha & 35.0601673216983 \tabularnewline
beta & -3.32831047999671 \tabularnewline
S.D. & 15.8315371595256 \tabularnewline
T-STAT & -0.210232932308415 \tabularnewline
p-value & 0.846954717958304 \tabularnewline
Lambda & 4.32831047999671 \tabularnewline
\hline
\end{tabular}
%Source: https://freestatistics.org/blog/index.php?pk=113280&T=3

[TABLE]
[ROW][C]Regression: ln S.E.(k) = alpha + beta * ln Mean(k)[/C][/ROW]
[ROW][C]alpha[/C][C]35.0601673216983[/C][/ROW]
[ROW][C]beta[/C][C]-3.32831047999671[/C][/ROW]
[ROW][C]S.D.[/C][C]15.8315371595256[/C][/ROW]
[ROW][C]T-STAT[/C][C]-0.210232932308415[/C][/ROW]
[ROW][C]p-value[/C][C]0.846954717958304[/C][/ROW]
[ROW][C]Lambda[/C][C]4.32831047999671[/C][/ROW]
[/TABLE]
Source: https://freestatistics.org/blog/index.php?pk=113280&T=3

Globally Unique Identifier (entire table): ba.freestatistics.org/blog/index.php?pk=113280&T=3

As an alternative you can also use a QR Code:  

The GUIDs for individual cells are displayed in the table below:

Regression: ln S.E.(k) = alpha + beta * ln Mean(k)
alpha35.0601673216983
beta-3.32831047999671
S.D.15.8315371595256
T-STAT-0.210232932308415
p-value0.846954717958304
Lambda4.32831047999671


Parameters (Session):
par1 = 12 ;
Parameters (R input):
par1 = 12 ;
R code (references can be found in the software module):
par1 <- as.numeric(par1)
(n <- length(x))
(np <- floor(n / par1))
arr <- array(NA,dim=c(par1,np))
j <- 0
k <- 1
for (i in 1:(np*par1))
{
j = j + 1
arr[j,k] <- x[i]
if (j == par1) {
j = 0
k=k+1
}
}
arr
arr.mean <- array(NA,dim=np)
arr.sd <- array(NA,dim=np)
arr.range <- array(NA,dim=np)
for (j in 1:np)
{
arr.mean[j] <- mean(arr[,j],na.rm=TRUE)
arr.sd[j] <- sd(arr[,j],na.rm=TRUE)
arr.range[j] <- max(arr[,j],na.rm=TRUE) - min(arr[,j],na.rm=TRUE)
}
arr.mean
arr.sd
arr.range
(lm1 <- lm(arr.sd~arr.mean))
(lnlm1 <- lm(log(arr.sd)~log(arr.mean)))
(lm2 <- lm(arr.range~arr.mean))
bitmap(file='test1.png')
plot(arr.mean,arr.sd,main='Standard Deviation-Mean Plot',xlab='mean',ylab='standard deviation')
dev.off()
bitmap(file='test2.png')
plot(arr.mean,arr.range,main='Range-Mean Plot',xlab='mean',ylab='range')
dev.off()
load(file='createtable')
a<-table.start()
a<-table.row.start(a)
a<-table.element(a,'Standard Deviation-Mean Plot',4,TRUE)
a<-table.row.end(a)
a<-table.row.start(a)
a<-table.element(a,'Section',header=TRUE)
a<-table.element(a,'Mean',header=TRUE)
a<-table.element(a,'Standard Deviation',header=TRUE)
a<-table.element(a,'Range',header=TRUE)
a<-table.row.end(a)
for (j in 1:np) {
a<-table.row.start(a)
a<-table.element(a,j,header=TRUE)
a<-table.element(a,arr.mean[j])
a<-table.element(a,arr.sd[j] )
a<-table.element(a,arr.range[j] )
a<-table.row.end(a)
}
a<-table.end(a)
table.save(a,file='mytable.tab')
a<-table.start()
a<-table.row.start(a)
a<-table.element(a,'Regression: S.E.(k) = alpha + beta * Mean(k)',2,TRUE)
a<-table.row.end(a)
a<-table.row.start(a)
a<-table.element(a,'alpha',header=TRUE)
a<-table.element(a,lm1$coefficients[[1]])
a<-table.row.end(a)
a<-table.row.start(a)
a<-table.element(a,'beta',header=TRUE)
a<-table.element(a,lm1$coefficients[[2]])
a<-table.row.end(a)
a<-table.row.start(a)
a<-table.element(a,'S.D.',header=TRUE)
a<-table.element(a,summary(lm1)$coefficients[2,2])
a<-table.row.end(a)
a<-table.row.start(a)
a<-table.element(a,'T-STAT',header=TRUE)
a<-table.element(a,summary(lm1)$coefficients[2,3])
a<-table.row.end(a)
a<-table.row.start(a)
a<-table.element(a,'p-value',header=TRUE)
a<-table.element(a,summary(lm1)$coefficients[2,4])
a<-table.row.end(a)
a<-table.end(a)
table.save(a,file='mytable1.tab')
a<-table.start()
a<-table.row.start(a)
a<-table.element(a,'Regression: ln S.E.(k) = alpha + beta * ln Mean(k)',2,TRUE)
a<-table.row.end(a)
a<-table.row.start(a)
a<-table.element(a,'alpha',header=TRUE)
a<-table.element(a,lnlm1$coefficients[[1]])
a<-table.row.end(a)
a<-table.row.start(a)
a<-table.element(a,'beta',header=TRUE)
a<-table.element(a,lnlm1$coefficients[[2]])
a<-table.row.end(a)
a<-table.row.start(a)
a<-table.element(a,'S.D.',header=TRUE)
a<-table.element(a,summary(lnlm1)$coefficients[2,2])
a<-table.row.end(a)
a<-table.row.start(a)
a<-table.element(a,'T-STAT',header=TRUE)
a<-table.element(a,summary(lnlm1)$coefficients[2,3])
a<-table.row.end(a)
a<-table.row.start(a)
a<-table.element(a,'p-value',header=TRUE)
a<-table.element(a,summary(lnlm1)$coefficients[2,4])
a<-table.row.end(a)
a<-table.row.start(a)
a<-table.element(a,'Lambda',header=TRUE)
a<-table.element(a,1-lnlm1$coefficients[[2]])
a<-table.row.end(a)
a<-table.end(a)
table.save(a,file='mytable2.tab')