Free Statistics

of Irreproducible Research!

Author's title

Author*The author of this computation has been verified*
R Software Modulerwasp_multipleregression.wasp
Title produced by softwareMultiple Regression
Date of computationMon, 20 Dec 2010 22:02:17 +0000
Cite this page as followsStatistical Computations at FreeStatistics.org, Office for Research Development and Education, URL https://freestatistics.org/blog/index.php?v=date/2010/Dec/20/t1292882794srjono6w8l2nf8z.htm/, Retrieved Fri, 03 May 2024 23:20:56 +0000
Statistical Computations at FreeStatistics.org, Office for Research Development and Education, URL https://freestatistics.org/blog/index.php?pk=113152, Retrieved Fri, 03 May 2024 23:20:56 +0000
QR Codes:

Original text written by user:
IsPrivate?No (this computation is public)
User-defined keywords
Estimated Impact147
Family? (F = Feedback message, R = changed R code, M = changed R Module, P = changed Parameters, D = changed Data)
-     [Multiple Regression] [] [2010-11-17 09:55:05] [b98453cac15ba1066b407e146608df68]
-   PD  [Multiple Regression] [Multiple Regressi...] [2010-11-23 23:46:10] [b8e188bcc949964bed729335b3416734]
-   PD    [Multiple Regression] [Werkloosheid] [2010-11-29 23:29:58] [b8e188bcc949964bed729335b3416734]
-    D      [Multiple Regression] [ACF Nieuwbouw] [2010-12-18 23:41:03] [b8e188bcc949964bed729335b3416734]
-   P           [Multiple Regression] [Regression Analys...] [2010-12-20 22:02:17] [278a0539dc236556c5f30b5bc56ff9eb] [Current]
Feedback Forum

Post a new message
Dataseries X:
4143
4429
5219
4929
5761
5592
4163
4962
5208
4755
4491
5732
5731
5040
6102
4904
5369
5578
4619
4731
5011
5299
4146
4625
4736
4219
5116
4205
4121
5103
4300
4578
3809
5657
4248
3830
4736
4839
4411
4570
4104
4801
3953
3828
4440
4026
4109
4785
3224
3552
3940
3913
3681
4309
3830
4143
4087
3818
3380
3430
3458
3970
5260
5024
5634
6549
4676


Summary of computational transaction
Raw Inputview raw input (R code)
Raw Outputview raw output of R engine
Computing time5 seconds
R Server'RServer@AstonUniversity' @ vre.aston.ac.uk

\begin{tabular}{lllllllll}
\hline
Summary of computational transaction \tabularnewline
Raw Input & view raw input (R code)  \tabularnewline
Raw Output & view raw output of R engine  \tabularnewline
Computing time & 5 seconds \tabularnewline
R Server & 'RServer@AstonUniversity' @ vre.aston.ac.uk \tabularnewline
\hline
\end{tabular}
%Source: https://freestatistics.org/blog/index.php?pk=113152&T=0

[TABLE]
[ROW][C]Summary of computational transaction[/C][/ROW]
[ROW][C]Raw Input[/C][C]view raw input (R code) [/C][/ROW]
[ROW][C]Raw Output[/C][C]view raw output of R engine [/C][/ROW]
[ROW][C]Computing time[/C][C]5 seconds[/C][/ROW]
[ROW][C]R Server[/C][C]'RServer@AstonUniversity' @ vre.aston.ac.uk[/C][/ROW]
[/TABLE]
Source: https://freestatistics.org/blog/index.php?pk=113152&T=0

Globally Unique Identifier (entire table): ba.freestatistics.org/blog/index.php?pk=113152&T=0

As an alternative you can also use a QR Code:  

The GUIDs for individual cells are displayed in the table below:

Summary of computational transaction
Raw Inputview raw input (R code)
Raw Outputview raw output of R engine
Computing time5 seconds
R Server'RServer@AstonUniversity' @ vre.aston.ac.uk


Multiple Linear Regression - Estimated Regression Equation
nb[t] = + 5017.8 -217.03888888889M1[t] -198.611111111111M2[t] + 482.816666666667M3[t] + 80.5777777777779M4[t] + 283.005555555556M5[t] + 841.6M6[t] -208.638888888889M7[t] -91.711111111111M8[t] -14.1833333333332M9[t] + 200.744444444445M10[t] -420.527777777778M11[t] -14.9277777777778t + e[t]

\begin{tabular}{lllllllll}
\hline
Multiple Linear Regression - Estimated Regression Equation \tabularnewline
nb[t] =  +  5017.8 -217.03888888889M1[t] -198.611111111111M2[t] +  482.816666666667M3[t] +  80.5777777777779M4[t] +  283.005555555556M5[t] +  841.6M6[t] -208.638888888889M7[t] -91.711111111111M8[t] -14.1833333333332M9[t] +  200.744444444445M10[t] -420.527777777778M11[t] -14.9277777777778t  + e[t] \tabularnewline
\hline
\end{tabular}
%Source: https://freestatistics.org/blog/index.php?pk=113152&T=1

[TABLE]
[ROW][C]Multiple Linear Regression - Estimated Regression Equation[/C][/ROW]
[ROW][C]nb[t] =  +  5017.8 -217.03888888889M1[t] -198.611111111111M2[t] +  482.816666666667M3[t] +  80.5777777777779M4[t] +  283.005555555556M5[t] +  841.6M6[t] -208.638888888889M7[t] -91.711111111111M8[t] -14.1833333333332M9[t] +  200.744444444445M10[t] -420.527777777778M11[t] -14.9277777777778t  + e[t][/C][/ROW]
[/TABLE]
Source: https://freestatistics.org/blog/index.php?pk=113152&T=1

Globally Unique Identifier (entire table): ba.freestatistics.org/blog/index.php?pk=113152&T=1

As an alternative you can also use a QR Code:  

The GUIDs for individual cells are displayed in the table below:

Multiple Linear Regression - Estimated Regression Equation
nb[t] = + 5017.8 -217.03888888889M1[t] -198.611111111111M2[t] + 482.816666666667M3[t] + 80.5777777777779M4[t] + 283.005555555556M5[t] + 841.6M6[t] -208.638888888889M7[t] -91.711111111111M8[t] -14.1833333333332M9[t] + 200.744444444445M10[t] -420.527777777778M11[t] -14.9277777777778t + e[t]


Multiple Linear Regression - Ordinary Least Squares
VariableParameterS.D.T-STATH0: parameter = 02-tail p-value1-tail p-value
(Intercept)5017.8309.37999416.218900
M1-217.03888888889373.570937-0.5810.5636680.281834
M2-198.611111111111373.386826-0.53190.5969650.298482
M3482.816666666667373.2435661.29360.201320.10066
M480.5777777777779373.1412040.21590.8298450.414922
M5283.005555555556373.0797730.75860.4514110.225705
M6841.6373.0592942.25590.0281470.014073
M7-208.638888888889373.079773-0.55920.5783140.289157
M8-91.711111111111389.961324-0.23520.8149590.407479
M9-14.1833333333332389.824155-0.03640.971110.485555
M10200.744444444445389.7261480.51510.6085920.304296
M11-420.527777777778389.667332-1.07920.2852970.142648
t-14.92777777777783.909006-3.81880.0003480.000174

\begin{tabular}{lllllllll}
\hline
Multiple Linear Regression - Ordinary Least Squares \tabularnewline
Variable & Parameter & S.D. & T-STATH0: parameter = 0 & 2-tail p-value & 1-tail p-value \tabularnewline
(Intercept) & 5017.8 & 309.379994 & 16.2189 & 0 & 0 \tabularnewline
M1 & -217.03888888889 & 373.570937 & -0.581 & 0.563668 & 0.281834 \tabularnewline
M2 & -198.611111111111 & 373.386826 & -0.5319 & 0.596965 & 0.298482 \tabularnewline
M3 & 482.816666666667 & 373.243566 & 1.2936 & 0.20132 & 0.10066 \tabularnewline
M4 & 80.5777777777779 & 373.141204 & 0.2159 & 0.829845 & 0.414922 \tabularnewline
M5 & 283.005555555556 & 373.079773 & 0.7586 & 0.451411 & 0.225705 \tabularnewline
M6 & 841.6 & 373.059294 & 2.2559 & 0.028147 & 0.014073 \tabularnewline
M7 & -208.638888888889 & 373.079773 & -0.5592 & 0.578314 & 0.289157 \tabularnewline
M8 & -91.711111111111 & 389.961324 & -0.2352 & 0.814959 & 0.407479 \tabularnewline
M9 & -14.1833333333332 & 389.824155 & -0.0364 & 0.97111 & 0.485555 \tabularnewline
M10 & 200.744444444445 & 389.726148 & 0.5151 & 0.608592 & 0.304296 \tabularnewline
M11 & -420.527777777778 & 389.667332 & -1.0792 & 0.285297 & 0.142648 \tabularnewline
t & -14.9277777777778 & 3.909006 & -3.8188 & 0.000348 & 0.000174 \tabularnewline
\hline
\end{tabular}
%Source: https://freestatistics.org/blog/index.php?pk=113152&T=2

[TABLE]
[ROW][C]Multiple Linear Regression - Ordinary Least Squares[/C][/ROW]
[ROW][C]Variable[/C][C]Parameter[/C][C]S.D.[/C][C]T-STATH0: parameter = 0[/C][C]2-tail p-value[/C][C]1-tail p-value[/C][/ROW]
[ROW][C](Intercept)[/C][C]5017.8[/C][C]309.379994[/C][C]16.2189[/C][C]0[/C][C]0[/C][/ROW]
[ROW][C]M1[/C][C]-217.03888888889[/C][C]373.570937[/C][C]-0.581[/C][C]0.563668[/C][C]0.281834[/C][/ROW]
[ROW][C]M2[/C][C]-198.611111111111[/C][C]373.386826[/C][C]-0.5319[/C][C]0.596965[/C][C]0.298482[/C][/ROW]
[ROW][C]M3[/C][C]482.816666666667[/C][C]373.243566[/C][C]1.2936[/C][C]0.20132[/C][C]0.10066[/C][/ROW]
[ROW][C]M4[/C][C]80.5777777777779[/C][C]373.141204[/C][C]0.2159[/C][C]0.829845[/C][C]0.414922[/C][/ROW]
[ROW][C]M5[/C][C]283.005555555556[/C][C]373.079773[/C][C]0.7586[/C][C]0.451411[/C][C]0.225705[/C][/ROW]
[ROW][C]M6[/C][C]841.6[/C][C]373.059294[/C][C]2.2559[/C][C]0.028147[/C][C]0.014073[/C][/ROW]
[ROW][C]M7[/C][C]-208.638888888889[/C][C]373.079773[/C][C]-0.5592[/C][C]0.578314[/C][C]0.289157[/C][/ROW]
[ROW][C]M8[/C][C]-91.711111111111[/C][C]389.961324[/C][C]-0.2352[/C][C]0.814959[/C][C]0.407479[/C][/ROW]
[ROW][C]M9[/C][C]-14.1833333333332[/C][C]389.824155[/C][C]-0.0364[/C][C]0.97111[/C][C]0.485555[/C][/ROW]
[ROW][C]M10[/C][C]200.744444444445[/C][C]389.726148[/C][C]0.5151[/C][C]0.608592[/C][C]0.304296[/C][/ROW]
[ROW][C]M11[/C][C]-420.527777777778[/C][C]389.667332[/C][C]-1.0792[/C][C]0.285297[/C][C]0.142648[/C][/ROW]
[ROW][C]t[/C][C]-14.9277777777778[/C][C]3.909006[/C][C]-3.8188[/C][C]0.000348[/C][C]0.000174[/C][/ROW]
[/TABLE]
Source: https://freestatistics.org/blog/index.php?pk=113152&T=2

Globally Unique Identifier (entire table): ba.freestatistics.org/blog/index.php?pk=113152&T=2

As an alternative you can also use a QR Code:  

The GUIDs for individual cells are displayed in the table below:

Multiple Linear Regression - Ordinary Least Squares
VariableParameterS.D.T-STATH0: parameter = 02-tail p-value1-tail p-value
(Intercept)5017.8309.37999416.218900
M1-217.03888888889373.570937-0.5810.5636680.281834
M2-198.611111111111373.386826-0.53190.5969650.298482
M3482.816666666667373.2435661.29360.201320.10066
M480.5777777777779373.1412040.21590.8298450.414922
M5283.005555555556373.0797730.75860.4514110.225705
M6841.6373.0592942.25590.0281470.014073
M7-208.638888888889373.079773-0.55920.5783140.289157
M8-91.711111111111389.961324-0.23520.8149590.407479
M9-14.1833333333332389.824155-0.03640.971110.485555
M10200.744444444445389.7261480.51510.6085920.304296
M11-420.527777777778389.667332-1.07920.2852970.142648
t-14.92777777777783.909006-3.81880.0003480.000174


Multiple Linear Regression - Regression Statistics
Multiple R0.623207054194961
R-squared0.388387032398361
Adjusted R-squared0.252473039597996
F-TEST (value)2.85759416227907
F-TEST (DF numerator)12
F-TEST (DF denominator)54
p-value0.00413501323506293
Multiple Linear Regression - Residual Statistics
Residual Standard Deviation616.087147114356
Sum Squared Residuals20496422.1333333

\begin{tabular}{lllllllll}
\hline
Multiple Linear Regression - Regression Statistics \tabularnewline
Multiple R & 0.623207054194961 \tabularnewline
R-squared & 0.388387032398361 \tabularnewline
Adjusted R-squared & 0.252473039597996 \tabularnewline
F-TEST (value) & 2.85759416227907 \tabularnewline
F-TEST (DF numerator) & 12 \tabularnewline
F-TEST (DF denominator) & 54 \tabularnewline
p-value & 0.00413501323506293 \tabularnewline
Multiple Linear Regression - Residual Statistics \tabularnewline
Residual Standard Deviation & 616.087147114356 \tabularnewline
Sum Squared Residuals & 20496422.1333333 \tabularnewline
\hline
\end{tabular}
%Source: https://freestatistics.org/blog/index.php?pk=113152&T=3

[TABLE]
[ROW][C]Multiple Linear Regression - Regression Statistics[/C][/ROW]
[ROW][C]Multiple R[/C][C]0.623207054194961[/C][/ROW]
[ROW][C]R-squared[/C][C]0.388387032398361[/C][/ROW]
[ROW][C]Adjusted R-squared[/C][C]0.252473039597996[/C][/ROW]
[ROW][C]F-TEST (value)[/C][C]2.85759416227907[/C][/ROW]
[ROW][C]F-TEST (DF numerator)[/C][C]12[/C][/ROW]
[ROW][C]F-TEST (DF denominator)[/C][C]54[/C][/ROW]
[ROW][C]p-value[/C][C]0.00413501323506293[/C][/ROW]
[ROW][C]Multiple Linear Regression - Residual Statistics[/C][/ROW]
[ROW][C]Residual Standard Deviation[/C][C]616.087147114356[/C][/ROW]
[ROW][C]Sum Squared Residuals[/C][C]20496422.1333333[/C][/ROW]
[/TABLE]
Source: https://freestatistics.org/blog/index.php?pk=113152&T=3

Globally Unique Identifier (entire table): ba.freestatistics.org/blog/index.php?pk=113152&T=3

As an alternative you can also use a QR Code:  

The GUIDs for individual cells are displayed in the table below:

Multiple Linear Regression - Regression Statistics
Multiple R0.623207054194961
R-squared0.388387032398361
Adjusted R-squared0.252473039597996
F-TEST (value)2.85759416227907
F-TEST (DF numerator)12
F-TEST (DF denominator)54
p-value0.00413501323506293
Multiple Linear Regression - Residual Statistics
Residual Standard Deviation616.087147114356
Sum Squared Residuals20496422.1333333


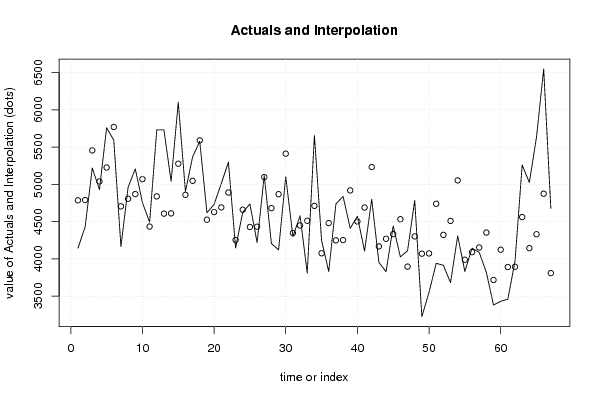
Multiple Linear Regression - Actuals, Interpolation, and Residuals
Time or IndexActualsInterpolationForecastResidualsPrediction Error
141434785.83333333334-642.833333333337
244294789.33333333333-360.333333333333
352195455.83333333333-236.833333333334
449295038.66666666667-109.666666666667
557615226.16666666667534.833333333334
655925769.83333333333-177.833333333333
741634704.66666666667-541.666666666667
849624806.66666666667155.333333333333
952084869.26666666667338.733333333333
1047555069.26666666667-314.266666666666
1144914433.0666666666757.9333333333332
1257324838.66666666667893.333333333334
1357314606.71124.3
1450404610.2429.8
1561025276.7825.3
1649044859.5333333333344.4666666666668
1753695047.03333333333321.966666666667
1855785590.7-12.6999999999999
1946194525.5333333333393.466666666667
2047314627.53333333333103.466666666667
2150114690.13333333333320.866666666667
2252994890.13333333333408.866666666667
2341464253.93333333333-107.933333333333
2446254659.53333333333-34.5333333333332
2547364427.56666666667308.433333333334
2642194431.06666666667-212.066666666667
2751165097.5666666666718.4333333333333
2842054680.4-475.4
2941214867.9-746.9
3051035411.56666666667-308.566666666667
3143004346.4-46.3999999999999
3245784448.4129.6
3338094511-702
3456574711946
3542484074.8173.2
3638304480.4-650.4
3747364248.43333333333487.566666666668
3848394251.93333333333587.066666666667
3944114918.43333333333-507.433333333333
4045704501.2666666666768.7333333333333
4141044688.76666666667-584.766666666667
4248015232.43333333333-431.433333333333
4339534167.26666666667-214.266666666666
4438284269.26666666667-441.266666666667
4544404331.86666666667108.133333333333
4640264531.86666666667-505.866666666667
4741093895.66666666667213.333333333333
4847854301.26666666667483.733333333333
4932244069.3-845.299999999999
5035524072.8-520.8
5139404739.3-799.3
5239134322.13333333333-409.133333333333
5336814509.63333333333-828.633333333334
5443095053.3-744.3
5538303988.13333333333-158.133333333333
5641434090.1333333333352.8666666666665
5740874152.73333333333-65.7333333333335
5838184352.73333333333-534.733333333334
5933803716.53333333333-336.533333333334
6034304122.13333333333-692.133333333333
6134583890.16666666667-432.166666666666
6239703893.6666666666776.3333333333334
6352604560.16666666667699.833333333333
6450244143881
6556344330.51303.5
6665494874.166666666671674.83333333333
6746763809867

\begin{tabular}{lllllllll}
\hline
Multiple Linear Regression - Actuals, Interpolation, and Residuals \tabularnewline
Time or Index & Actuals & InterpolationForecast & ResidualsPrediction Error \tabularnewline
1 & 4143 & 4785.83333333334 & -642.833333333337 \tabularnewline
2 & 4429 & 4789.33333333333 & -360.333333333333 \tabularnewline
3 & 5219 & 5455.83333333333 & -236.833333333334 \tabularnewline
4 & 4929 & 5038.66666666667 & -109.666666666667 \tabularnewline
5 & 5761 & 5226.16666666667 & 534.833333333334 \tabularnewline
6 & 5592 & 5769.83333333333 & -177.833333333333 \tabularnewline
7 & 4163 & 4704.66666666667 & -541.666666666667 \tabularnewline
8 & 4962 & 4806.66666666667 & 155.333333333333 \tabularnewline
9 & 5208 & 4869.26666666667 & 338.733333333333 \tabularnewline
10 & 4755 & 5069.26666666667 & -314.266666666666 \tabularnewline
11 & 4491 & 4433.06666666667 & 57.9333333333332 \tabularnewline
12 & 5732 & 4838.66666666667 & 893.333333333334 \tabularnewline
13 & 5731 & 4606.7 & 1124.3 \tabularnewline
14 & 5040 & 4610.2 & 429.8 \tabularnewline
15 & 6102 & 5276.7 & 825.3 \tabularnewline
16 & 4904 & 4859.53333333333 & 44.4666666666668 \tabularnewline
17 & 5369 & 5047.03333333333 & 321.966666666667 \tabularnewline
18 & 5578 & 5590.7 & -12.6999999999999 \tabularnewline
19 & 4619 & 4525.53333333333 & 93.466666666667 \tabularnewline
20 & 4731 & 4627.53333333333 & 103.466666666667 \tabularnewline
21 & 5011 & 4690.13333333333 & 320.866666666667 \tabularnewline
22 & 5299 & 4890.13333333333 & 408.866666666667 \tabularnewline
23 & 4146 & 4253.93333333333 & -107.933333333333 \tabularnewline
24 & 4625 & 4659.53333333333 & -34.5333333333332 \tabularnewline
25 & 4736 & 4427.56666666667 & 308.433333333334 \tabularnewline
26 & 4219 & 4431.06666666667 & -212.066666666667 \tabularnewline
27 & 5116 & 5097.56666666667 & 18.4333333333333 \tabularnewline
28 & 4205 & 4680.4 & -475.4 \tabularnewline
29 & 4121 & 4867.9 & -746.9 \tabularnewline
30 & 5103 & 5411.56666666667 & -308.566666666667 \tabularnewline
31 & 4300 & 4346.4 & -46.3999999999999 \tabularnewline
32 & 4578 & 4448.4 & 129.6 \tabularnewline
33 & 3809 & 4511 & -702 \tabularnewline
34 & 5657 & 4711 & 946 \tabularnewline
35 & 4248 & 4074.8 & 173.2 \tabularnewline
36 & 3830 & 4480.4 & -650.4 \tabularnewline
37 & 4736 & 4248.43333333333 & 487.566666666668 \tabularnewline
38 & 4839 & 4251.93333333333 & 587.066666666667 \tabularnewline
39 & 4411 & 4918.43333333333 & -507.433333333333 \tabularnewline
40 & 4570 & 4501.26666666667 & 68.7333333333333 \tabularnewline
41 & 4104 & 4688.76666666667 & -584.766666666667 \tabularnewline
42 & 4801 & 5232.43333333333 & -431.433333333333 \tabularnewline
43 & 3953 & 4167.26666666667 & -214.266666666666 \tabularnewline
44 & 3828 & 4269.26666666667 & -441.266666666667 \tabularnewline
45 & 4440 & 4331.86666666667 & 108.133333333333 \tabularnewline
46 & 4026 & 4531.86666666667 & -505.866666666667 \tabularnewline
47 & 4109 & 3895.66666666667 & 213.333333333333 \tabularnewline
48 & 4785 & 4301.26666666667 & 483.733333333333 \tabularnewline
49 & 3224 & 4069.3 & -845.299999999999 \tabularnewline
50 & 3552 & 4072.8 & -520.8 \tabularnewline
51 & 3940 & 4739.3 & -799.3 \tabularnewline
52 & 3913 & 4322.13333333333 & -409.133333333333 \tabularnewline
53 & 3681 & 4509.63333333333 & -828.633333333334 \tabularnewline
54 & 4309 & 5053.3 & -744.3 \tabularnewline
55 & 3830 & 3988.13333333333 & -158.133333333333 \tabularnewline
56 & 4143 & 4090.13333333333 & 52.8666666666665 \tabularnewline
57 & 4087 & 4152.73333333333 & -65.7333333333335 \tabularnewline
58 & 3818 & 4352.73333333333 & -534.733333333334 \tabularnewline
59 & 3380 & 3716.53333333333 & -336.533333333334 \tabularnewline
60 & 3430 & 4122.13333333333 & -692.133333333333 \tabularnewline
61 & 3458 & 3890.16666666667 & -432.166666666666 \tabularnewline
62 & 3970 & 3893.66666666667 & 76.3333333333334 \tabularnewline
63 & 5260 & 4560.16666666667 & 699.833333333333 \tabularnewline
64 & 5024 & 4143 & 881 \tabularnewline
65 & 5634 & 4330.5 & 1303.5 \tabularnewline
66 & 6549 & 4874.16666666667 & 1674.83333333333 \tabularnewline
67 & 4676 & 3809 & 867 \tabularnewline
\hline
\end{tabular}
%Source: https://freestatistics.org/blog/index.php?pk=113152&T=4

[TABLE]
[ROW][C]Multiple Linear Regression - Actuals, Interpolation, and Residuals[/C][/ROW]
[ROW][C]Time or Index[/C][C]Actuals[/C][C]InterpolationForecast[/C][C]ResidualsPrediction Error[/C][/ROW]
[ROW][C]1[/C][C]4143[/C][C]4785.83333333334[/C][C]-642.833333333337[/C][/ROW]
[ROW][C]2[/C][C]4429[/C][C]4789.33333333333[/C][C]-360.333333333333[/C][/ROW]
[ROW][C]3[/C][C]5219[/C][C]5455.83333333333[/C][C]-236.833333333334[/C][/ROW]
[ROW][C]4[/C][C]4929[/C][C]5038.66666666667[/C][C]-109.666666666667[/C][/ROW]
[ROW][C]5[/C][C]5761[/C][C]5226.16666666667[/C][C]534.833333333334[/C][/ROW]
[ROW][C]6[/C][C]5592[/C][C]5769.83333333333[/C][C]-177.833333333333[/C][/ROW]
[ROW][C]7[/C][C]4163[/C][C]4704.66666666667[/C][C]-541.666666666667[/C][/ROW]
[ROW][C]8[/C][C]4962[/C][C]4806.66666666667[/C][C]155.333333333333[/C][/ROW]
[ROW][C]9[/C][C]5208[/C][C]4869.26666666667[/C][C]338.733333333333[/C][/ROW]
[ROW][C]10[/C][C]4755[/C][C]5069.26666666667[/C][C]-314.266666666666[/C][/ROW]
[ROW][C]11[/C][C]4491[/C][C]4433.06666666667[/C][C]57.9333333333332[/C][/ROW]
[ROW][C]12[/C][C]5732[/C][C]4838.66666666667[/C][C]893.333333333334[/C][/ROW]
[ROW][C]13[/C][C]5731[/C][C]4606.7[/C][C]1124.3[/C][/ROW]
[ROW][C]14[/C][C]5040[/C][C]4610.2[/C][C]429.8[/C][/ROW]
[ROW][C]15[/C][C]6102[/C][C]5276.7[/C][C]825.3[/C][/ROW]
[ROW][C]16[/C][C]4904[/C][C]4859.53333333333[/C][C]44.4666666666668[/C][/ROW]
[ROW][C]17[/C][C]5369[/C][C]5047.03333333333[/C][C]321.966666666667[/C][/ROW]
[ROW][C]18[/C][C]5578[/C][C]5590.7[/C][C]-12.6999999999999[/C][/ROW]
[ROW][C]19[/C][C]4619[/C][C]4525.53333333333[/C][C]93.466666666667[/C][/ROW]
[ROW][C]20[/C][C]4731[/C][C]4627.53333333333[/C][C]103.466666666667[/C][/ROW]
[ROW][C]21[/C][C]5011[/C][C]4690.13333333333[/C][C]320.866666666667[/C][/ROW]
[ROW][C]22[/C][C]5299[/C][C]4890.13333333333[/C][C]408.866666666667[/C][/ROW]
[ROW][C]23[/C][C]4146[/C][C]4253.93333333333[/C][C]-107.933333333333[/C][/ROW]
[ROW][C]24[/C][C]4625[/C][C]4659.53333333333[/C][C]-34.5333333333332[/C][/ROW]
[ROW][C]25[/C][C]4736[/C][C]4427.56666666667[/C][C]308.433333333334[/C][/ROW]
[ROW][C]26[/C][C]4219[/C][C]4431.06666666667[/C][C]-212.066666666667[/C][/ROW]
[ROW][C]27[/C][C]5116[/C][C]5097.56666666667[/C][C]18.4333333333333[/C][/ROW]
[ROW][C]28[/C][C]4205[/C][C]4680.4[/C][C]-475.4[/C][/ROW]
[ROW][C]29[/C][C]4121[/C][C]4867.9[/C][C]-746.9[/C][/ROW]
[ROW][C]30[/C][C]5103[/C][C]5411.56666666667[/C][C]-308.566666666667[/C][/ROW]
[ROW][C]31[/C][C]4300[/C][C]4346.4[/C][C]-46.3999999999999[/C][/ROW]
[ROW][C]32[/C][C]4578[/C][C]4448.4[/C][C]129.6[/C][/ROW]
[ROW][C]33[/C][C]3809[/C][C]4511[/C][C]-702[/C][/ROW]
[ROW][C]34[/C][C]5657[/C][C]4711[/C][C]946[/C][/ROW]
[ROW][C]35[/C][C]4248[/C][C]4074.8[/C][C]173.2[/C][/ROW]
[ROW][C]36[/C][C]3830[/C][C]4480.4[/C][C]-650.4[/C][/ROW]
[ROW][C]37[/C][C]4736[/C][C]4248.43333333333[/C][C]487.566666666668[/C][/ROW]
[ROW][C]38[/C][C]4839[/C][C]4251.93333333333[/C][C]587.066666666667[/C][/ROW]
[ROW][C]39[/C][C]4411[/C][C]4918.43333333333[/C][C]-507.433333333333[/C][/ROW]
[ROW][C]40[/C][C]4570[/C][C]4501.26666666667[/C][C]68.7333333333333[/C][/ROW]
[ROW][C]41[/C][C]4104[/C][C]4688.76666666667[/C][C]-584.766666666667[/C][/ROW]
[ROW][C]42[/C][C]4801[/C][C]5232.43333333333[/C][C]-431.433333333333[/C][/ROW]
[ROW][C]43[/C][C]3953[/C][C]4167.26666666667[/C][C]-214.266666666666[/C][/ROW]
[ROW][C]44[/C][C]3828[/C][C]4269.26666666667[/C][C]-441.266666666667[/C][/ROW]
[ROW][C]45[/C][C]4440[/C][C]4331.86666666667[/C][C]108.133333333333[/C][/ROW]
[ROW][C]46[/C][C]4026[/C][C]4531.86666666667[/C][C]-505.866666666667[/C][/ROW]
[ROW][C]47[/C][C]4109[/C][C]3895.66666666667[/C][C]213.333333333333[/C][/ROW]
[ROW][C]48[/C][C]4785[/C][C]4301.26666666667[/C][C]483.733333333333[/C][/ROW]
[ROW][C]49[/C][C]3224[/C][C]4069.3[/C][C]-845.299999999999[/C][/ROW]
[ROW][C]50[/C][C]3552[/C][C]4072.8[/C][C]-520.8[/C][/ROW]
[ROW][C]51[/C][C]3940[/C][C]4739.3[/C][C]-799.3[/C][/ROW]
[ROW][C]52[/C][C]3913[/C][C]4322.13333333333[/C][C]-409.133333333333[/C][/ROW]
[ROW][C]53[/C][C]3681[/C][C]4509.63333333333[/C][C]-828.633333333334[/C][/ROW]
[ROW][C]54[/C][C]4309[/C][C]5053.3[/C][C]-744.3[/C][/ROW]
[ROW][C]55[/C][C]3830[/C][C]3988.13333333333[/C][C]-158.133333333333[/C][/ROW]
[ROW][C]56[/C][C]4143[/C][C]4090.13333333333[/C][C]52.8666666666665[/C][/ROW]
[ROW][C]57[/C][C]4087[/C][C]4152.73333333333[/C][C]-65.7333333333335[/C][/ROW]
[ROW][C]58[/C][C]3818[/C][C]4352.73333333333[/C][C]-534.733333333334[/C][/ROW]
[ROW][C]59[/C][C]3380[/C][C]3716.53333333333[/C][C]-336.533333333334[/C][/ROW]
[ROW][C]60[/C][C]3430[/C][C]4122.13333333333[/C][C]-692.133333333333[/C][/ROW]
[ROW][C]61[/C][C]3458[/C][C]3890.16666666667[/C][C]-432.166666666666[/C][/ROW]
[ROW][C]62[/C][C]3970[/C][C]3893.66666666667[/C][C]76.3333333333334[/C][/ROW]
[ROW][C]63[/C][C]5260[/C][C]4560.16666666667[/C][C]699.833333333333[/C][/ROW]
[ROW][C]64[/C][C]5024[/C][C]4143[/C][C]881[/C][/ROW]
[ROW][C]65[/C][C]5634[/C][C]4330.5[/C][C]1303.5[/C][/ROW]
[ROW][C]66[/C][C]6549[/C][C]4874.16666666667[/C][C]1674.83333333333[/C][/ROW]
[ROW][C]67[/C][C]4676[/C][C]3809[/C][C]867[/C][/ROW]
[/TABLE]
Source: https://freestatistics.org/blog/index.php?pk=113152&T=4

Globally Unique Identifier (entire table): ba.freestatistics.org/blog/index.php?pk=113152&T=4

As an alternative you can also use a QR Code:  

The GUIDs for individual cells are displayed in the table below:

Multiple Linear Regression - Actuals, Interpolation, and Residuals
Time or IndexActualsInterpolationForecastResidualsPrediction Error
141434785.83333333334-642.833333333337
244294789.33333333333-360.333333333333
352195455.83333333333-236.833333333334
449295038.66666666667-109.666666666667
557615226.16666666667534.833333333334
655925769.83333333333-177.833333333333
741634704.66666666667-541.666666666667
849624806.66666666667155.333333333333
952084869.26666666667338.733333333333
1047555069.26666666667-314.266666666666
1144914433.0666666666757.9333333333332
1257324838.66666666667893.333333333334
1357314606.71124.3
1450404610.2429.8
1561025276.7825.3
1649044859.5333333333344.4666666666668
1753695047.03333333333321.966666666667
1855785590.7-12.6999999999999
1946194525.5333333333393.466666666667
2047314627.53333333333103.466666666667
2150114690.13333333333320.866666666667
2252994890.13333333333408.866666666667
2341464253.93333333333-107.933333333333
2446254659.53333333333-34.5333333333332
2547364427.56666666667308.433333333334
2642194431.06666666667-212.066666666667
2751165097.5666666666718.4333333333333
2842054680.4-475.4
2941214867.9-746.9
3051035411.56666666667-308.566666666667
3143004346.4-46.3999999999999
3245784448.4129.6
3338094511-702
3456574711946
3542484074.8173.2
3638304480.4-650.4
3747364248.43333333333487.566666666668
3848394251.93333333333587.066666666667
3944114918.43333333333-507.433333333333
4045704501.2666666666768.7333333333333
4141044688.76666666667-584.766666666667
4248015232.43333333333-431.433333333333
4339534167.26666666667-214.266666666666
4438284269.26666666667-441.266666666667
4544404331.86666666667108.133333333333
4640264531.86666666667-505.866666666667
4741093895.66666666667213.333333333333
4847854301.26666666667483.733333333333
4932244069.3-845.299999999999
5035524072.8-520.8
5139404739.3-799.3
5239134322.13333333333-409.133333333333
5336814509.63333333333-828.633333333334
5443095053.3-744.3
5538303988.13333333333-158.133333333333
5641434090.1333333333352.8666666666665
5740874152.73333333333-65.7333333333335
5838184352.73333333333-534.733333333334
5933803716.53333333333-336.533333333334
6034304122.13333333333-692.133333333333
6134583890.16666666667-432.166666666666
6239703893.6666666666776.3333333333334
6352604560.16666666667699.833333333333
6450244143881
6556344330.51303.5
6665494874.166666666671674.83333333333
6746763809867


Goldfeld-Quandt test for Heteroskedasticity
p-valuesAlternative Hypothesis
breakpoint indexgreater2-sidedless
160.3492141705036550.6984283410073110.650785829496345
170.4299187306627450.859837461325490.570081269337255
180.327149853705240.654299707410480.67285014629476
190.2085139842039170.4170279684078340.791486015796083
200.1706398464787760.3412796929575530.829360153521223
210.1341606920299250.268321384059850.865839307970075
220.0880346800535080.1760693601070160.911965319946492
230.07122953780251960.1424590756050390.92877046219748
240.1385272421149390.2770544842298780.861472757885061
250.1124296410249360.2248592820498710.887570358975064
260.0927034201919130.1854068403838260.907296579808087
270.07686268675519360.1537253735103870.923137313244806
280.06399301074583840.1279860214916770.936006989254162
290.1069524872490690.2139049744981380.893047512750931
300.0712342052672730.1424684105345460.928765794732727
310.04579260222436360.09158520444872720.954207397775636
320.03005615347223570.06011230694447150.969943846527764
330.03487936317994750.06975872635989490.965120636820053
340.0817537946656850.163507589331370.918246205334315
350.06113804792832760.1222760958566550.938861952071672
360.06504002699636170.1300800539927230.934959973003638
370.101429205075580.2028584101511590.89857079492442
380.1706226908525410.3412453817050820.82937730914746
390.1471208472358740.2942416944717480.852879152764126
400.1235622198156620.2471244396313250.876437780184337
410.09341022610693270.1868204522138650.906589773893067
420.06050948668320760.1210189733664150.939490513316792
430.03933898340733360.07867796681466720.960661016592666
440.02541821328935890.05083642657871780.97458178671064
450.02003786403615460.04007572807230920.979962135963845
460.01875574147828740.03751148295657480.981244258521713
470.03010511939678220.06021023879356450.969894880603218
480.3622761382916420.7245522765832830.637723861708358
490.4934799007655180.9869598015310350.506520099234482
500.6199575498277790.7600849003444410.380042450172221
510.4688223881090590.9376447762181170.531177611890941

\begin{tabular}{lllllllll}
\hline
Goldfeld-Quandt test for Heteroskedasticity \tabularnewline
p-values & Alternative Hypothesis \tabularnewline
breakpoint index & greater & 2-sided & less \tabularnewline
16 & 0.349214170503655 & 0.698428341007311 & 0.650785829496345 \tabularnewline
17 & 0.429918730662745 & 0.85983746132549 & 0.570081269337255 \tabularnewline
18 & 0.32714985370524 & 0.65429970741048 & 0.67285014629476 \tabularnewline
19 & 0.208513984203917 & 0.417027968407834 & 0.791486015796083 \tabularnewline
20 & 0.170639846478776 & 0.341279692957553 & 0.829360153521223 \tabularnewline
21 & 0.134160692029925 & 0.26832138405985 & 0.865839307970075 \tabularnewline
22 & 0.088034680053508 & 0.176069360107016 & 0.911965319946492 \tabularnewline
23 & 0.0712295378025196 & 0.142459075605039 & 0.92877046219748 \tabularnewline
24 & 0.138527242114939 & 0.277054484229878 & 0.861472757885061 \tabularnewline
25 & 0.112429641024936 & 0.224859282049871 & 0.887570358975064 \tabularnewline
26 & 0.092703420191913 & 0.185406840383826 & 0.907296579808087 \tabularnewline
27 & 0.0768626867551936 & 0.153725373510387 & 0.923137313244806 \tabularnewline
28 & 0.0639930107458384 & 0.127986021491677 & 0.936006989254162 \tabularnewline
29 & 0.106952487249069 & 0.213904974498138 & 0.893047512750931 \tabularnewline
30 & 0.071234205267273 & 0.142468410534546 & 0.928765794732727 \tabularnewline
31 & 0.0457926022243636 & 0.0915852044487272 & 0.954207397775636 \tabularnewline
32 & 0.0300561534722357 & 0.0601123069444715 & 0.969943846527764 \tabularnewline
33 & 0.0348793631799475 & 0.0697587263598949 & 0.965120636820053 \tabularnewline
34 & 0.081753794665685 & 0.16350758933137 & 0.918246205334315 \tabularnewline
35 & 0.0611380479283276 & 0.122276095856655 & 0.938861952071672 \tabularnewline
36 & 0.0650400269963617 & 0.130080053992723 & 0.934959973003638 \tabularnewline
37 & 0.10142920507558 & 0.202858410151159 & 0.89857079492442 \tabularnewline
38 & 0.170622690852541 & 0.341245381705082 & 0.82937730914746 \tabularnewline
39 & 0.147120847235874 & 0.294241694471748 & 0.852879152764126 \tabularnewline
40 & 0.123562219815662 & 0.247124439631325 & 0.876437780184337 \tabularnewline
41 & 0.0934102261069327 & 0.186820452213865 & 0.906589773893067 \tabularnewline
42 & 0.0605094866832076 & 0.121018973366415 & 0.939490513316792 \tabularnewline
43 & 0.0393389834073336 & 0.0786779668146672 & 0.960661016592666 \tabularnewline
44 & 0.0254182132893589 & 0.0508364265787178 & 0.97458178671064 \tabularnewline
45 & 0.0200378640361546 & 0.0400757280723092 & 0.979962135963845 \tabularnewline
46 & 0.0187557414782874 & 0.0375114829565748 & 0.981244258521713 \tabularnewline
47 & 0.0301051193967822 & 0.0602102387935645 & 0.969894880603218 \tabularnewline
48 & 0.362276138291642 & 0.724552276583283 & 0.637723861708358 \tabularnewline
49 & 0.493479900765518 & 0.986959801531035 & 0.506520099234482 \tabularnewline
50 & 0.619957549827779 & 0.760084900344441 & 0.380042450172221 \tabularnewline
51 & 0.468822388109059 & 0.937644776218117 & 0.531177611890941 \tabularnewline
\hline
\end{tabular}
%Source: https://freestatistics.org/blog/index.php?pk=113152&T=5

[TABLE]
[ROW][C]Goldfeld-Quandt test for Heteroskedasticity[/C][/ROW]
[ROW][C]p-values[/C][C]Alternative Hypothesis[/C][/ROW]
[ROW][C]breakpoint index[/C][C]greater[/C][C]2-sided[/C][C]less[/C][/ROW]
[ROW][C]16[/C][C]0.349214170503655[/C][C]0.698428341007311[/C][C]0.650785829496345[/C][/ROW]
[ROW][C]17[/C][C]0.429918730662745[/C][C]0.85983746132549[/C][C]0.570081269337255[/C][/ROW]
[ROW][C]18[/C][C]0.32714985370524[/C][C]0.65429970741048[/C][C]0.67285014629476[/C][/ROW]
[ROW][C]19[/C][C]0.208513984203917[/C][C]0.417027968407834[/C][C]0.791486015796083[/C][/ROW]
[ROW][C]20[/C][C]0.170639846478776[/C][C]0.341279692957553[/C][C]0.829360153521223[/C][/ROW]
[ROW][C]21[/C][C]0.134160692029925[/C][C]0.26832138405985[/C][C]0.865839307970075[/C][/ROW]
[ROW][C]22[/C][C]0.088034680053508[/C][C]0.176069360107016[/C][C]0.911965319946492[/C][/ROW]
[ROW][C]23[/C][C]0.0712295378025196[/C][C]0.142459075605039[/C][C]0.92877046219748[/C][/ROW]
[ROW][C]24[/C][C]0.138527242114939[/C][C]0.277054484229878[/C][C]0.861472757885061[/C][/ROW]
[ROW][C]25[/C][C]0.112429641024936[/C][C]0.224859282049871[/C][C]0.887570358975064[/C][/ROW]
[ROW][C]26[/C][C]0.092703420191913[/C][C]0.185406840383826[/C][C]0.907296579808087[/C][/ROW]
[ROW][C]27[/C][C]0.0768626867551936[/C][C]0.153725373510387[/C][C]0.923137313244806[/C][/ROW]
[ROW][C]28[/C][C]0.0639930107458384[/C][C]0.127986021491677[/C][C]0.936006989254162[/C][/ROW]
[ROW][C]29[/C][C]0.106952487249069[/C][C]0.213904974498138[/C][C]0.893047512750931[/C][/ROW]
[ROW][C]30[/C][C]0.071234205267273[/C][C]0.142468410534546[/C][C]0.928765794732727[/C][/ROW]
[ROW][C]31[/C][C]0.0457926022243636[/C][C]0.0915852044487272[/C][C]0.954207397775636[/C][/ROW]
[ROW][C]32[/C][C]0.0300561534722357[/C][C]0.0601123069444715[/C][C]0.969943846527764[/C][/ROW]
[ROW][C]33[/C][C]0.0348793631799475[/C][C]0.0697587263598949[/C][C]0.965120636820053[/C][/ROW]
[ROW][C]34[/C][C]0.081753794665685[/C][C]0.16350758933137[/C][C]0.918246205334315[/C][/ROW]
[ROW][C]35[/C][C]0.0611380479283276[/C][C]0.122276095856655[/C][C]0.938861952071672[/C][/ROW]
[ROW][C]36[/C][C]0.0650400269963617[/C][C]0.130080053992723[/C][C]0.934959973003638[/C][/ROW]
[ROW][C]37[/C][C]0.10142920507558[/C][C]0.202858410151159[/C][C]0.89857079492442[/C][/ROW]
[ROW][C]38[/C][C]0.170622690852541[/C][C]0.341245381705082[/C][C]0.82937730914746[/C][/ROW]
[ROW][C]39[/C][C]0.147120847235874[/C][C]0.294241694471748[/C][C]0.852879152764126[/C][/ROW]
[ROW][C]40[/C][C]0.123562219815662[/C][C]0.247124439631325[/C][C]0.876437780184337[/C][/ROW]
[ROW][C]41[/C][C]0.0934102261069327[/C][C]0.186820452213865[/C][C]0.906589773893067[/C][/ROW]
[ROW][C]42[/C][C]0.0605094866832076[/C][C]0.121018973366415[/C][C]0.939490513316792[/C][/ROW]
[ROW][C]43[/C][C]0.0393389834073336[/C][C]0.0786779668146672[/C][C]0.960661016592666[/C][/ROW]
[ROW][C]44[/C][C]0.0254182132893589[/C][C]0.0508364265787178[/C][C]0.97458178671064[/C][/ROW]
[ROW][C]45[/C][C]0.0200378640361546[/C][C]0.0400757280723092[/C][C]0.979962135963845[/C][/ROW]
[ROW][C]46[/C][C]0.0187557414782874[/C][C]0.0375114829565748[/C][C]0.981244258521713[/C][/ROW]
[ROW][C]47[/C][C]0.0301051193967822[/C][C]0.0602102387935645[/C][C]0.969894880603218[/C][/ROW]
[ROW][C]48[/C][C]0.362276138291642[/C][C]0.724552276583283[/C][C]0.637723861708358[/C][/ROW]
[ROW][C]49[/C][C]0.493479900765518[/C][C]0.986959801531035[/C][C]0.506520099234482[/C][/ROW]
[ROW][C]50[/C][C]0.619957549827779[/C][C]0.760084900344441[/C][C]0.380042450172221[/C][/ROW]
[ROW][C]51[/C][C]0.468822388109059[/C][C]0.937644776218117[/C][C]0.531177611890941[/C][/ROW]
[/TABLE]
Source: https://freestatistics.org/blog/index.php?pk=113152&T=5

Globally Unique Identifier (entire table): ba.freestatistics.org/blog/index.php?pk=113152&T=5

As an alternative you can also use a QR Code:  

The GUIDs for individual cells are displayed in the table below:

Goldfeld-Quandt test for Heteroskedasticity
p-valuesAlternative Hypothesis
breakpoint indexgreater2-sidedless
160.3492141705036550.6984283410073110.650785829496345
170.4299187306627450.859837461325490.570081269337255
180.327149853705240.654299707410480.67285014629476
190.2085139842039170.4170279684078340.791486015796083
200.1706398464787760.3412796929575530.829360153521223
210.1341606920299250.268321384059850.865839307970075
220.0880346800535080.1760693601070160.911965319946492
230.07122953780251960.1424590756050390.92877046219748
240.1385272421149390.2770544842298780.861472757885061
250.1124296410249360.2248592820498710.887570358975064
260.0927034201919130.1854068403838260.907296579808087
270.07686268675519360.1537253735103870.923137313244806
280.06399301074583840.1279860214916770.936006989254162
290.1069524872490690.2139049744981380.893047512750931
300.0712342052672730.1424684105345460.928765794732727
310.04579260222436360.09158520444872720.954207397775636
320.03005615347223570.06011230694447150.969943846527764
330.03487936317994750.06975872635989490.965120636820053
340.0817537946656850.163507589331370.918246205334315
350.06113804792832760.1222760958566550.938861952071672
360.06504002699636170.1300800539927230.934959973003638
370.101429205075580.2028584101511590.89857079492442
380.1706226908525410.3412453817050820.82937730914746
390.1471208472358740.2942416944717480.852879152764126
400.1235622198156620.2471244396313250.876437780184337
410.09341022610693270.1868204522138650.906589773893067
420.06050948668320760.1210189733664150.939490513316792
430.03933898340733360.07867796681466720.960661016592666
440.02541821328935890.05083642657871780.97458178671064
450.02003786403615460.04007572807230920.979962135963845
460.01875574147828740.03751148295657480.981244258521713
470.03010511939678220.06021023879356450.969894880603218
480.3622761382916420.7245522765832830.637723861708358
490.4934799007655180.9869598015310350.506520099234482
500.6199575498277790.7600849003444410.380042450172221
510.4688223881090590.9376447762181170.531177611890941


Meta Analysis of Goldfeld-Quandt test for Heteroskedasticity
Description# significant tests% significant testsOK/NOK
1% type I error level00OK
5% type I error level20.0555555555555556NOK
10% type I error level80.222222222222222NOK

\begin{tabular}{lllllllll}
\hline
Meta Analysis of Goldfeld-Quandt test for Heteroskedasticity \tabularnewline
Description & # significant tests & % significant tests & OK/NOK \tabularnewline
1% type I error level & 0 & 0 & OK \tabularnewline
5% type I error level & 2 & 0.0555555555555556 & NOK \tabularnewline
10% type I error level & 8 & 0.222222222222222 & NOK \tabularnewline
\hline
\end{tabular}
%Source: https://freestatistics.org/blog/index.php?pk=113152&T=6

[TABLE]
[ROW][C]Meta Analysis of Goldfeld-Quandt test for Heteroskedasticity[/C][/ROW]
[ROW][C]Description[/C][C]# significant tests[/C][C]% significant tests[/C][C]OK/NOK[/C][/ROW]
[ROW][C]1% type I error level[/C][C]0[/C][C]0[/C][C]OK[/C][/ROW]
[ROW][C]5% type I error level[/C][C]2[/C][C]0.0555555555555556[/C][C]NOK[/C][/ROW]
[ROW][C]10% type I error level[/C][C]8[/C][C]0.222222222222222[/C][C]NOK[/C][/ROW]
[/TABLE]
Source: https://freestatistics.org/blog/index.php?pk=113152&T=6

Globally Unique Identifier (entire table): ba.freestatistics.org/blog/index.php?pk=113152&T=6

As an alternative you can also use a QR Code:  

The GUIDs for individual cells are displayed in the table below:

Meta Analysis of Goldfeld-Quandt test for Heteroskedasticity
Description# significant tests% significant testsOK/NOK
1% type I error level00OK
5% type I error level20.0555555555555556NOK
10% type I error level80.222222222222222NOK


Parameters (Session):
par1 = 1 ; par2 = Include Monthly Dummies ; par3 = Linear Trend ;
Parameters (R input):
par1 = 1 ; par2 = Include Monthly Dummies ; par3 = Linear Trend ;
R code (references can be found in the software module):
library(lattice)
library(lmtest)
n25 <- 25 #minimum number of obs. for Goldfeld-Quandt test
par1 <- as.numeric(par1)
x <- t(y)
k <- length(x[1,])
n <- length(x[,1])
x1 <- cbind(x[,par1], x[,1:k!=par1])
mycolnames <- c(colnames(x)[par1], colnames(x)[1:k!=par1])
colnames(x1) <- mycolnames #colnames(x)[par1]
x <- x1
if (par3 == 'First Differences'){
x2 <- array(0, dim=c(n-1,k), dimnames=list(1:(n-1), paste('(1-B)',colnames(x),sep='')))
for (i in 1:n-1) {
for (j in 1:k) {
x2[i,j] <- x[i+1,j] - x[i,j]
}
}
x <- x2
}
if (par2 == 'Include Monthly Dummies'){
x2 <- array(0, dim=c(n,11), dimnames=list(1:n, paste('M', seq(1:11), sep ='')))
for (i in 1:11){
x2[seq(i,n,12),i] <- 1
}
x <- cbind(x, x2)
}
if (par2 == 'Include Quarterly Dummies'){
x2 <- array(0, dim=c(n,3), dimnames=list(1:n, paste('Q', seq(1:3), sep ='')))
for (i in 1:3){
x2[seq(i,n,4),i] <- 1
}
x <- cbind(x, x2)
}
k <- length(x[1,])
if (par3 == 'Linear Trend'){
x <- cbind(x, c(1:n))
colnames(x)[k+1] <- 't'
}
x
k <- length(x[1,])
df <- as.data.frame(x)
(mylm <- lm(df))
(mysum <- summary(mylm))
if (n > n25) {
kp3 <- k + 3
nmkm3 <- n - k - 3
gqarr <- array(NA, dim=c(nmkm3-kp3+1,3))
numgqtests <- 0
numsignificant1 <- 0
numsignificant5 <- 0
numsignificant10 <- 0
for (mypoint in kp3:nmkm3) {
j <- 0
numgqtests <- numgqtests + 1
for (myalt in c('greater', 'two.sided', 'less')) {
j <- j + 1
gqarr[mypoint-kp3+1,j] <- gqtest(mylm, point=mypoint, alternative=myalt)$p.value
}
if (gqarr[mypoint-kp3+1,2] < 0.01) numsignificant1 <- numsignificant1 + 1
if (gqarr[mypoint-kp3+1,2] < 0.05) numsignificant5 <- numsignificant5 + 1
if (gqarr[mypoint-kp3+1,2] < 0.10) numsignificant10 <- numsignificant10 + 1
}
gqarr
}
bitmap(file='test0.png')
plot(x[,1], type='l', main='Actuals and Interpolation', ylab='value of Actuals and Interpolation (dots)', xlab='time or index')
points(x[,1]-mysum$resid)
grid()
dev.off()
bitmap(file='test1.png')
plot(mysum$resid, type='b', pch=19, main='Residuals', ylab='value of Residuals', xlab='time or index')
grid()
dev.off()
bitmap(file='test2.png')
hist(mysum$resid, main='Residual Histogram', xlab='values of Residuals')
grid()
dev.off()
bitmap(file='test3.png')
densityplot(~mysum$resid,col='black',main='Residual Density Plot', xlab='values of Residuals')
dev.off()
bitmap(file='test4.png')
qqnorm(mysum$resid, main='Residual Normal Q-Q Plot')
qqline(mysum$resid)
grid()
dev.off()
(myerror <- as.ts(mysum$resid))
bitmap(file='test5.png')
dum <- cbind(lag(myerror,k=1),myerror)
dum
dum1 <- dum[2:length(myerror),]
dum1
z <- as.data.frame(dum1)
z
plot(z,main=paste('Residual Lag plot, lowess, and regression line'), ylab='values of Residuals', xlab='lagged values of Residuals')
lines(lowess(z))
abline(lm(z))
grid()
dev.off()
bitmap(file='test6.png')
acf(mysum$resid, lag.max=length(mysum$resid)/2, main='Residual Autocorrelation Function')
grid()
dev.off()
bitmap(file='test7.png')
pacf(mysum$resid, lag.max=length(mysum$resid)/2, main='Residual Partial Autocorrelation Function')
grid()
dev.off()
bitmap(file='test8.png')
opar <- par(mfrow = c(2,2), oma = c(0, 0, 1.1, 0))
plot(mylm, las = 1, sub='Residual Diagnostics')
par(opar)
dev.off()
if (n > n25) {
bitmap(file='test9.png')
plot(kp3:nmkm3,gqarr[,2], main='Goldfeld-Quandt test',ylab='2-sided p-value',xlab='breakpoint')
grid()
dev.off()
}
load(file='createtable')
a<-table.start()
a<-table.row.start(a)
a<-table.element(a, 'Multiple Linear Regression - Estimated Regression Equation', 1, TRUE)
a<-table.row.end(a)
myeq <- colnames(x)[1]
myeq <- paste(myeq, '[t] = ', sep='')
for (i in 1:k){
if (mysum$coefficients[i,1] > 0) myeq <- paste(myeq, '+', '')
myeq <- paste(myeq, mysum$coefficients[i,1], sep=' ')
if (rownames(mysum$coefficients)[i] != '(Intercept)') {
myeq <- paste(myeq, rownames(mysum$coefficients)[i], sep='')
if (rownames(mysum$coefficients)[i] != 't') myeq <- paste(myeq, '[t]', sep='')
}
}
myeq <- paste(myeq, ' + e[t]')
a<-table.row.start(a)
a<-table.element(a, myeq)
a<-table.row.end(a)
a<-table.end(a)
table.save(a,file='mytable1.tab')
a<-table.start()
a<-table.row.start(a)
a<-table.element(a,hyperlink('ols1.htm','Multiple Linear Regression - Ordinary Least Squares',''), 6, TRUE)
a<-table.row.end(a)
a<-table.row.start(a)
a<-table.element(a,'Variable',header=TRUE)
a<-table.element(a,'Parameter',header=TRUE)
a<-table.element(a,'S.D.',header=TRUE)
a<-table.element(a,'T-STAT
H0: parameter = 0',header=TRUE)
a<-table.element(a,'2-tail p-value',header=TRUE)
a<-table.element(a,'1-tail p-value',header=TRUE)
a<-table.row.end(a)
for (i in 1:k){
a<-table.row.start(a)
a<-table.element(a,rownames(mysum$coefficients)[i],header=TRUE)
a<-table.element(a,mysum$coefficients[i,1])
a<-table.element(a, round(mysum$coefficients[i,2],6))
a<-table.element(a, round(mysum$coefficients[i,3],4))
a<-table.element(a, round(mysum$coefficients[i,4],6))
a<-table.element(a, round(mysum$coefficients[i,4]/2,6))
a<-table.row.end(a)
}
a<-table.end(a)
table.save(a,file='mytable2.tab')
a<-table.start()
a<-table.row.start(a)
a<-table.element(a, 'Multiple Linear Regression - Regression Statistics', 2, TRUE)
a<-table.row.end(a)
a<-table.row.start(a)
a<-table.element(a, 'Multiple R',1,TRUE)
a<-table.element(a, sqrt(mysum$r.squared))
a<-table.row.end(a)
a<-table.row.start(a)
a<-table.element(a, 'R-squared',1,TRUE)
a<-table.element(a, mysum$r.squared)
a<-table.row.end(a)
a<-table.row.start(a)
a<-table.element(a, 'Adjusted R-squared',1,TRUE)
a<-table.element(a, mysum$adj.r.squared)
a<-table.row.end(a)
a<-table.row.start(a)
a<-table.element(a, 'F-TEST (value)',1,TRUE)
a<-table.element(a, mysum$fstatistic[1])
a<-table.row.end(a)
a<-table.row.start(a)
a<-table.element(a, 'F-TEST (DF numerator)',1,TRUE)
a<-table.element(a, mysum$fstatistic[2])
a<-table.row.end(a)
a<-table.row.start(a)
a<-table.element(a, 'F-TEST (DF denominator)',1,TRUE)
a<-table.element(a, mysum$fstatistic[3])
a<-table.row.end(a)
a<-table.row.start(a)
a<-table.element(a, 'p-value',1,TRUE)
a<-table.element(a, 1-pf(mysum$fstatistic[1],mysum$fstatistic[2],mysum$fstatistic[3]))
a<-table.row.end(a)
a<-table.row.start(a)
a<-table.element(a, 'Multiple Linear Regression - Residual Statistics', 2, TRUE)
a<-table.row.end(a)
a<-table.row.start(a)
a<-table.element(a, 'Residual Standard Deviation',1,TRUE)
a<-table.element(a, mysum$sigma)
a<-table.row.end(a)
a<-table.row.start(a)
a<-table.element(a, 'Sum Squared Residuals',1,TRUE)
a<-table.element(a, sum(myerror*myerror))
a<-table.row.end(a)
a<-table.end(a)
table.save(a,file='mytable3.tab')
a<-table.start()
a<-table.row.start(a)
a<-table.element(a, 'Multiple Linear Regression - Actuals, Interpolation, and Residuals', 4, TRUE)
a<-table.row.end(a)
a<-table.row.start(a)
a<-table.element(a, 'Time or Index', 1, TRUE)
a<-table.element(a, 'Actuals', 1, TRUE)
a<-table.element(a, 'Interpolation
Forecast', 1, TRUE)
a<-table.element(a, 'Residuals
Prediction Error', 1, TRUE)
a<-table.row.end(a)
for (i in 1:n) {
a<-table.row.start(a)
a<-table.element(a,i, 1, TRUE)
a<-table.element(a,x[i])
a<-table.element(a,x[i]-mysum$resid[i])
a<-table.element(a,mysum$resid[i])
a<-table.row.end(a)
}
a<-table.end(a)
table.save(a,file='mytable4.tab')
if (n > n25) {
a<-table.start()
a<-table.row.start(a)
a<-table.element(a,'Goldfeld-Quandt test for Heteroskedasticity',4,TRUE)
a<-table.row.end(a)
a<-table.row.start(a)
a<-table.element(a,'p-values',header=TRUE)
a<-table.element(a,'Alternative Hypothesis',3,header=TRUE)
a<-table.row.end(a)
a<-table.row.start(a)
a<-table.element(a,'breakpoint index',header=TRUE)
a<-table.element(a,'greater',header=TRUE)
a<-table.element(a,'2-sided',header=TRUE)
a<-table.element(a,'less',header=TRUE)
a<-table.row.end(a)
for (mypoint in kp3:nmkm3) {
a<-table.row.start(a)
a<-table.element(a,mypoint,header=TRUE)
a<-table.element(a,gqarr[mypoint-kp3+1,1])
a<-table.element(a,gqarr[mypoint-kp3+1,2])
a<-table.element(a,gqarr[mypoint-kp3+1,3])
a<-table.row.end(a)
}
a<-table.end(a)
table.save(a,file='mytable5.tab')
a<-table.start()
a<-table.row.start(a)
a<-table.element(a,'Meta Analysis of Goldfeld-Quandt test for Heteroskedasticity',4,TRUE)
a<-table.row.end(a)
a<-table.row.start(a)
a<-table.element(a,'Description',header=TRUE)
a<-table.element(a,'# significant tests',header=TRUE)
a<-table.element(a,'% significant tests',header=TRUE)
a<-table.element(a,'OK/NOK',header=TRUE)
a<-table.row.end(a)
a<-table.row.start(a)
a<-table.element(a,'1% type I error level',header=TRUE)
a<-table.element(a,numsignificant1)
a<-table.element(a,numsignificant1/numgqtests)
if (numsignificant1/numgqtests < 0.01) dum <- 'OK' else dum <- 'NOK'
a<-table.element(a,dum)
a<-table.row.end(a)
a<-table.row.start(a)
a<-table.element(a,'5% type I error level',header=TRUE)
a<-table.element(a,numsignificant5)
a<-table.element(a,numsignificant5/numgqtests)
if (numsignificant5/numgqtests < 0.05) dum <- 'OK' else dum <- 'NOK'
a<-table.element(a,dum)
a<-table.row.end(a)
a<-table.row.start(a)
a<-table.element(a,'10% type I error level',header=TRUE)
a<-table.element(a,numsignificant10)
a<-table.element(a,numsignificant10/numgqtests)
if (numsignificant10/numgqtests < 0.1) dum <- 'OK' else dum <- 'NOK'
a<-table.element(a,dum)
a<-table.row.end(a)
a<-table.end(a)
table.save(a,file='mytable6.tab')
}