| Multiple Linear Regression - Estimated Regression Equation |
| nb[t] = + 5017.8 -217.03888888889M1[t] -198.611111111111M2[t] + 482.816666666667M3[t] + 80.5777777777779M4[t] + 283.005555555556M5[t] + 841.6M6[t] -208.638888888889M7[t] -91.711111111111M8[t] -14.1833333333332M9[t] + 200.744444444445M10[t] -420.527777777778M11[t] -14.9277777777778t + e[t] |
| Multiple Linear Regression - Ordinary Least Squares | |||||
| Variable | Parameter | S.D. | T-STAT H0: parameter = 0 | 2-tail p-value | 1-tail p-value |
| (Intercept) | 5017.8 | 309.379994 | 16.2189 | 0 | 0 |
| M1 | -217.03888888889 | 373.570937 | -0.581 | 0.563668 | 0.281834 |
| M2 | -198.611111111111 | 373.386826 | -0.5319 | 0.596965 | 0.298482 |
| M3 | 482.816666666667 | 373.243566 | 1.2936 | 0.20132 | 0.10066 |
| M4 | 80.5777777777779 | 373.141204 | 0.2159 | 0.829845 | 0.414922 |
| M5 | 283.005555555556 | 373.079773 | 0.7586 | 0.451411 | 0.225705 |
| M6 | 841.6 | 373.059294 | 2.2559 | 0.028147 | 0.014073 |
| M7 | -208.638888888889 | 373.079773 | -0.5592 | 0.578314 | 0.289157 |
| M8 | -91.711111111111 | 389.961324 | -0.2352 | 0.814959 | 0.407479 |
| M9 | -14.1833333333332 | 389.824155 | -0.0364 | 0.97111 | 0.485555 |
| M10 | 200.744444444445 | 389.726148 | 0.5151 | 0.608592 | 0.304296 |
| M11 | -420.527777777778 | 389.667332 | -1.0792 | 0.285297 | 0.142648 |
| t | -14.9277777777778 | 3.909006 | -3.8188 | 0.000348 | 0.000174 |
| Multiple Linear Regression - Regression Statistics | |
| Multiple R | 0.623207054194961 |
| R-squared | 0.388387032398361 |
| Adjusted R-squared | 0.252473039597996 |
| F-TEST (value) | 2.85759416227907 |
| F-TEST (DF numerator) | 12 |
| F-TEST (DF denominator) | 54 |
| p-value | 0.00413501323506293 |
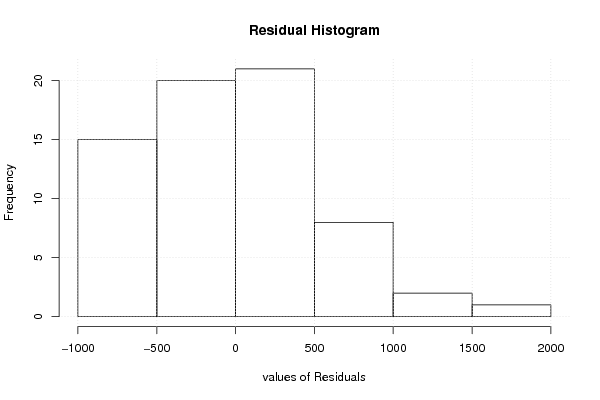
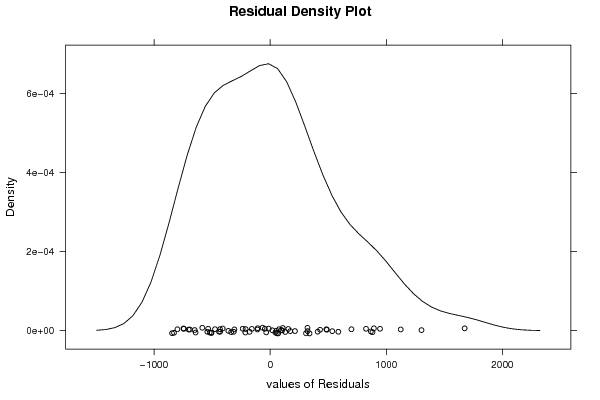
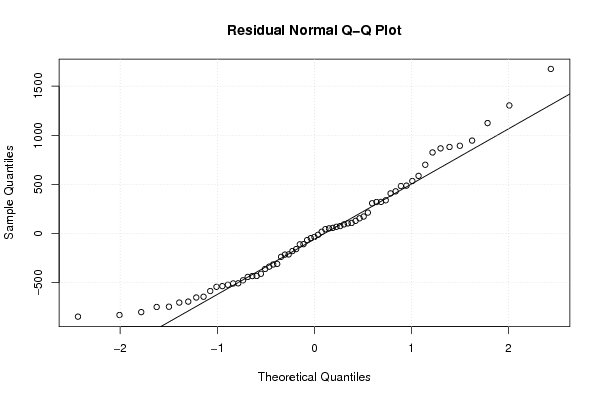
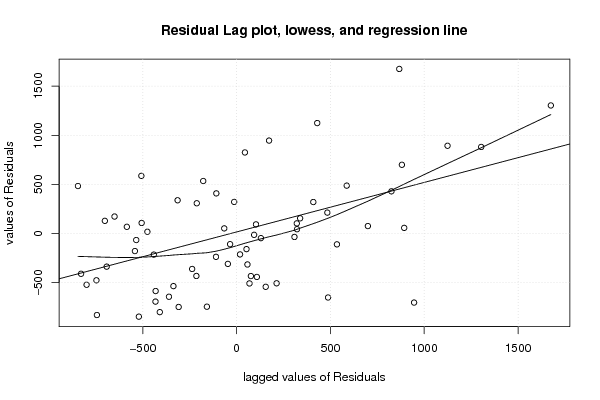
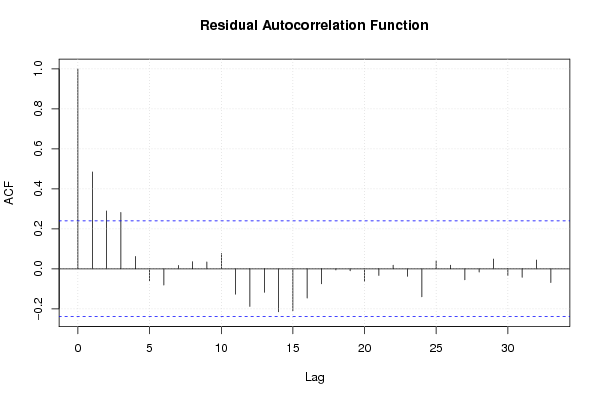
| Multiple Linear Regression - Residual Statistics | |
| Residual Standard Deviation | 616.087147114356 |
| Sum Squared Residuals | 20496422.1333333 |
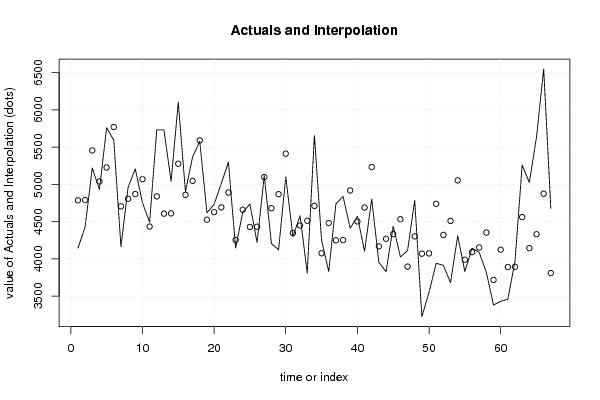
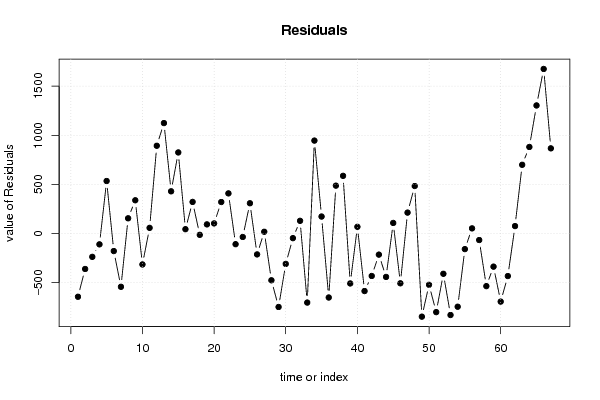
| Multiple Linear Regression - Actuals, Interpolation, and Residuals | |||
| Time or Index | Actuals | Interpolation Forecast | Residuals Prediction Error |
| 1 | 4143 | 4785.83333333334 | -642.833333333337 |
| 2 | 4429 | 4789.33333333333 | -360.333333333333 |
| 3 | 5219 | 5455.83333333333 | -236.833333333334 |
| 4 | 4929 | 5038.66666666667 | -109.666666666667 |
| 5 | 5761 | 5226.16666666667 | 534.833333333334 |
| 6 | 5592 | 5769.83333333333 | -177.833333333333 |
| 7 | 4163 | 4704.66666666667 | -541.666666666667 |
| 8 | 4962 | 4806.66666666667 | 155.333333333333 |
| 9 | 5208 | 4869.26666666667 | 338.733333333333 |
| 10 | 4755 | 5069.26666666667 | -314.266666666666 |
| 11 | 4491 | 4433.06666666667 | 57.9333333333332 |
| 12 | 5732 | 4838.66666666667 | 893.333333333334 |
| 13 | 5731 | 4606.7 | 1124.3 |
| 14 | 5040 | 4610.2 | 429.8 |
| 15 | 6102 | 5276.7 | 825.3 |
| 16 | 4904 | 4859.53333333333 | 44.4666666666668 |
| 17 | 5369 | 5047.03333333333 | 321.966666666667 |
| 18 | 5578 | 5590.7 | -12.6999999999999 |
| 19 | 4619 | 4525.53333333333 | 93.466666666667 |
| 20 | 4731 | 4627.53333333333 | 103.466666666667 |
| 21 | 5011 | 4690.13333333333 | 320.866666666667 |
| 22 | 5299 | 4890.13333333333 | 408.866666666667 |
| 23 | 4146 | 4253.93333333333 | -107.933333333333 |
| 24 | 4625 | 4659.53333333333 | -34.5333333333332 |
| 25 | 4736 | 4427.56666666667 | 308.433333333334 |
| 26 | 4219 | 4431.06666666667 | -212.066666666667 |
| 27 | 5116 | 5097.56666666667 | 18.4333333333333 |
| 28 | 4205 | 4680.4 | -475.4 |
| 29 | 4121 | 4867.9 | -746.9 |
| 30 | 5103 | 5411.56666666667 | -308.566666666667 |
| 31 | 4300 | 4346.4 | -46.3999999999999 |
| 32 | 4578 | 4448.4 | 129.6 |
| 33 | 3809 | 4511 | -702 |
| 34 | 5657 | 4711 | 946 |
| 35 | 4248 | 4074.8 | 173.2 |
| 36 | 3830 | 4480.4 | -650.4 |
| 37 | 4736 | 4248.43333333333 | 487.566666666668 |
| 38 | 4839 | 4251.93333333333 | 587.066666666667 |
| 39 | 4411 | 4918.43333333333 | -507.433333333333 |
| 40 | 4570 | 4501.26666666667 | 68.7333333333333 |
| 41 | 4104 | 4688.76666666667 | -584.766666666667 |
| 42 | 4801 | 5232.43333333333 | -431.433333333333 |
| 43 | 3953 | 4167.26666666667 | -214.266666666666 |
| 44 | 3828 | 4269.26666666667 | -441.266666666667 |
| 45 | 4440 | 4331.86666666667 | 108.133333333333 |
| 46 | 4026 | 4531.86666666667 | -505.866666666667 |
| 47 | 4109 | 3895.66666666667 | 213.333333333333 |
| 48 | 4785 | 4301.26666666667 | 483.733333333333 |
| 49 | 3224 | 4069.3 | -845.299999999999 |
| 50 | 3552 | 4072.8 | -520.8 |
| 51 | 3940 | 4739.3 | -799.3 |
| 52 | 3913 | 4322.13333333333 | -409.133333333333 |
| 53 | 3681 | 4509.63333333333 | -828.633333333334 |
| 54 | 4309 | 5053.3 | -744.3 |
| 55 | 3830 | 3988.13333333333 | -158.133333333333 |
| 56 | 4143 | 4090.13333333333 | 52.8666666666665 |
| 57 | 4087 | 4152.73333333333 | -65.7333333333335 |
| 58 | 3818 | 4352.73333333333 | -534.733333333334 |
| 59 | 3380 | 3716.53333333333 | -336.533333333334 |
| 60 | 3430 | 4122.13333333333 | -692.133333333333 |
| 61 | 3458 | 3890.16666666667 | -432.166666666666 |
| 62 | 3970 | 3893.66666666667 | 76.3333333333334 |
| 63 | 5260 | 4560.16666666667 | 699.833333333333 |
| 64 | 5024 | 4143 | 881 |
| 65 | 5634 | 4330.5 | 1303.5 |
| 66 | 6549 | 4874.16666666667 | 1674.83333333333 |
| 67 | 4676 | 3809 | 867 |
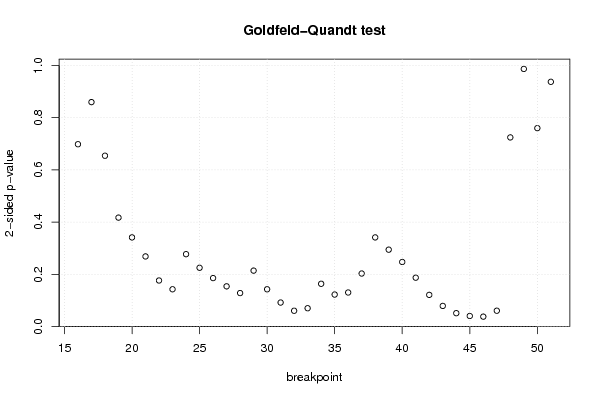
| Goldfeld-Quandt test for Heteroskedasticity | |||
| p-values | Alternative Hypothesis | ||
| breakpoint index | greater | 2-sided | less |
| 16 | 0.349214170503655 | 0.698428341007311 | 0.650785829496345 |
| 17 | 0.429918730662745 | 0.85983746132549 | 0.570081269337255 |
| 18 | 0.32714985370524 | 0.65429970741048 | 0.67285014629476 |
| 19 | 0.208513984203917 | 0.417027968407834 | 0.791486015796083 |
| 20 | 0.170639846478776 | 0.341279692957553 | 0.829360153521223 |
| 21 | 0.134160692029925 | 0.26832138405985 | 0.865839307970075 |
| 22 | 0.088034680053508 | 0.176069360107016 | 0.911965319946492 |
| 23 | 0.0712295378025196 | 0.142459075605039 | 0.92877046219748 |
| 24 | 0.138527242114939 | 0.277054484229878 | 0.861472757885061 |
| 25 | 0.112429641024936 | 0.224859282049871 | 0.887570358975064 |
| 26 | 0.092703420191913 | 0.185406840383826 | 0.907296579808087 |
| 27 | 0.0768626867551936 | 0.153725373510387 | 0.923137313244806 |
| 28 | 0.0639930107458384 | 0.127986021491677 | 0.936006989254162 |
| 29 | 0.106952487249069 | 0.213904974498138 | 0.893047512750931 |
| 30 | 0.071234205267273 | 0.142468410534546 | 0.928765794732727 |
| 31 | 0.0457926022243636 | 0.0915852044487272 | 0.954207397775636 |
| 32 | 0.0300561534722357 | 0.0601123069444715 | 0.969943846527764 |
| 33 | 0.0348793631799475 | 0.0697587263598949 | 0.965120636820053 |
| 34 | 0.081753794665685 | 0.16350758933137 | 0.918246205334315 |
| 35 | 0.0611380479283276 | 0.122276095856655 | 0.938861952071672 |
| 36 | 0.0650400269963617 | 0.130080053992723 | 0.934959973003638 |
| 37 | 0.10142920507558 | 0.202858410151159 | 0.89857079492442 |
| 38 | 0.170622690852541 | 0.341245381705082 | 0.82937730914746 |
| 39 | 0.147120847235874 | 0.294241694471748 | 0.852879152764126 |
| 40 | 0.123562219815662 | 0.247124439631325 | 0.876437780184337 |
| 41 | 0.0934102261069327 | 0.186820452213865 | 0.906589773893067 |
| 42 | 0.0605094866832076 | 0.121018973366415 | 0.939490513316792 |
| 43 | 0.0393389834073336 | 0.0786779668146672 | 0.960661016592666 |
| 44 | 0.0254182132893589 | 0.0508364265787178 | 0.97458178671064 |
| 45 | 0.0200378640361546 | 0.0400757280723092 | 0.979962135963845 |
| 46 | 0.0187557414782874 | 0.0375114829565748 | 0.981244258521713 |
| 47 | 0.0301051193967822 | 0.0602102387935645 | 0.969894880603218 |
| 48 | 0.362276138291642 | 0.724552276583283 | 0.637723861708358 |
| 49 | 0.493479900765518 | 0.986959801531035 | 0.506520099234482 |
| 50 | 0.619957549827779 | 0.760084900344441 | 0.380042450172221 |
| 51 | 0.468822388109059 | 0.937644776218117 | 0.531177611890941 |
| Meta Analysis of Goldfeld-Quandt test for Heteroskedasticity | |||
| Description | # significant tests | % significant tests | OK/NOK |
| 1% type I error level | 0 | 0 | OK |
| 5% type I error level | 2 | 0.0555555555555556 | NOK |
| 10% type I error level | 8 | 0.222222222222222 | NOK |