| Multiple Linear Regression - Estimated Regression Equation |
| HPC[t] = + 320655.670588235 + 880.29019607827M1[t] -6186.68627450981M2[t] -10274.9176470588M3[t] -12688.7490196078M4[t] -16929.1803921569M5[t] -11815.0117647059M6[t] + 19340.3568627451M7[t] + 26008.3254901961M8[t] + 16355.4941176471M9[t] + 4966.66274509804M10[t] -2658.76862745098M11[t] -1068.56862745098t + e[t] |
| Multiple Linear Regression - Ordinary Least Squares | |||||
| Variable | Parameter | S.D. | T-STAT H0: parameter = 0 | 2-tail p-value | 1-tail p-value |
| (Intercept) | 320655.670588235 | 6373.95704 | 50.3072 | 0 | 0 |
| M1 | 880.29019607827 | 7433.533414 | 0.1184 | 0.906228 | 0.453114 |
| M2 | -6186.68627450981 | 7802.279801 | -0.7929 | 0.431719 | 0.215859 |
| M3 | -10274.9176470588 | 7792.316204 | -1.3186 | 0.193561 | 0.096781 |
| M4 | -12688.7490196078 | 7783.390596 | -1.6302 | 0.109598 | 0.054799 |
| M5 | -16929.1803921569 | 7775.50655 | -2.1772 | 0.03441 | 0.017205 |
| M6 | -11815.0117647059 | 7768.667239 | -1.5209 | 0.134857 | 0.067429 |
| M7 | 19340.3568627451 | 7762.875422 | 2.4914 | 0.016234 | 0.008117 |
| M8 | 26008.3254901961 | 7758.133448 | 3.3524 | 0.00157 | 0.000785 |
| M9 | 16355.4941176471 | 7754.44324 | 2.1092 | 0.040171 | 0.020086 |
| M10 | 4966.66274509804 | 7751.806302 | 0.6407 | 0.524758 | 0.262379 |
| M11 | -2658.76862745098 | 7750.223709 | -0.3431 | 0.733054 | 0.366527 |
| t | -1068.56862745098 | 90.431209 | -11.8164 | 0 | 0 |
| Multiple Linear Regression - Regression Statistics | |
| Multiple R | 0.896894324127192 |
| R-squared | 0.804419428651573 |
| Adjusted R-squared | 0.755524285814467 |
| F-TEST (value) | 16.4519292096453 |
| F-TEST (DF numerator) | 12 |
| F-TEST (DF denominator) | 48 |
| p-value | 4.12336831345783e-13 |
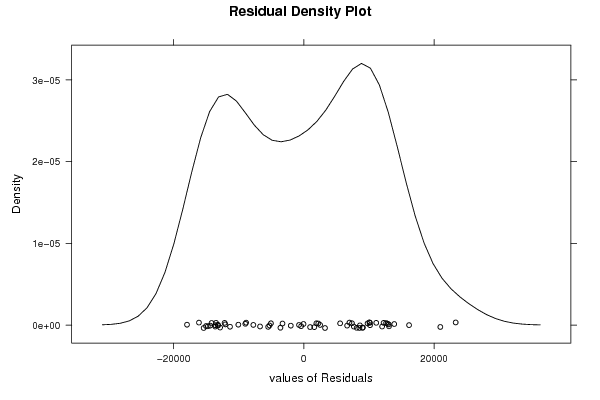
| Multiple Linear Regression - Residual Statistics | |
| Residual Standard Deviation | 12253.3454343963 |
| Sum Squared Residuals | 7206934768.06276 |
| Multiple Linear Regression - Actuals, Interpolation, and Residuals | |||
| Time or Index | Actuals | Interpolation Forecast | Residuals Prediction Error |
| 1 | 313737 | 320467.392156864 | -6730.39215686355 |
| 2 | 312276 | 312331.847058824 | -55.8470588235415 |
| 3 | 309391 | 307175.047058824 | 2215.95294117650 |
| 4 | 302950 | 303692.647058823 | -742.64705882347 |
| 5 | 300316 | 298383.647058823 | 1932.35294117654 |
| 6 | 304035 | 302429.247058823 | 1605.75294117655 |
| 7 | 333476 | 332516.047058823 | 959.952941176511 |
| 8 | 337698 | 338115.447058823 | -417.447058823474 |
| 9 | 335932 | 327394.047058823 | 8537.95294117654 |
| 10 | 323931 | 314936.647058823 | 8994.3529411765 |
| 11 | 313927 | 306242.647058823 | 7684.35294117651 |
| 12 | 314485 | 307832.847058824 | 6652.15294117651 |
| 13 | 313218 | 307644.568627451 | 5573.43137254917 |
| 14 | 309664 | 299509.023529412 | 10154.9764705883 |
| 15 | 302963 | 294352.223529412 | 8610.77647058825 |
| 16 | 298989 | 290869.823529412 | 8119.17647058825 |
| 17 | 298423 | 285560.823529412 | 12862.1764705882 |
| 18 | 301631 | 289606.423529412 | 12024.5764705882 |
| 19 | 329765 | 319693.223529412 | 10071.7764705883 |
| 20 | 335083 | 325292.623529412 | 9790.37647058825 |
| 21 | 327616 | 314571.223529412 | 13044.7764705882 |
| 22 | 309119 | 302113.823529412 | 7005.17647058825 |
| 23 | 295916 | 293419.823529412 | 2496.17647058826 |
| 24 | 291413 | 295010.023529412 | -3597.02352941175 |
| 25 | 291542 | 294821.745098039 | -3279.74509803902 |
| 26 | 284678 | 286686.2 | -2008.19999999999 |
| 27 | 276475 | 281529.4 | -5054.40000000000 |
| 28 | 272566 | 278047 | -5481.00000000002 |
| 29 | 264981 | 272738 | -7757.00000000001 |
| 30 | 263290 | 276783.6 | -13493.6 |
| 31 | 296806 | 306870.4 | -10064.4 |
| 32 | 303598 | 312469.8 | -8871.8 |
| 33 | 286994 | 301748.4 | -14754.4 |
| 34 | 276427 | 289291 | -12864 |
| 35 | 266424 | 280597 | -14173 |
| 36 | 267153 | 282187.2 | -15034.2 |
| 37 | 268381 | 281998.921568627 | -13617.9215686273 |
| 38 | 262522 | 273863.376470588 | -11341.3764705882 |
| 39 | 255542 | 268706.576470588 | -13164.5764705883 |
| 40 | 253158 | 265224.176470588 | -12066.1764705883 |
| 41 | 243803 | 259915.176470588 | -16112.1764705883 |
| 42 | 250741 | 263960.776470588 | -13219.7764705883 |
| 43 | 280445 | 294047.576470588 | -13602.5764705883 |
| 44 | 285257 | 299646.976470588 | -14389.9764705883 |
| 45 | 270976 | 288925.576470588 | -17949.5764705883 |
| 46 | 261076 | 276468.176470588 | -15392.1764705882 |
| 47 | 255603 | 267774.176470588 | -12171.1764705882 |
| 48 | 260376 | 269364.376470588 | -8988.37647058826 |
| 49 | 263903 | 269176.098039216 | -5273.09803921553 |
| 50 | 264291 | 261040.552941176 | 3250.4470588235 |
| 51 | 263276 | 255883.752941176 | 7392.2470588235 |
| 52 | 262572 | 252401.352941177 | 10170.6470588235 |
| 53 | 256167 | 247092.352941177 | 9074.64705882349 |
| 54 | 264221 | 251137.952941177 | 13083.0470588235 |
| 55 | 293860 | 281224.752941177 | 12635.2470588235 |
| 56 | 300713 | 286824.152941176 | 13888.8470588235 |
| 57 | 287224 | 276102.752941177 | 11121.2470588235 |
| 58 | 275902 | 263645.352941177 | 12256.6470588235 |
| 59 | 271115 | 254951.352941177 | 16163.6470588235 |
| 60 | 277509 | 256541.552941177 | 20967.4470588235 |
| 61 | 279681 | 256353.274509804 | 23327.7254901962 |
| Goldfeld-Quandt test for Heteroskedasticity | |||
| p-values | Alternative Hypothesis | ||
| breakpoint index | greater | 2-sided | less |
| 16 | 0.00285132437314696 | 0.00570264874629391 | 0.997148675626853 |
| 17 | 0.000398367638622928 | 0.000796735277245855 | 0.999601632361377 |
| 18 | 4.97111211197424e-05 | 9.94222422394848e-05 | 0.99995028887888 |
| 19 | 6.23242510916713e-06 | 1.24648502183343e-05 | 0.99999376757489 |
| 20 | 7.89719101441688e-07 | 1.57943820288338e-06 | 0.999999210280899 |
| 21 | 3.36005310066386e-06 | 6.72010620132772e-06 | 0.9999966399469 |
| 22 | 0.000196430859064014 | 0.000392861718128029 | 0.999803569140936 |
| 23 | 0.0021043205460262 | 0.0042086410920524 | 0.997895679453974 |
| 24 | 0.0153549422742379 | 0.0307098845484757 | 0.984645057725762 |
| 25 | 0.0242218323299433 | 0.0484436646598866 | 0.975778167670057 |
| 26 | 0.0538940603188521 | 0.107788120637704 | 0.946105939681148 |
| 27 | 0.106836222911287 | 0.213672445822575 | 0.893163777088713 |
| 28 | 0.142509626583667 | 0.285019253167334 | 0.857490373416333 |
| 29 | 0.266883342721632 | 0.533766685443264 | 0.733116657278368 |
| 30 | 0.391468510306529 | 0.782937020613058 | 0.608531489693471 |
| 31 | 0.461708829804253 | 0.923417659608507 | 0.538291170195747 |
| 32 | 0.556874129520643 | 0.886251740958715 | 0.443125870479357 |
| 33 | 0.764672593364621 | 0.470654813270758 | 0.235327406635379 |
| 34 | 0.905112135141536 | 0.189775729716928 | 0.0948878648584642 |
| 35 | 0.965724422774129 | 0.0685511544517418 | 0.0342755772258709 |
| 36 | 0.987119047246758 | 0.0257619055064836 | 0.0128809527532418 |
| 37 | 0.999063246027523 | 0.00187350794495326 | 0.00093675397247663 |
| 38 | 0.999957142062187 | 8.57158756251123e-05 | 4.28579378125561e-05 |
| 39 | 0.999987664458388 | 2.46710832243331e-05 | 1.23355416121666e-05 |
| 40 | 0.999997967231732 | 4.06553653670542e-06 | 2.03276826835271e-06 |
| 41 | 0.99999728911876 | 5.42176247957969e-06 | 2.71088123978985e-06 |
| 42 | 0.99999165994723 | 1.66801055386310e-05 | 8.34005276931552e-06 |
| 43 | 0.999992354679635 | 1.52906407299399e-05 | 7.64532036496995e-06 |
| 44 | 0.999902523021714 | 0.000194953956571862 | 9.74769782859308e-05 |
| 45 | 0.998863005308418 | 0.00227398938316320 | 0.00113699469158160 |
| Meta Analysis of Goldfeld-Quandt test for Heteroskedasticity | |||
| Description | # significant tests | % significant tests | OK/NOK |
| 1% type I error level | 17 | 0.566666666666667 | NOK |
| 5% type I error level | 20 | 0.666666666666667 | NOK |
| 10% type I error level | 21 | 0.7 | NOK |