Free Statistics
of Irreproducible Research!
Description of Statistical Computation | |||||||||||||||||||||||||||||||||||||||||||||||||||||
|---|---|---|---|---|---|---|---|---|---|---|---|---|---|---|---|---|---|---|---|---|---|---|---|---|---|---|---|---|---|---|---|---|---|---|---|---|---|---|---|---|---|---|---|---|---|---|---|---|---|---|---|---|---|
| Author's title | |||||||||||||||||||||||||||||||||||||||||||||||||||||
| Author | *The author of this computation has been verified* | ||||||||||||||||||||||||||||||||||||||||||||||||||||
| R Software Module | rwasp_edauni.wasp | ||||||||||||||||||||||||||||||||||||||||||||||||||||
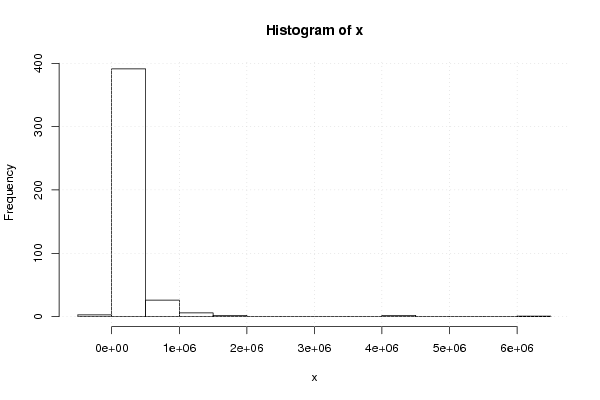
| Title produced by software | Univariate Explorative Data Analysis | ||||||||||||||||||||||||||||||||||||||||||||||||||||
| Date of computation | Mon, 20 Dec 2010 19:52:39 +0000 | ||||||||||||||||||||||||||||||||||||||||||||||||||||
| Cite this page as follows | Statistical Computations at FreeStatistics.org, Office for Research Development and Education, URL https://freestatistics.org/blog/index.php?v=date/2010/Dec/20/t1292874738qt6tfdsyxslpkq6.htm/, Retrieved Fri, 03 May 2024 21:11:25 +0000 | ||||||||||||||||||||||||||||||||||||||||||||||||||||
| Statistical Computations at FreeStatistics.org, Office for Research Development and Education, URL https://freestatistics.org/blog/index.php?pk=113102, Retrieved Fri, 03 May 2024 21:11:25 +0000 | |||||||||||||||||||||||||||||||||||||||||||||||||||||
| QR Codes: | |||||||||||||||||||||||||||||||||||||||||||||||||||||
|
| |||||||||||||||||||||||||||||||||||||||||||||||||||||
| Original text written by user: | |||||||||||||||||||||||||||||||||||||||||||||||||||||
| IsPrivate? | No (this computation is public) | ||||||||||||||||||||||||||||||||||||||||||||||||||||
| User-defined keywords | |||||||||||||||||||||||||||||||||||||||||||||||||||||
| Estimated Impact | 96 | ||||||||||||||||||||||||||||||||||||||||||||||||||||
Tree of Dependent Computations | |||||||||||||||||||||||||||||||||||||||||||||||||||||
| Family? (F = Feedback message, R = changed R code, M = changed R Module, P = changed Parameters, D = changed Data) | |||||||||||||||||||||||||||||||||||||||||||||||||||||
| - [Univariate Explorative Data Analysis] [] [2010-12-20 19:52:39] [d59f8bd190d7d14966a39d52957d0dd7] [Current] | |||||||||||||||||||||||||||||||||||||||||||||||||||||
| Feedback Forum | |||||||||||||||||||||||||||||||||||||||||||||||||||||
Post a new message | |||||||||||||||||||||||||||||||||||||||||||||||||||||
Dataset | |||||||||||||||||||||||||||||||||||||||||||||||||||||
| Dataseries X: | |||||||||||||||||||||||||||||||||||||||||||||||||||||
6282154 4321023 4111912 223193 1491348 1629616 1398893 1926517 983660 1443586 1073089 984885 1405225 227132 929118 1071292 638830 856956 992426 444477 857217 711969 702380 358589 297978 585715 657954 209458 786690 439798 688779 574339 741409 597793 644190 377934 640273 697458 550608 207393 301607 345783 501749 379983 387475 377305 370837 430866 469107 194493 530670 518365 491303 527021 233773 405972 652925 446211 341340 387699 493408 146494 414462 364304 355178 357760 261216 397144 374943 424898 202055 378525 310768 325738 394510 247060 368078 236761 312378 339836 347385 426280 352850 301881 377516 357312 458343 354228 308636 386212 393343 378509 452469 364839 358649 376641 429112 330546 403560 317892 307528 235133 299243 314073 368186 269661 125390 510834 321896 249898 408881 158492 292154 289513 378049 343466 332743 442882 214215 315688 375195 334280 355864 480382 353058 217193 315380 314533 318056 315380 314353 369448 315380 312846 312075 315009 318903 314887 314913 315380 325506 315380 298568 315834 329784 312878 315380 314987 325249 315877 291650 305959 315380 297765 315245 315380 315380 315236 336425 315380 315380 315380 315380 306268 302187 314882 315380 382712 341570 315380 315380 312412 315380 309596 315380 315547 313267 316176 315380 315380 359335 330068 314289 297413 314806 333210 352108 313332 291787 315380 318745 315380 315366 315380 315688 315380 409642 315380 315380 269587 315380 315380 315380 300962 325479 316155 318574 315380 343613 306948 315380 315380 330059 288985 304485 315380 315688 317736 315380 322331 296656 315380 315354 312161 315576 314922 314551 315380 312339 315380 298700 321376 315380 303230 315380 315487 315380 315793 315380 315380 315380 312887 315380 315637 324385 315380 315380 308989 315380 315380 296702 315380 307322 304376 253588 315380 309560 298466 315380 315380 315380 315380 343929 331955 315380 315380 315380 381180 315380 331420 315380 315380 315380 310201 315380 320016 320398 315380 291841 310670 315380 315380 313491 315380 331323 315380 319210 318098 315380 292754 315380 325176 365959 315380 302409 340968 315380 315380 315380 315380 313164 301164 315380 315380 344425 315394 315380 316647 309836 315380 315380 346611 315380 322031 315656 339445 314964 297141 315372 315380 315380 315380 315380 315380 315380 312502 315380 315380 315380 315380 315380 315380 315380 313729 315388 315371 296139 315380 313880 317698 295580 315380 315380 315380 308256 315380 303677 315380 315380 319369 318690 314049 325699 314210 315380 315380 322378 315380 315380 315380 315398 315380 315380 308336 316386 315380 315380 315380 315380 315553 315380 323361 336639 307424 315380 315380 295370 322340 319864 315380 315380 317291 280398 315380 317330 238125 327071 309038 314210 307930 322327 292136 263276 367655 283910 283587 243650 438493 296261 230621 304252 333505 296919 278990 276898 327007 317046 304555 298096 231861 309422 286963 269753 448243 165404 204325 407159 290476 275311 246541 253468 240897 -83265 -42143 272713 215362 42754 306275 253537 372631 -7170 | |||||||||||||||||||||||||||||||||||||||||||||||||||||
Tables (Output of Computation) | |||||||||||||||||||||||||||||||||||||||||||||||||||||
| |||||||||||||||||||||||||||||||||||||||||||||||||||||
Figures (Output of Computation) | |||||||||||||||||||||||||||||||||||||||||||||||||||||
Input Parameters & R Code | |||||||||||||||||||||||||||||||||||||||||||||||||||||
| Parameters (Session): | |||||||||||||||||||||||||||||||||||||||||||||||||||||
| par1 = 0 ; par2 = 0 ; | |||||||||||||||||||||||||||||||||||||||||||||||||||||
| Parameters (R input): | |||||||||||||||||||||||||||||||||||||||||||||||||||||
| par1 = 0 ; par2 = 0 ; | |||||||||||||||||||||||||||||||||||||||||||||||||||||
| R code (references can be found in the software module): | |||||||||||||||||||||||||||||||||||||||||||||||||||||
par1 <- as.numeric(par1) | |||||||||||||||||||||||||||||||||||||||||||||||||||||