| Multiple Linear Regression - Estimated Regression Equation |
| PS[t] = -90.7471201795934 + 0.747139236735807SWS[t] + 0.0480756077894083L[t] -0.0585083359047774wb[t] + 0.0501497584438397wbr[t] + 0.00720177972023492tg[t] -56.5039953128544P[t] -57.1689370103844S[t] + 138.812334264370`D `[t] + e[t] |
| Multiple Linear Regression - Ordinary Least Squares | |||||
| Variable | Parameter | S.D. | T-STAT H0: parameter = 0 | 2-tail p-value | 1-tail p-value |
| (Intercept) | -90.7471201795934 | 72.068777 | -1.2592 | 0.213485 | 0.106743 |
| SWS | 0.747139236735807 | 0.077462 | 9.6453 | 0 | 0 |
| L | 0.0480756077894083 | 0.129588 | 0.371 | 0.712125 | 0.356063 |
| wb | -0.0585083359047774 | 0.099518 | -0.5879 | 0.559084 | 0.279542 |
| wbr | 0.0501497584438397 | 0.099368 | 0.5047 | 0.615869 | 0.307935 |
| tg | 0.00720177972023492 | 0.118331 | 0.0609 | 0.951699 | 0.475849 |
| P | -56.5039953128544 | 59.041082 | -0.957 | 0.342898 | 0.171449 |
| S | -57.1689370103844 | 37.237168 | -1.5353 | 0.130667 | 0.065334 |
| `D ` | 138.812334264370 | 75.848946 | 1.8301 | 0.072859 | 0.036429 |
| Multiple Linear Regression - Regression Statistics | |
| Multiple R | 0.833238085909915 |
| R-squared | 0.694285707810819 |
| Adjusted R-squared | 0.64814015427283 |
| F-TEST (value) | 15.0455602886905 |
| F-TEST (DF numerator) | 8 |
| F-TEST (DF denominator) | 53 |
| p-value | 3.10692582772276e-11 |
| Multiple Linear Regression - Residual Statistics | |
| Residual Standard Deviation | 236.662993065487 |
| Sum Squared Residuals | 2968496.73119589 |
| Multiple Linear Regression - Actuals, Interpolation, and Residuals | |||
| Time or Index | Actuals | Interpolation Forecast | Residuals Prediction Error |
| 1 | -999 | -972.417066374995 | -26.5829336250051 |
| 2 | 2 | 104.507231909130 | -102.507231909130 |
| 3 | -999 | -808.861036911555 | -190.138963088445 |
| 4 | -999 | -865.175527205112 | -133.824472794888 |
| 5 | 1.8 | 100.344272334967 | -98.5442723349672 |
| 6 | 0.7 | 27.5884350960561 | -26.8884350960561 |
| 7 | 3.9 | -52.6237202240226 | 56.5237202240226 |
| 8 | 1 | -40.0747538350533 | 41.0747538350533 |
| 9 | 36 | -111.742252120272 | 147.742252120272 |
| 10 | 1.4 | -36.3321739339346 | 37.7321739339346 |
| 11 | 1.5 | -37.0357551293571 | 38.5357551293571 |
| 12 | 0.7 | 34.8136750447066 | -34.1136750447066 |
| 13 | 2.7 | -32.7550513743712 | 35.4550513743712 |
| 14 | -999 | -696.824694923363 | -302.175305076637 |
| 15 | 2.1 | -60.3742100865744 | 62.4742100865744 |
| 16 | 0 | -30.3592696863851 | 30.3592696863851 |
| 17 | 4.1 | -34.8166738290208 | 38.9166738290208 |
| 18 | 1.2 | -31.7672465358652 | 32.9672465358652 |
| 19 | 1.3 | -123.955270169048 | 125.255270169048 |
| 20 | 6.1 | -62.9484658039572 | 69.0484658039572 |
| 21 | 0.3 | -704.06445301863 | 704.36445301863 |
| 22 | 0.5 | 43.5917062115877 | -43.0917062115877 |
| 23 | 3.4 | -31.2389908916701 | 34.6389908916701 |
| 24 | -999 | -971.552830497154 | -27.4471695028457 |
| 25 | 1.5 | -160.904923271592 | 162.404923271592 |
| 26 | -999 | -806.899990478353 | -192.100009521647 |
| 27 | 3.4 | -5.39976290496808 | 8.79976290496808 |
| 28 | 0.8 | 17.0743302765808 | -16.2743302765808 |
| 29 | 0.8 | 43.5154066418439 | -42.7154066418439 |
| 30 | -999 | -808.180065665823 | -190.819934334177 |
| 31 | -999 | -735.464665757749 | -263.535334242251 |
| 32 | 1.4 | 73.6839016844503 | -72.2839016844503 |
| 33 | 2 | -50.7080699716821 | 52.7080699716821 |
| 34 | 1.9 | 8.25043138964159 | -6.35043138964159 |
| 35 | 2.4 | -163.653339341744 | 166.053339341744 |
| 36 | 2.8 | 57.908703948864 | -55.108703948864 |
| 37 | 1.3 | 51.705311240132 | -50.405311240132 |
| 38 | 2 | 50.9000137358092 | -48.9000137358092 |
| 39 | 5.6 | -111.257913381615 | 116.857913381615 |
| 40 | 3.1 | -109.914079233409 | 113.014079233409 |
| 41 | 1 | -697.19254289099 | 698.19254289099 |
| 42 | 1.8 | -26.7774061899964 | 28.5774061899964 |
| 43 | 0.9 | 24.659448644068 | -23.759448644068 |
| 44 | 1.8 | 26.8159145288091 | -25.0159145288091 |
| 45 | 1.9 | 14.5864947280278 | -12.6864947280278 |
| 46 | 0.9 | 42.1025911505248 | -41.2025911505248 |
| 47 | -999 | -784.033079060675 | -214.966920939325 |
| 48 | 2.6 | 107.384730511693 | -104.784730511693 |
| 49 | 2.4 | -56.9534893618164 | 59.3534893618164 |
| 50 | 1.2 | -80.207049141829 | 81.407049141829 |
| 51 | 0.9 | -33.6797321794282 | 34.5797321794282 |
| 52 | 0.5 | 48.2523739160418 | -47.7523739160418 |
| 53 | -999 | -705.487628024838 | -293.512371975162 |
| 54 | 0.6 | 44.9187110621161 | -44.3187110621161 |
| 55 | -999 | -785.056733092375 | -213.943266907625 |
| 56 | 2.2 | -179.543555101573 | 181.743555101573 |
| 57 | 2.3 | 25.4868920512075 | -23.1868920512075 |
| 58 | 0.5 | -644.8466856103 | 645.3466856103 |
| 59 | -999 | -86.5489283910512 | -912.451071608949 |
| 60 | 0.6 | 79.0357590634919 | -78.4357590634919 |
| 61 | 6.6 | -112.312474699383 | 118.912474699383 |
| 62 | 2.6 | -34.1847788682181 | 36.7847788682181 |
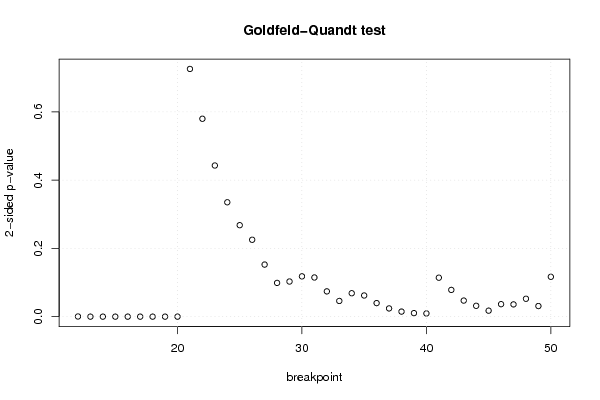
| Goldfeld-Quandt test for Heteroskedasticity | |||
| p-values | Alternative Hypothesis | ||
| breakpoint index | greater | 2-sided | less |
| 12 | 0.000246978458117911 | 0.000493956916235823 | 0.999753021541882 |
| 13 | 1.99337427561908e-05 | 3.98674855123816e-05 | 0.999980066257244 |
| 14 | 1.08838234503863e-06 | 2.17676469007725e-06 | 0.999998911617655 |
| 15 | 5.02492959669024e-08 | 1.00498591933805e-07 | 0.999999949750704 |
| 16 | 2.35559126978631e-09 | 4.71118253957262e-09 | 0.999999997644409 |
| 17 | 9.1580238955034e-11 | 1.83160477910068e-10 | 0.99999999990842 |
| 18 | 3.95044996609602e-12 | 7.90089993219204e-12 | 0.99999999999605 |
| 19 | 1.47601259810091e-13 | 2.95202519620182e-13 | 0.999999999999852 |
| 20 | 5.06193861256486e-15 | 1.01238772251297e-14 | 0.999999999999995 |
| 21 | 0.363090168096487 | 0.726180336192974 | 0.636909831903513 |
| 22 | 0.290096601400035 | 0.58019320280007 | 0.709903398599965 |
| 23 | 0.221553351245751 | 0.443106702491502 | 0.778446648754249 |
| 24 | 0.167660270357316 | 0.335320540714633 | 0.832339729642684 |
| 25 | 0.134072969854929 | 0.268145939709857 | 0.865927030145071 |
| 26 | 0.112699852941344 | 0.225399705882687 | 0.887300147058656 |
| 27 | 0.0763234693853996 | 0.152646938770799 | 0.9236765306146 |
| 28 | 0.049457993371618 | 0.098915986743236 | 0.950542006628382 |
| 29 | 0.0515021794804365 | 0.103004358960873 | 0.948497820519563 |
| 30 | 0.0590941017851865 | 0.118188203570373 | 0.940905898214814 |
| 31 | 0.0574179358711955 | 0.114835871742391 | 0.942582064128805 |
| 32 | 0.0370605577419927 | 0.0741211154839855 | 0.962939442258007 |
| 33 | 0.0230106907760334 | 0.0460213815520667 | 0.976989309223967 |
| 34 | 0.0343220837172896 | 0.0686441674345792 | 0.96567791628271 |
| 35 | 0.0310223190524516 | 0.0620446381049032 | 0.968977680947548 |
| 36 | 0.0198475034714068 | 0.0396950069428136 | 0.980152496528593 |
| 37 | 0.0120769111502844 | 0.0241538223005688 | 0.987923088849716 |
| 38 | 0.00739785752522244 | 0.0147957150504449 | 0.992602142474778 |
| 39 | 0.00521820701390976 | 0.0104364140278195 | 0.99478179298609 |
| 40 | 0.00467567757710391 | 0.00935135515420782 | 0.995324322422896 |
| 41 | 0.0571047654470387 | 0.114209530894077 | 0.942895234552961 |
| 42 | 0.0392076570128015 | 0.078415314025603 | 0.960792342987199 |
| 43 | 0.0235735197561388 | 0.0471470395122776 | 0.976426480243861 |
| 44 | 0.0159017397229546 | 0.0318034794459093 | 0.984098260277045 |
| 45 | 0.00876705562416511 | 0.0175341112483302 | 0.991232944375835 |
| 46 | 0.0183179143743212 | 0.0366358287486424 | 0.981682085625679 |
| 47 | 0.0179989788308315 | 0.035997957661663 | 0.982001021169169 |
| 48 | 0.0262310505957606 | 0.0524621011915212 | 0.97376894940424 |
| 49 | 0.0155361264021624 | 0.0310722528043247 | 0.984463873597838 |
| 50 | 0.0584109672903242 | 0.116821934580648 | 0.941589032709676 |
| Meta Analysis of Goldfeld-Quandt test for Heteroskedasticity | |||
| Description | # significant tests | % significant tests | OK/NOK |
| 1% type I error level | 10 | 0.256410256410256 | NOK |
| 5% type I error level | 21 | 0.538461538461538 | NOK |
| 10% type I error level | 27 | 0.692307692307692 | NOK |