Free Statistics

of Irreproducible Research!

Author's title

Author*The author of this computation has been verified*
R Software Modulerwasp_arimabackwardselection.wasp
Title produced by softwareARIMA Backward Selection
Date of computationMon, 20 Dec 2010 17:52:04 +0000
Cite this page as followsStatistical Computations at FreeStatistics.org, Office for Research Development and Education, URL https://freestatistics.org/blog/index.php?v=date/2010/Dec/20/t1292867435yslpcy38l3ie5c4.htm/, Retrieved Sat, 04 May 2024 05:15:35 +0000
Statistical Computations at FreeStatistics.org, Office for Research Development and Education, URL https://freestatistics.org/blog/index.php?pk=113037, Retrieved Sat, 04 May 2024 05:15:35 +0000
QR Codes:

Original text written by user:
IsPrivate?No (this computation is public)
User-defined keywords
Estimated Impact126
Family? (F = Feedback message, R = changed R code, M = changed R Module, P = changed Parameters, D = changed Data)
-     [Central Tendency] [] [2010-10-20 19:08:13] [b98453cac15ba1066b407e146608df68]
- RMPD    [ARIMA Backward Selection] [Faillissementen B...] [2010-12-20 17:52:04] [dcc54e7e6e8c80b7c45e040080afe6ab] [Current]
Feedback Forum

Post a new message
Dataseries X:
89
97
154
81
110
116
73
73
174
103
130
91
136
106
136
122
131
135
75
68
143
115
93
128
152
125
107
116
220
137
34
51
153
145
116
145
98
118
139
140
113
149
79
47
166
180
122
134
114
125
181
142
143
187
137
62
239
157
139
187
99
146
175
148
130
183
115
80
223
131
201
157


Summary of computational transaction
Raw Inputview raw input (R code)
Raw Outputview raw output of R engine
Computing time12 seconds
R Server'George Udny Yule' @ 72.249.76.132

\begin{tabular}{lllllllll}
\hline
Summary of computational transaction \tabularnewline
Raw Input & view raw input (R code)  \tabularnewline
Raw Output & view raw output of R engine  \tabularnewline
Computing time & 12 seconds \tabularnewline
R Server & 'George Udny Yule' @ 72.249.76.132 \tabularnewline
\hline
\end{tabular}
%Source: https://freestatistics.org/blog/index.php?pk=113037&T=0

[TABLE]
[ROW][C]Summary of computational transaction[/C][/ROW]
[ROW][C]Raw Input[/C][C]view raw input (R code) [/C][/ROW]
[ROW][C]Raw Output[/C][C]view raw output of R engine [/C][/ROW]
[ROW][C]Computing time[/C][C]12 seconds[/C][/ROW]
[ROW][C]R Server[/C][C]'George Udny Yule' @ 72.249.76.132[/C][/ROW]
[/TABLE]
Source: https://freestatistics.org/blog/index.php?pk=113037&T=0

Globally Unique Identifier (entire table): ba.freestatistics.org/blog/index.php?pk=113037&T=0

As an alternative you can also use a QR Code:  

The GUIDs for individual cells are displayed in the table below:

Summary of computational transaction
Raw Inputview raw input (R code)
Raw Outputview raw output of R engine
Computing time12 seconds
R Server'George Udny Yule' @ 72.249.76.132


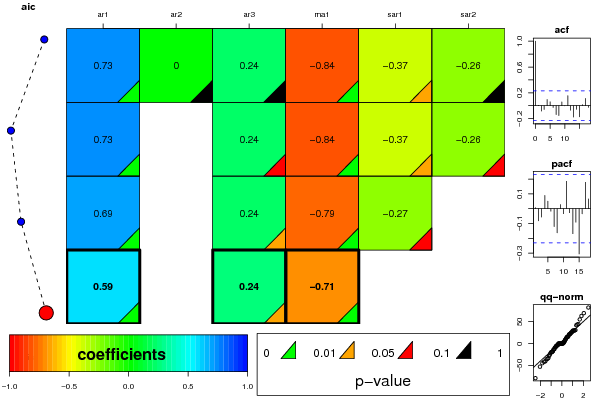
ARIMA Parameter Estimation and Backward Selection
Iterationar1ar2ar3ma1sar1sar2
Estimates ( 1 )0.72521e-040.2361-0.8384-0.3706-0.2594
(p-val)(8e-04 )(0.9995 )(0.1456 )(1e-04 )(0.022 )(0.1107 )
Estimates ( 2 )0.725200.2362-0.8383-0.3705-0.2593
(p-val)(4e-04 )(NA )(0.0777 )(1e-04 )(0.021 )(0.0946 )
Estimates ( 3 )0.68700.2359-0.7935-0.26530
(p-val)(3e-04 )(NA )(0.0402 )(0 )(0.0594 )(NA )
Estimates ( 4 )0.593800.2428-0.707900
(p-val)(0.0026 )(NA )(0.0276 )(2e-04 )(NA )(NA )
Estimates ( 5 )NANANANANANA
(p-val)(NA )(NA )(NA )(NA )(NA )(NA )
Estimates ( 6 )NANANANANANA
(p-val)(NA )(NA )(NA )(NA )(NA )(NA )
Estimates ( 7 )NANANANANANA
(p-val)(NA )(NA )(NA )(NA )(NA )(NA )
Estimates ( 8 )NANANANANANA
(p-val)(NA )(NA )(NA )(NA )(NA )(NA )
Estimates ( 9 )NANANANANANA
(p-val)(NA )(NA )(NA )(NA )(NA )(NA )
Estimates ( 10 )NANANANANANA
(p-val)(NA )(NA )(NA )(NA )(NA )(NA )
Estimates ( 11 )NANANANANANA
(p-val)(NA )(NA )(NA )(NA )(NA )(NA )

\begin{tabular}{lllllllll}
\hline
ARIMA Parameter Estimation and Backward Selection \tabularnewline
Iteration & ar1 & ar2 & ar3 & ma1 & sar1 & sar2 \tabularnewline
Estimates ( 1 ) & 0.7252 & 1e-04 & 0.2361 & -0.8384 & -0.3706 & -0.2594 \tabularnewline
(p-val) & (8e-04 ) & (0.9995 ) & (0.1456 ) & (1e-04 ) & (0.022 ) & (0.1107 ) \tabularnewline
Estimates ( 2 ) & 0.7252 & 0 & 0.2362 & -0.8383 & -0.3705 & -0.2593 \tabularnewline
(p-val) & (4e-04 ) & (NA ) & (0.0777 ) & (1e-04 ) & (0.021 ) & (0.0946 ) \tabularnewline
Estimates ( 3 ) & 0.687 & 0 & 0.2359 & -0.7935 & -0.2653 & 0 \tabularnewline
(p-val) & (3e-04 ) & (NA ) & (0.0402 ) & (0 ) & (0.0594 ) & (NA ) \tabularnewline
Estimates ( 4 ) & 0.5938 & 0 & 0.2428 & -0.7079 & 0 & 0 \tabularnewline
(p-val) & (0.0026 ) & (NA ) & (0.0276 ) & (2e-04 ) & (NA ) & (NA ) \tabularnewline
Estimates ( 5 ) & NA & NA & NA & NA & NA & NA \tabularnewline
(p-val) & (NA ) & (NA ) & (NA ) & (NA ) & (NA ) & (NA ) \tabularnewline
Estimates ( 6 ) & NA & NA & NA & NA & NA & NA \tabularnewline
(p-val) & (NA ) & (NA ) & (NA ) & (NA ) & (NA ) & (NA ) \tabularnewline
Estimates ( 7 ) & NA & NA & NA & NA & NA & NA \tabularnewline
(p-val) & (NA ) & (NA ) & (NA ) & (NA ) & (NA ) & (NA ) \tabularnewline
Estimates ( 8 ) & NA & NA & NA & NA & NA & NA \tabularnewline
(p-val) & (NA ) & (NA ) & (NA ) & (NA ) & (NA ) & (NA ) \tabularnewline
Estimates ( 9 ) & NA & NA & NA & NA & NA & NA \tabularnewline
(p-val) & (NA ) & (NA ) & (NA ) & (NA ) & (NA ) & (NA ) \tabularnewline
Estimates ( 10 ) & NA & NA & NA & NA & NA & NA \tabularnewline
(p-val) & (NA ) & (NA ) & (NA ) & (NA ) & (NA ) & (NA ) \tabularnewline
Estimates ( 11 ) & NA & NA & NA & NA & NA & NA \tabularnewline
(p-val) & (NA ) & (NA ) & (NA ) & (NA ) & (NA ) & (NA ) \tabularnewline
\hline
\end{tabular}
%Source: https://freestatistics.org/blog/index.php?pk=113037&T=1

[TABLE]
[ROW][C]ARIMA Parameter Estimation and Backward Selection[/C][/ROW]
[ROW][C]Iteration[/C][C]ar1[/C][C]ar2[/C][C]ar3[/C][C]ma1[/C][C]sar1[/C][C]sar2[/C][/ROW]
[ROW][C]Estimates ( 1 )[/C][C]0.7252[/C][C]1e-04[/C][C]0.2361[/C][C]-0.8384[/C][C]-0.3706[/C][C]-0.2594[/C][/ROW]
[ROW][C](p-val)[/C][C](8e-04 )[/C][C](0.9995 )[/C][C](0.1456 )[/C][C](1e-04 )[/C][C](0.022 )[/C][C](0.1107 )[/C][/ROW]
[ROW][C]Estimates ( 2 )[/C][C]0.7252[/C][C]0[/C][C]0.2362[/C][C]-0.8383[/C][C]-0.3705[/C][C]-0.2593[/C][/ROW]
[ROW][C](p-val)[/C][C](4e-04 )[/C][C](NA )[/C][C](0.0777 )[/C][C](1e-04 )[/C][C](0.021 )[/C][C](0.0946 )[/C][/ROW]
[ROW][C]Estimates ( 3 )[/C][C]0.687[/C][C]0[/C][C]0.2359[/C][C]-0.7935[/C][C]-0.2653[/C][C]0[/C][/ROW]
[ROW][C](p-val)[/C][C](3e-04 )[/C][C](NA )[/C][C](0.0402 )[/C][C](0 )[/C][C](0.0594 )[/C][C](NA )[/C][/ROW]
[ROW][C]Estimates ( 4 )[/C][C]0.5938[/C][C]0[/C][C]0.2428[/C][C]-0.7079[/C][C]0[/C][C]0[/C][/ROW]
[ROW][C](p-val)[/C][C](0.0026 )[/C][C](NA )[/C][C](0.0276 )[/C][C](2e-04 )[/C][C](NA )[/C][C](NA )[/C][/ROW]
[ROW][C]Estimates ( 5 )[/C][C]NA[/C][C]NA[/C][C]NA[/C][C]NA[/C][C]NA[/C][C]NA[/C][/ROW]
[ROW][C](p-val)[/C][C](NA )[/C][C](NA )[/C][C](NA )[/C][C](NA )[/C][C](NA )[/C][C](NA )[/C][/ROW]
[ROW][C]Estimates ( 6 )[/C][C]NA[/C][C]NA[/C][C]NA[/C][C]NA[/C][C]NA[/C][C]NA[/C][/ROW]
[ROW][C](p-val)[/C][C](NA )[/C][C](NA )[/C][C](NA )[/C][C](NA )[/C][C](NA )[/C][C](NA )[/C][/ROW]
[ROW][C]Estimates ( 7 )[/C][C]NA[/C][C]NA[/C][C]NA[/C][C]NA[/C][C]NA[/C][C]NA[/C][/ROW]
[ROW][C](p-val)[/C][C](NA )[/C][C](NA )[/C][C](NA )[/C][C](NA )[/C][C](NA )[/C][C](NA )[/C][/ROW]
[ROW][C]Estimates ( 8 )[/C][C]NA[/C][C]NA[/C][C]NA[/C][C]NA[/C][C]NA[/C][C]NA[/C][/ROW]
[ROW][C](p-val)[/C][C](NA )[/C][C](NA )[/C][C](NA )[/C][C](NA )[/C][C](NA )[/C][C](NA )[/C][/ROW]
[ROW][C]Estimates ( 9 )[/C][C]NA[/C][C]NA[/C][C]NA[/C][C]NA[/C][C]NA[/C][C]NA[/C][/ROW]
[ROW][C](p-val)[/C][C](NA )[/C][C](NA )[/C][C](NA )[/C][C](NA )[/C][C](NA )[/C][C](NA )[/C][/ROW]
[ROW][C]Estimates ( 10 )[/C][C]NA[/C][C]NA[/C][C]NA[/C][C]NA[/C][C]NA[/C][C]NA[/C][/ROW]
[ROW][C](p-val)[/C][C](NA )[/C][C](NA )[/C][C](NA )[/C][C](NA )[/C][C](NA )[/C][C](NA )[/C][/ROW]
[ROW][C]Estimates ( 11 )[/C][C]NA[/C][C]NA[/C][C]NA[/C][C]NA[/C][C]NA[/C][C]NA[/C][/ROW]
[ROW][C](p-val)[/C][C](NA )[/C][C](NA )[/C][C](NA )[/C][C](NA )[/C][C](NA )[/C][C](NA )[/C][/ROW]
[/TABLE]
Source: https://freestatistics.org/blog/index.php?pk=113037&T=1

Globally Unique Identifier (entire table): ba.freestatistics.org/blog/index.php?pk=113037&T=1

As an alternative you can also use a QR Code:  

The GUIDs for individual cells are displayed in the table below:

ARIMA Parameter Estimation and Backward Selection
Iterationar1ar2ar3ma1sar1sar2
Estimates ( 1 )0.72521e-040.2361-0.8384-0.3706-0.2594
(p-val)(8e-04 )(0.9995 )(0.1456 )(1e-04 )(0.022 )(0.1107 )
Estimates ( 2 )0.725200.2362-0.8383-0.3705-0.2593
(p-val)(4e-04 )(NA )(0.0777 )(1e-04 )(0.021 )(0.0946 )
Estimates ( 3 )0.68700.2359-0.7935-0.26530
(p-val)(3e-04 )(NA )(0.0402 )(0 )(0.0594 )(NA )
Estimates ( 4 )0.593800.2428-0.707900
(p-val)(0.0026 )(NA )(0.0276 )(2e-04 )(NA )(NA )
Estimates ( 5 )NANANANANANA
(p-val)(NA )(NA )(NA )(NA )(NA )(NA )
Estimates ( 6 )NANANANANANA
(p-val)(NA )(NA )(NA )(NA )(NA )(NA )
Estimates ( 7 )NANANANANANA
(p-val)(NA )(NA )(NA )(NA )(NA )(NA )
Estimates ( 8 )NANANANANANA
(p-val)(NA )(NA )(NA )(NA )(NA )(NA )
Estimates ( 9 )NANANANANANA
(p-val)(NA )(NA )(NA )(NA )(NA )(NA )
Estimates ( 10 )NANANANANANA
(p-val)(NA )(NA )(NA )(NA )(NA )(NA )
Estimates ( 11 )NANANANANANA
(p-val)(NA )(NA )(NA )(NA )(NA )(NA )


Estimated ARIMA Residuals
Value
0.0909998588820264
43.5787930660284
11.2006130069829
-13.2051118434295
30.2313766192893
14.7098510868088
20.3912360360791
-3.50034554121897
-13.6624311685008
-41.1358951249049
0.220285574063098
-44.5605526623378
30.8811000553234
25.2073045532978
29.6210542493291
-33.0149104676157
-4.69200162935041
82.3041288751046
15.2027917585268
-34.3814128968816
-40.0791201710101
-19.0749309965171
26.3749458316541
15.6356362700244
29.7395301798864
-52.4081138410542
-12.4721669927778
9.43121246025743
24.9324395861761
-78.5405607806784
1.76463594303790
21.6292704265512
4.88633996297614
22.4188619381278
41.9416922146414
17.8772075223655
-4.31180427732443
-7.42177322593325
-4.75256736242724
44.7152063708996
8.7665936326615
1.61315752198190
29.4389145772749
63.0294982245844
15.5246359276259
69.4737872333093
-27.6103476589233
2.81721172866006
21.5076715120835
-24.8593857182825
6.13392687052854
-17.5112955745466
-8.35794823519578
-21.5536236725636
-8.7715620325827
-19.2928112093271
12.4047707606600
-3.32716026916911
-35.4905877294056
55.215152956675
-18.6139618047272

\begin{tabular}{lllllllll}
\hline
Estimated ARIMA Residuals \tabularnewline
Value \tabularnewline
0.0909998588820264 \tabularnewline
43.5787930660284 \tabularnewline
11.2006130069829 \tabularnewline
-13.2051118434295 \tabularnewline
30.2313766192893 \tabularnewline
14.7098510868088 \tabularnewline
20.3912360360791 \tabularnewline
-3.50034554121897 \tabularnewline
-13.6624311685008 \tabularnewline
-41.1358951249049 \tabularnewline
0.220285574063098 \tabularnewline
-44.5605526623378 \tabularnewline
30.8811000553234 \tabularnewline
25.2073045532978 \tabularnewline
29.6210542493291 \tabularnewline
-33.0149104676157 \tabularnewline
-4.69200162935041 \tabularnewline
82.3041288751046 \tabularnewline
15.2027917585268 \tabularnewline
-34.3814128968816 \tabularnewline
-40.0791201710101 \tabularnewline
-19.0749309965171 \tabularnewline
26.3749458316541 \tabularnewline
15.6356362700244 \tabularnewline
29.7395301798864 \tabularnewline
-52.4081138410542 \tabularnewline
-12.4721669927778 \tabularnewline
9.43121246025743 \tabularnewline
24.9324395861761 \tabularnewline
-78.5405607806784 \tabularnewline
1.76463594303790 \tabularnewline
21.6292704265512 \tabularnewline
4.88633996297614 \tabularnewline
22.4188619381278 \tabularnewline
41.9416922146414 \tabularnewline
17.8772075223655 \tabularnewline
-4.31180427732443 \tabularnewline
-7.42177322593325 \tabularnewline
-4.75256736242724 \tabularnewline
44.7152063708996 \tabularnewline
8.7665936326615 \tabularnewline
1.61315752198190 \tabularnewline
29.4389145772749 \tabularnewline
63.0294982245844 \tabularnewline
15.5246359276259 \tabularnewline
69.4737872333093 \tabularnewline
-27.6103476589233 \tabularnewline
2.81721172866006 \tabularnewline
21.5076715120835 \tabularnewline
-24.8593857182825 \tabularnewline
6.13392687052854 \tabularnewline
-17.5112955745466 \tabularnewline
-8.35794823519578 \tabularnewline
-21.5536236725636 \tabularnewline
-8.7715620325827 \tabularnewline
-19.2928112093271 \tabularnewline
12.4047707606600 \tabularnewline
-3.32716026916911 \tabularnewline
-35.4905877294056 \tabularnewline
55.215152956675 \tabularnewline
-18.6139618047272 \tabularnewline
\hline
\end{tabular}
%Source: https://freestatistics.org/blog/index.php?pk=113037&T=2

[TABLE]
[ROW][C]Estimated ARIMA Residuals[/C][/ROW]
[ROW][C]Value[/C][/ROW]
[ROW][C]0.0909998588820264[/C][/ROW]
[ROW][C]43.5787930660284[/C][/ROW]
[ROW][C]11.2006130069829[/C][/ROW]
[ROW][C]-13.2051118434295[/C][/ROW]
[ROW][C]30.2313766192893[/C][/ROW]
[ROW][C]14.7098510868088[/C][/ROW]
[ROW][C]20.3912360360791[/C][/ROW]
[ROW][C]-3.50034554121897[/C][/ROW]
[ROW][C]-13.6624311685008[/C][/ROW]
[ROW][C]-41.1358951249049[/C][/ROW]
[ROW][C]0.220285574063098[/C][/ROW]
[ROW][C]-44.5605526623378[/C][/ROW]
[ROW][C]30.8811000553234[/C][/ROW]
[ROW][C]25.2073045532978[/C][/ROW]
[ROW][C]29.6210542493291[/C][/ROW]
[ROW][C]-33.0149104676157[/C][/ROW]
[ROW][C]-4.69200162935041[/C][/ROW]
[ROW][C]82.3041288751046[/C][/ROW]
[ROW][C]15.2027917585268[/C][/ROW]
[ROW][C]-34.3814128968816[/C][/ROW]
[ROW][C]-40.0791201710101[/C][/ROW]
[ROW][C]-19.0749309965171[/C][/ROW]
[ROW][C]26.3749458316541[/C][/ROW]
[ROW][C]15.6356362700244[/C][/ROW]
[ROW][C]29.7395301798864[/C][/ROW]
[ROW][C]-52.4081138410542[/C][/ROW]
[ROW][C]-12.4721669927778[/C][/ROW]
[ROW][C]9.43121246025743[/C][/ROW]
[ROW][C]24.9324395861761[/C][/ROW]
[ROW][C]-78.5405607806784[/C][/ROW]
[ROW][C]1.76463594303790[/C][/ROW]
[ROW][C]21.6292704265512[/C][/ROW]
[ROW][C]4.88633996297614[/C][/ROW]
[ROW][C]22.4188619381278[/C][/ROW]
[ROW][C]41.9416922146414[/C][/ROW]
[ROW][C]17.8772075223655[/C][/ROW]
[ROW][C]-4.31180427732443[/C][/ROW]
[ROW][C]-7.42177322593325[/C][/ROW]
[ROW][C]-4.75256736242724[/C][/ROW]
[ROW][C]44.7152063708996[/C][/ROW]
[ROW][C]8.7665936326615[/C][/ROW]
[ROW][C]1.61315752198190[/C][/ROW]
[ROW][C]29.4389145772749[/C][/ROW]
[ROW][C]63.0294982245844[/C][/ROW]
[ROW][C]15.5246359276259[/C][/ROW]
[ROW][C]69.4737872333093[/C][/ROW]
[ROW][C]-27.6103476589233[/C][/ROW]
[ROW][C]2.81721172866006[/C][/ROW]
[ROW][C]21.5076715120835[/C][/ROW]
[ROW][C]-24.8593857182825[/C][/ROW]
[ROW][C]6.13392687052854[/C][/ROW]
[ROW][C]-17.5112955745466[/C][/ROW]
[ROW][C]-8.35794823519578[/C][/ROW]
[ROW][C]-21.5536236725636[/C][/ROW]
[ROW][C]-8.7715620325827[/C][/ROW]
[ROW][C]-19.2928112093271[/C][/ROW]
[ROW][C]12.4047707606600[/C][/ROW]
[ROW][C]-3.32716026916911[/C][/ROW]
[ROW][C]-35.4905877294056[/C][/ROW]
[ROW][C]55.215152956675[/C][/ROW]
[ROW][C]-18.6139618047272[/C][/ROW]
[/TABLE]
Source: https://freestatistics.org/blog/index.php?pk=113037&T=2

Globally Unique Identifier (entire table): ba.freestatistics.org/blog/index.php?pk=113037&T=2

As an alternative you can also use a QR Code:  

The GUIDs for individual cells are displayed in the table below:

Estimated ARIMA Residuals
Value
0.0909998588820264
43.5787930660284
11.2006130069829
-13.2051118434295
30.2313766192893
14.7098510868088
20.3912360360791
-3.50034554121897
-13.6624311685008
-41.1358951249049
0.220285574063098
-44.5605526623378
30.8811000553234
25.2073045532978
29.6210542493291
-33.0149104676157
-4.69200162935041
82.3041288751046
15.2027917585268
-34.3814128968816
-40.0791201710101
-19.0749309965171
26.3749458316541
15.6356362700244
29.7395301798864
-52.4081138410542
-12.4721669927778
9.43121246025743
24.9324395861761
-78.5405607806784
1.76463594303790
21.6292704265512
4.88633996297614
22.4188619381278
41.9416922146414
17.8772075223655
-4.31180427732443
-7.42177322593325
-4.75256736242724
44.7152063708996
8.7665936326615
1.61315752198190
29.4389145772749
63.0294982245844
15.5246359276259
69.4737872333093
-27.6103476589233
2.81721172866006
21.5076715120835
-24.8593857182825
6.13392687052854
-17.5112955745466
-8.35794823519578
-21.5536236725636
-8.7715620325827
-19.2928112093271
12.4047707606600
-3.32716026916911
-35.4905877294056
55.215152956675
-18.6139618047272


Parameters (Session):
par1 = FALSE ; par2 = 1 ; par3 = 0 ; par4 = 1 ; par5 = 12 ; par6 = 3 ; par7 = 1 ; par8 = 2 ; par9 = 0 ;
Parameters (R input):
par1 = FALSE ; par2 = 1 ; par3 = 0 ; par4 = 1 ; par5 = 12 ; par6 = 3 ; par7 = 1 ; par8 = 2 ; par9 = 0 ;
R code (references can be found in the software module):
library(lattice)
if (par1 == 'TRUE') par1 <- TRUE
if (par1 == 'FALSE') par1 <- FALSE
par2 <- as.numeric(par2) #Box-Cox lambda transformation parameter
par3 <- as.numeric(par3) #degree of non-seasonal differencing
par4 <- as.numeric(par4) #degree of seasonal differencing
par5 <- as.numeric(par5) #seasonal period
par6 <- as.numeric(par6) #degree (p) of the non-seasonal AR(p) polynomial
par7 <- as.numeric(par7) #degree (q) of the non-seasonal MA(q) polynomial
par8 <- as.numeric(par8) #degree (P) of the seasonal AR(P) polynomial
par9 <- as.numeric(par9) #degree (Q) of the seasonal MA(Q) polynomial
armaGR <- function(arima.out, names, n){
try1 <- arima.out$coef
try2 <- sqrt(diag(arima.out$var.coef))
try.data.frame <- data.frame(matrix(NA,ncol=4,nrow=length(names)))
dimnames(try.data.frame) <- list(names,c('coef','std','tstat','pv'))
try.data.frame[,1] <- try1
for(i in 1:length(try2)) try.data.frame[which(rownames(try.data.frame)==names(try2)[i]),2] <- try2[i]
try.data.frame[,3] <- try.data.frame[,1] / try.data.frame[,2]
try.data.frame[,4] <- round((1-pt(abs(try.data.frame[,3]),df=n-(length(try2)+1)))*2,5)
vector <- rep(NA,length(names))
vector[is.na(try.data.frame[,4])] <- 0
maxi <- which.max(try.data.frame[,4])
continue <- max(try.data.frame[,4],na.rm=TRUE) > .05
vector[maxi] <- 0
list(summary=try.data.frame,next.vector=vector,continue=continue)
}
arimaSelect <- function(series, order=c(13,0,0), seasonal=list(order=c(2,0,0),period=12), include.mean=F){
nrc <- order[1]+order[3]+seasonal$order[1]+seasonal$order[3]
coeff <- matrix(NA, nrow=nrc*2, ncol=nrc)
pval <- matrix(NA, nrow=nrc*2, ncol=nrc)
mylist <- rep(list(NULL), nrc)
names <- NULL
if(order[1] > 0) names <- paste('ar',1:order[1],sep='')
if(order[3] > 0) names <- c( names , paste('ma',1:order[3],sep='') )
if(seasonal$order[1] > 0) names <- c(names, paste('sar',1:seasonal$order[1],sep=''))
if(seasonal$order[3] > 0) names <- c(names, paste('sma',1:seasonal$order[3],sep=''))
arima.out <- arima(series, order=order, seasonal=seasonal, include.mean=include.mean, method='ML')
mylist[[1]] <- arima.out
last.arma <- armaGR(arima.out, names, length(series))
mystop <- FALSE
i <- 1
coeff[i,] <- last.arma[[1]][,1]
pval [i,] <- last.arma[[1]][,4]
i <- 2
aic <- arima.out$aic
while(!mystop){
mylist[[i]] <- arima.out
arima.out <- arima(series, order=order, seasonal=seasonal, include.mean=include.mean, method='ML', fixed=last.arma$next.vector)
aic <- c(aic, arima.out$aic)
last.arma <- armaGR(arima.out, names, length(series))
mystop <- !last.arma$continue
coeff[i,] <- last.arma[[1]][,1]
pval [i,] <- last.arma[[1]][,4]
i <- i+1
}
list(coeff, pval, mylist, aic=aic)
}
arimaSelectplot <- function(arimaSelect.out,noms,choix){
noms <- names(arimaSelect.out[[3]][[1]]$coef)
coeff <- arimaSelect.out[[1]]
k <- min(which(is.na(coeff[,1])))-1
coeff <- coeff[1:k,]
pval <- arimaSelect.out[[2]][1:k,]
aic <- arimaSelect.out$aic[1:k]
coeff[coeff==0] <- NA
n <- ncol(coeff)
if(missing(choix)) choix <- k
layout(matrix(c(1,1,1,2,
3,3,3,2,
3,3,3,4,
5,6,7,7),nr=4),
widths=c(10,35,45,15),
heights=c(30,30,15,15))
couleurs <- rainbow(75)[1:50]#(50)
ticks <- pretty(coeff)
par(mar=c(1,1,3,1))
plot(aic,k:1-.5,type='o',pch=21,bg='blue',cex=2,axes=F,lty=2,xpd=NA)
points(aic[choix],k-choix+.5,pch=21,cex=4,bg=2,xpd=NA)
title('aic',line=2)
par(mar=c(3,0,0,0))
plot(0,axes=F,xlab='',ylab='',xlim=range(ticks),ylim=c(.1,1))
rect(xleft = min(ticks) + (0:49)/50*(max(ticks)-min(ticks)),
xright = min(ticks) + (1:50)/50*(max(ticks)-min(ticks)),
ytop = rep(1,50),
ybottom= rep(0,50),col=couleurs,border=NA)
axis(1,ticks)
rect(xleft=min(ticks),xright=max(ticks),ytop=1,ybottom=0)
text(mean(coeff,na.rm=T),.5,'coefficients',cex=2,font=2)
par(mar=c(1,1,3,1))
image(1:n,1:k,t(coeff[k:1,]),axes=F,col=couleurs,zlim=range(ticks))
for(i in 1:n) for(j in 1:k) if(!is.na(coeff[j,i])) {
if(pval[j,i]<.01) symb = 'green'
else if( (pval[j,i]<.05) & (pval[j,i]>=.01)) symb = 'orange'
else if( (pval[j,i]<.1) & (pval[j,i]>=.05)) symb = 'red'
else symb = 'black'
polygon(c(i+.5 ,i+.2 ,i+.5 ,i+.5),
c(k-j+0.5,k-j+0.5,k-j+0.8,k-j+0.5),
col=symb)
if(j==choix) {
rect(xleft=i-.5,
xright=i+.5,
ybottom=k-j+1.5,
ytop=k-j+.5,
lwd=4)
text(i,
k-j+1,
round(coeff[j,i],2),
cex=1.2,
font=2)
}
else{
rect(xleft=i-.5,xright=i+.5,ybottom=k-j+1.5,ytop=k-j+.5)
text(i,k-j+1,round(coeff[j,i],2),cex=1.2,font=1)
}
}
axis(3,1:n,noms)
par(mar=c(0.5,0,0,0.5))
plot(0,axes=F,xlab='',ylab='',type='n',xlim=c(0,8),ylim=c(-.2,.8))
cols <- c('green','orange','red','black')
niv <- c('0','0.01','0.05','0.1')
for(i in 0:3){
polygon(c(1+2*i ,1+2*i ,1+2*i-.5 ,1+2*i),
c(.4 ,.7 , .4 , .4),
col=cols[i+1])
text(2*i,0.5,niv[i+1],cex=1.5)
}
text(8,.5,1,cex=1.5)
text(4,0,'p-value',cex=2)
box()
residus <- arimaSelect.out[[3]][[choix]]$res
par(mar=c(1,2,4,1))
acf(residus,main='')
title('acf',line=.5)
par(mar=c(1,2,4,1))
pacf(residus,main='')
title('pacf',line=.5)
par(mar=c(2,2,4,1))
qqnorm(residus,main='')
title('qq-norm',line=.5)
qqline(residus)
residus
}
if (par2 == 0) x <- log(x)
if (par2 != 0) x <- x^par2
(selection <- arimaSelect(x, order=c(par6,par3,par7), seasonal=list(order=c(par8,par4,par9), period=par5)))
bitmap(file='test1.png')
resid <- arimaSelectplot(selection)
dev.off()
resid
bitmap(file='test2.png')
acf(resid,length(resid)/2, main='Residual Autocorrelation Function')
dev.off()
bitmap(file='test3.png')
pacf(resid,length(resid)/2, main='Residual Partial Autocorrelation Function')
dev.off()
bitmap(file='test4.png')
cpgram(resid, main='Residual Cumulative Periodogram')
dev.off()
bitmap(file='test5.png')
hist(resid, main='Residual Histogram', xlab='values of Residuals')
dev.off()
bitmap(file='test6.png')
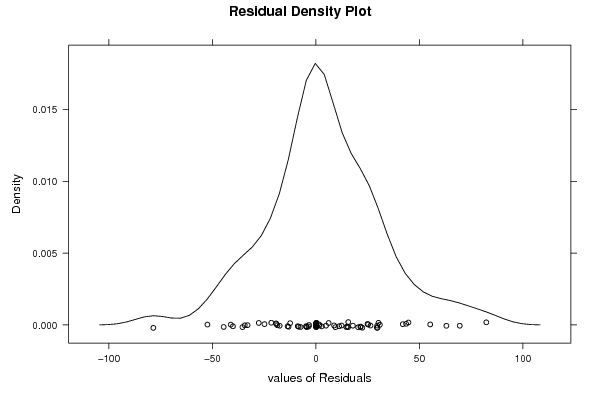
densityplot(~resid,col='black',main='Residual Density Plot', xlab='values of Residuals')
dev.off()
bitmap(file='test7.png')
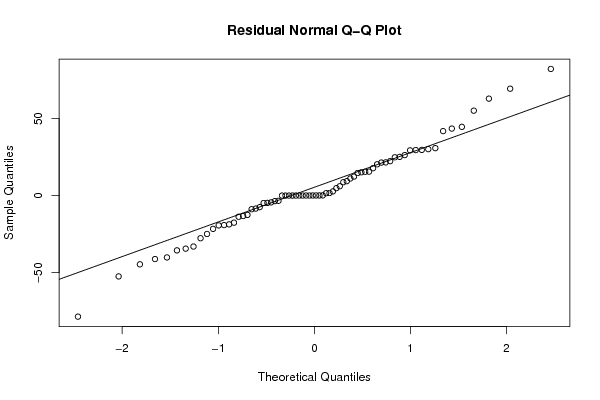
qqnorm(resid, main='Residual Normal Q-Q Plot')
qqline(resid)
dev.off()
ncols <- length(selection[[1]][1,])
nrows <- length(selection[[2]][,1])-1
load(file='createtable')
a<-table.start()
a<-table.row.start(a)
a<-table.element(a,'ARIMA Parameter Estimation and Backward Selection', ncols+1,TRUE)
a<-table.row.end(a)
a<-table.row.start(a)
a<-table.element(a,'Iteration', header=TRUE)
for (i in 1:ncols) {
a<-table.element(a,names(selection[[3]][[1]]$coef)[i],header=TRUE)
}
a<-table.row.end(a)
for (j in 1:nrows) {
a<-table.row.start(a)
mydum <- 'Estimates ('
mydum <- paste(mydum,j)
mydum <- paste(mydum,')')
a<-table.element(a,mydum, header=TRUE)
for (i in 1:ncols) {
a<-table.element(a,round(selection[[1]][j,i],4))
}
a<-table.row.end(a)
a<-table.row.start(a)
a<-table.element(a,'(p-val)', header=TRUE)
for (i in 1:ncols) {
mydum <- '('
mydum <- paste(mydum,round(selection[[2]][j,i],4),sep='')
mydum <- paste(mydum,')')
a<-table.element(a,mydum)
}
a<-table.row.end(a)
}
a<-table.end(a)
table.save(a,file='mytable.tab')
a<-table.start()
a<-table.row.start(a)
a<-table.element(a,'Estimated ARIMA Residuals', 1,TRUE)
a<-table.row.end(a)
a<-table.row.start(a)
a<-table.element(a,'Value', 1,TRUE)
a<-table.row.end(a)
for (i in (par4*par5+par3):length(resid)) {
a<-table.row.start(a)
a<-table.element(a,resid[i])
a<-table.row.end(a)
}
a<-table.end(a)
table.save(a,file='mytable1.tab')