Free Statistics

of Irreproducible Research!

Author's title

Author*The author of this computation has been verified*
R Software Modulerwasp_autocorrelation.wasp
Title produced by software(Partial) Autocorrelation Function
Date of computationMon, 20 Dec 2010 12:05:25 +0000
Cite this page as followsStatistical Computations at FreeStatistics.org, Office for Research Development and Education, URL https://freestatistics.org/blog/index.php?v=date/2010/Dec/20/t1292846615vwly9br92fb6yav.htm/, Retrieved Fri, 03 May 2024 23:26:28 +0000
Statistical Computations at FreeStatistics.org, Office for Research Development and Education, URL https://freestatistics.org/blog/index.php?pk=112862, Retrieved Fri, 03 May 2024 23:26:28 +0000
QR Codes:

Original text written by user:
IsPrivate?No (this computation is public)
User-defined keywords
Estimated Impact167
Family? (F = Feedback message, R = changed R code, M = changed R Module, P = changed Parameters, D = changed Data)
-     [Univariate Data Series] [data set] [2008-12-01 19:54:57] [b98453cac15ba1066b407e146608df68]
- RMP   [Exponential Smoothing] [Unemployment] [2010-11-30 13:37:23] [b98453cac15ba1066b407e146608df68]
- RMPD      [(Partial) Autocorrelation Function] [Werkloosheid-ACF] [2010-12-20 12:05:25] [4c7d8c32b2e34fcaa7f14928b91d45ae] [Current]
Feedback Forum

Post a new message
Dataseries X:
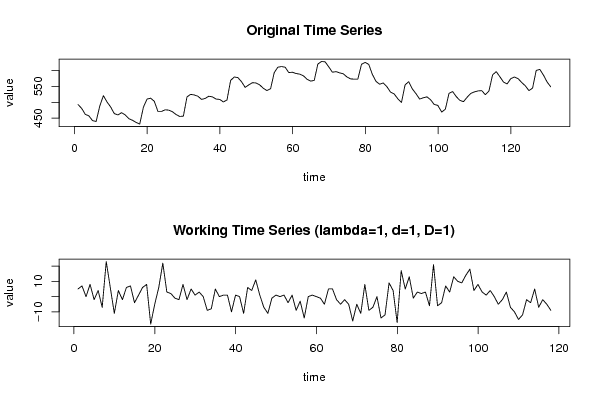
493
481
462
457
442
439
488
521
501
485
464
460
467
460
448
443
436
431
484
510
513
503
471
471
476
475
470
461
455
456
517
525
523
519
509
512
519
517
510
509
501
507
569
580
578
565
547
555
562
561
555
544
537
543
594
611
613
611
594
595
591
589
584
573
567
569
621
629
628
612
595
597
593
590
580
574
573
573
620
626
620
588
566
557
561
549
532
526
511
499
555
565
542
527
510
514
517
508
493
490
469
478
528
534
518
506
502
516
528
533
536
537
524
536
587
597
581
564
558
575
580
575
563
552
537
545
601
604
586
564
549


Summary of computational transaction
Raw Inputview raw input (R code)
Raw Outputview raw output of R engine
Computing time3 seconds
R Server'Gwilym Jenkins' @ 72.249.127.135

\begin{tabular}{lllllllll}
\hline
Summary of computational transaction \tabularnewline
Raw Input & view raw input (R code)  \tabularnewline
Raw Output & view raw output of R engine  \tabularnewline
Computing time & 3 seconds \tabularnewline
R Server & 'Gwilym Jenkins' @ 72.249.127.135 \tabularnewline
\hline
\end{tabular}
%Source: https://freestatistics.org/blog/index.php?pk=112862&T=0

[TABLE]
[ROW][C]Summary of computational transaction[/C][/ROW]
[ROW][C]Raw Input[/C][C]view raw input (R code) [/C][/ROW]
[ROW][C]Raw Output[/C][C]view raw output of R engine [/C][/ROW]
[ROW][C]Computing time[/C][C]3 seconds[/C][/ROW]
[ROW][C]R Server[/C][C]'Gwilym Jenkins' @ 72.249.127.135[/C][/ROW]
[/TABLE]
Source: https://freestatistics.org/blog/index.php?pk=112862&T=0

Globally Unique Identifier (entire table): ba.freestatistics.org/blog/index.php?pk=112862&T=0

As an alternative you can also use a QR Code:  

The GUIDs for individual cells are displayed in the table below:

Summary of computational transaction
Raw Inputview raw input (R code)
Raw Outputview raw output of R engine
Computing time3 seconds
R Server'Gwilym Jenkins' @ 72.249.127.135


Autocorrelation Function
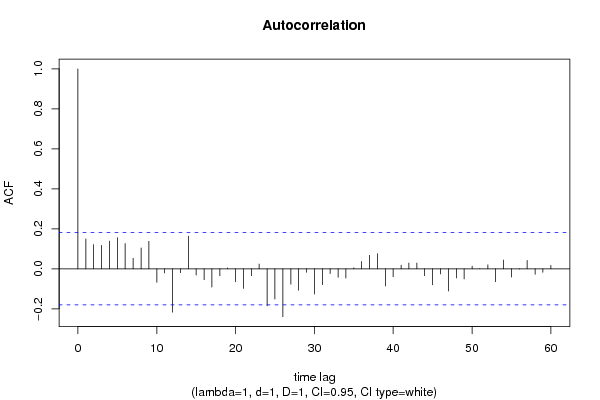
Time lag kACF(k)T-STATP-value
10.1494711.62370.053557
20.1211191.31570.095415
30.1171751.27290.102787
40.138451.5040.067633
50.1558611.69310.046539
60.1265281.37440.085954
70.0530250.5760.282857
80.1046311.13660.129008
90.1374171.49270.069089
10-0.067768-0.73620.23155
11-0.02047-0.22240.412209
12-0.21729-2.36040.009948
13-0.019437-0.21110.416572
140.1633091.7740.039322
15-0.03159-0.34320.366046
16-0.054637-0.59350.276987
17-0.091638-0.99540.160778
18-0.035458-0.38520.350402
190.0040360.04380.482553
20-0.065276-0.70910.239836
21-0.098315-1.0680.143856
22-0.03425-0.37210.35526
230.0238330.25890.398084
24-0.185555-2.01560.023054
25-0.15169-1.64780.05103
26-0.23953-2.6020.005228
27-0.077117-0.83770.201944
28-0.107374-1.16640.122906
29-0.017656-0.19180.424117
30-0.126347-1.37250.086259
31-0.079856-0.86750.193726
32-0.023965-0.26030.397532
33-0.042536-0.46210.322445
34-0.046672-0.5070.306555
350.0050670.0550.478098
360.0369340.40120.344496
370.0671850.72980.233473
380.075470.81980.206989
39-0.085701-0.9310.176889
40-0.039459-0.42860.334486
410.0178940.19440.423108
420.0287470.31230.377693
430.0284540.30910.378898
44-0.034706-0.3770.353423
45-0.080107-0.87020.192983
46-0.025506-0.27710.391108
47-0.111732-1.21370.11364
48-0.045965-0.49930.309245
49-0.050659-0.55030.291578
500.0132250.14370.443008
517.4e-058e-040.499679
520.019830.21540.414911
53-0.064302-0.69850.243119
540.0434450.47190.318924
55-0.041263-0.44820.327403
56-0.001268-0.01380.494516
570.0419530.45570.324713
58-0.027763-0.30160.381751
59-0.017924-0.19470.422978
600.0169390.1840.427164

\begin{tabular}{lllllllll}
\hline
Autocorrelation Function \tabularnewline
Time lag k & ACF(k) & T-STAT & P-value \tabularnewline
1 & 0.149471 & 1.6237 & 0.053557 \tabularnewline
2 & 0.121119 & 1.3157 & 0.095415 \tabularnewline
3 & 0.117175 & 1.2729 & 0.102787 \tabularnewline
4 & 0.13845 & 1.504 & 0.067633 \tabularnewline
5 & 0.155861 & 1.6931 & 0.046539 \tabularnewline
6 & 0.126528 & 1.3744 & 0.085954 \tabularnewline
7 & 0.053025 & 0.576 & 0.282857 \tabularnewline
8 & 0.104631 & 1.1366 & 0.129008 \tabularnewline
9 & 0.137417 & 1.4927 & 0.069089 \tabularnewline
10 & -0.067768 & -0.7362 & 0.23155 \tabularnewline
11 & -0.02047 & -0.2224 & 0.412209 \tabularnewline
12 & -0.21729 & -2.3604 & 0.009948 \tabularnewline
13 & -0.019437 & -0.2111 & 0.416572 \tabularnewline
14 & 0.163309 & 1.774 & 0.039322 \tabularnewline
15 & -0.03159 & -0.3432 & 0.366046 \tabularnewline
16 & -0.054637 & -0.5935 & 0.276987 \tabularnewline
17 & -0.091638 & -0.9954 & 0.160778 \tabularnewline
18 & -0.035458 & -0.3852 & 0.350402 \tabularnewline
19 & 0.004036 & 0.0438 & 0.482553 \tabularnewline
20 & -0.065276 & -0.7091 & 0.239836 \tabularnewline
21 & -0.098315 & -1.068 & 0.143856 \tabularnewline
22 & -0.03425 & -0.3721 & 0.35526 \tabularnewline
23 & 0.023833 & 0.2589 & 0.398084 \tabularnewline
24 & -0.185555 & -2.0156 & 0.023054 \tabularnewline
25 & -0.15169 & -1.6478 & 0.05103 \tabularnewline
26 & -0.23953 & -2.602 & 0.005228 \tabularnewline
27 & -0.077117 & -0.8377 & 0.201944 \tabularnewline
28 & -0.107374 & -1.1664 & 0.122906 \tabularnewline
29 & -0.017656 & -0.1918 & 0.424117 \tabularnewline
30 & -0.126347 & -1.3725 & 0.086259 \tabularnewline
31 & -0.079856 & -0.8675 & 0.193726 \tabularnewline
32 & -0.023965 & -0.2603 & 0.397532 \tabularnewline
33 & -0.042536 & -0.4621 & 0.322445 \tabularnewline
34 & -0.046672 & -0.507 & 0.306555 \tabularnewline
35 & 0.005067 & 0.055 & 0.478098 \tabularnewline
36 & 0.036934 & 0.4012 & 0.344496 \tabularnewline
37 & 0.067185 & 0.7298 & 0.233473 \tabularnewline
38 & 0.07547 & 0.8198 & 0.206989 \tabularnewline
39 & -0.085701 & -0.931 & 0.176889 \tabularnewline
40 & -0.039459 & -0.4286 & 0.334486 \tabularnewline
41 & 0.017894 & 0.1944 & 0.423108 \tabularnewline
42 & 0.028747 & 0.3123 & 0.377693 \tabularnewline
43 & 0.028454 & 0.3091 & 0.378898 \tabularnewline
44 & -0.034706 & -0.377 & 0.353423 \tabularnewline
45 & -0.080107 & -0.8702 & 0.192983 \tabularnewline
46 & -0.025506 & -0.2771 & 0.391108 \tabularnewline
47 & -0.111732 & -1.2137 & 0.11364 \tabularnewline
48 & -0.045965 & -0.4993 & 0.309245 \tabularnewline
49 & -0.050659 & -0.5503 & 0.291578 \tabularnewline
50 & 0.013225 & 0.1437 & 0.443008 \tabularnewline
51 & 7.4e-05 & 8e-04 & 0.499679 \tabularnewline
52 & 0.01983 & 0.2154 & 0.414911 \tabularnewline
53 & -0.064302 & -0.6985 & 0.243119 \tabularnewline
54 & 0.043445 & 0.4719 & 0.318924 \tabularnewline
55 & -0.041263 & -0.4482 & 0.327403 \tabularnewline
56 & -0.001268 & -0.0138 & 0.494516 \tabularnewline
57 & 0.041953 & 0.4557 & 0.324713 \tabularnewline
58 & -0.027763 & -0.3016 & 0.381751 \tabularnewline
59 & -0.017924 & -0.1947 & 0.422978 \tabularnewline
60 & 0.016939 & 0.184 & 0.427164 \tabularnewline
\hline
\end{tabular}
%Source: https://freestatistics.org/blog/index.php?pk=112862&T=1

[TABLE]
[ROW][C]Autocorrelation Function[/C][/ROW]
[ROW][C]Time lag k[/C][C]ACF(k)[/C][C]T-STAT[/C][C]P-value[/C][/ROW]
[ROW][C]1[/C][C]0.149471[/C][C]1.6237[/C][C]0.053557[/C][/ROW]
[ROW][C]2[/C][C]0.121119[/C][C]1.3157[/C][C]0.095415[/C][/ROW]
[ROW][C]3[/C][C]0.117175[/C][C]1.2729[/C][C]0.102787[/C][/ROW]
[ROW][C]4[/C][C]0.13845[/C][C]1.504[/C][C]0.067633[/C][/ROW]
[ROW][C]5[/C][C]0.155861[/C][C]1.6931[/C][C]0.046539[/C][/ROW]
[ROW][C]6[/C][C]0.126528[/C][C]1.3744[/C][C]0.085954[/C][/ROW]
[ROW][C]7[/C][C]0.053025[/C][C]0.576[/C][C]0.282857[/C][/ROW]
[ROW][C]8[/C][C]0.104631[/C][C]1.1366[/C][C]0.129008[/C][/ROW]
[ROW][C]9[/C][C]0.137417[/C][C]1.4927[/C][C]0.069089[/C][/ROW]
[ROW][C]10[/C][C]-0.067768[/C][C]-0.7362[/C][C]0.23155[/C][/ROW]
[ROW][C]11[/C][C]-0.02047[/C][C]-0.2224[/C][C]0.412209[/C][/ROW]
[ROW][C]12[/C][C]-0.21729[/C][C]-2.3604[/C][C]0.009948[/C][/ROW]
[ROW][C]13[/C][C]-0.019437[/C][C]-0.2111[/C][C]0.416572[/C][/ROW]
[ROW][C]14[/C][C]0.163309[/C][C]1.774[/C][C]0.039322[/C][/ROW]
[ROW][C]15[/C][C]-0.03159[/C][C]-0.3432[/C][C]0.366046[/C][/ROW]
[ROW][C]16[/C][C]-0.054637[/C][C]-0.5935[/C][C]0.276987[/C][/ROW]
[ROW][C]17[/C][C]-0.091638[/C][C]-0.9954[/C][C]0.160778[/C][/ROW]
[ROW][C]18[/C][C]-0.035458[/C][C]-0.3852[/C][C]0.350402[/C][/ROW]
[ROW][C]19[/C][C]0.004036[/C][C]0.0438[/C][C]0.482553[/C][/ROW]
[ROW][C]20[/C][C]-0.065276[/C][C]-0.7091[/C][C]0.239836[/C][/ROW]
[ROW][C]21[/C][C]-0.098315[/C][C]-1.068[/C][C]0.143856[/C][/ROW]
[ROW][C]22[/C][C]-0.03425[/C][C]-0.3721[/C][C]0.35526[/C][/ROW]
[ROW][C]23[/C][C]0.023833[/C][C]0.2589[/C][C]0.398084[/C][/ROW]
[ROW][C]24[/C][C]-0.185555[/C][C]-2.0156[/C][C]0.023054[/C][/ROW]
[ROW][C]25[/C][C]-0.15169[/C][C]-1.6478[/C][C]0.05103[/C][/ROW]
[ROW][C]26[/C][C]-0.23953[/C][C]-2.602[/C][C]0.005228[/C][/ROW]
[ROW][C]27[/C][C]-0.077117[/C][C]-0.8377[/C][C]0.201944[/C][/ROW]
[ROW][C]28[/C][C]-0.107374[/C][C]-1.1664[/C][C]0.122906[/C][/ROW]
[ROW][C]29[/C][C]-0.017656[/C][C]-0.1918[/C][C]0.424117[/C][/ROW]
[ROW][C]30[/C][C]-0.126347[/C][C]-1.3725[/C][C]0.086259[/C][/ROW]
[ROW][C]31[/C][C]-0.079856[/C][C]-0.8675[/C][C]0.193726[/C][/ROW]
[ROW][C]32[/C][C]-0.023965[/C][C]-0.2603[/C][C]0.397532[/C][/ROW]
[ROW][C]33[/C][C]-0.042536[/C][C]-0.4621[/C][C]0.322445[/C][/ROW]
[ROW][C]34[/C][C]-0.046672[/C][C]-0.507[/C][C]0.306555[/C][/ROW]
[ROW][C]35[/C][C]0.005067[/C][C]0.055[/C][C]0.478098[/C][/ROW]
[ROW][C]36[/C][C]0.036934[/C][C]0.4012[/C][C]0.344496[/C][/ROW]
[ROW][C]37[/C][C]0.067185[/C][C]0.7298[/C][C]0.233473[/C][/ROW]
[ROW][C]38[/C][C]0.07547[/C][C]0.8198[/C][C]0.206989[/C][/ROW]
[ROW][C]39[/C][C]-0.085701[/C][C]-0.931[/C][C]0.176889[/C][/ROW]
[ROW][C]40[/C][C]-0.039459[/C][C]-0.4286[/C][C]0.334486[/C][/ROW]
[ROW][C]41[/C][C]0.017894[/C][C]0.1944[/C][C]0.423108[/C][/ROW]
[ROW][C]42[/C][C]0.028747[/C][C]0.3123[/C][C]0.377693[/C][/ROW]
[ROW][C]43[/C][C]0.028454[/C][C]0.3091[/C][C]0.378898[/C][/ROW]
[ROW][C]44[/C][C]-0.034706[/C][C]-0.377[/C][C]0.353423[/C][/ROW]
[ROW][C]45[/C][C]-0.080107[/C][C]-0.8702[/C][C]0.192983[/C][/ROW]
[ROW][C]46[/C][C]-0.025506[/C][C]-0.2771[/C][C]0.391108[/C][/ROW]
[ROW][C]47[/C][C]-0.111732[/C][C]-1.2137[/C][C]0.11364[/C][/ROW]
[ROW][C]48[/C][C]-0.045965[/C][C]-0.4993[/C][C]0.309245[/C][/ROW]
[ROW][C]49[/C][C]-0.050659[/C][C]-0.5503[/C][C]0.291578[/C][/ROW]
[ROW][C]50[/C][C]0.013225[/C][C]0.1437[/C][C]0.443008[/C][/ROW]
[ROW][C]51[/C][C]7.4e-05[/C][C]8e-04[/C][C]0.499679[/C][/ROW]
[ROW][C]52[/C][C]0.01983[/C][C]0.2154[/C][C]0.414911[/C][/ROW]
[ROW][C]53[/C][C]-0.064302[/C][C]-0.6985[/C][C]0.243119[/C][/ROW]
[ROW][C]54[/C][C]0.043445[/C][C]0.4719[/C][C]0.318924[/C][/ROW]
[ROW][C]55[/C][C]-0.041263[/C][C]-0.4482[/C][C]0.327403[/C][/ROW]
[ROW][C]56[/C][C]-0.001268[/C][C]-0.0138[/C][C]0.494516[/C][/ROW]
[ROW][C]57[/C][C]0.041953[/C][C]0.4557[/C][C]0.324713[/C][/ROW]
[ROW][C]58[/C][C]-0.027763[/C][C]-0.3016[/C][C]0.381751[/C][/ROW]
[ROW][C]59[/C][C]-0.017924[/C][C]-0.1947[/C][C]0.422978[/C][/ROW]
[ROW][C]60[/C][C]0.016939[/C][C]0.184[/C][C]0.427164[/C][/ROW]
[/TABLE]
Source: https://freestatistics.org/blog/index.php?pk=112862&T=1

Globally Unique Identifier (entire table): ba.freestatistics.org/blog/index.php?pk=112862&T=1

As an alternative you can also use a QR Code:  

The GUIDs for individual cells are displayed in the table below:

Autocorrelation Function
Time lag kACF(k)T-STATP-value
10.1494711.62370.053557
20.1211191.31570.095415
30.1171751.27290.102787
40.138451.5040.067633
50.1558611.69310.046539
60.1265281.37440.085954
70.0530250.5760.282857
80.1046311.13660.129008
90.1374171.49270.069089
10-0.067768-0.73620.23155
11-0.02047-0.22240.412209
12-0.21729-2.36040.009948
13-0.019437-0.21110.416572
140.1633091.7740.039322
15-0.03159-0.34320.366046
16-0.054637-0.59350.276987
17-0.091638-0.99540.160778
18-0.035458-0.38520.350402
190.0040360.04380.482553
20-0.065276-0.70910.239836
21-0.098315-1.0680.143856
22-0.03425-0.37210.35526
230.0238330.25890.398084
24-0.185555-2.01560.023054
25-0.15169-1.64780.05103
26-0.23953-2.6020.005228
27-0.077117-0.83770.201944
28-0.107374-1.16640.122906
29-0.017656-0.19180.424117
30-0.126347-1.37250.086259
31-0.079856-0.86750.193726
32-0.023965-0.26030.397532
33-0.042536-0.46210.322445
34-0.046672-0.5070.306555
350.0050670.0550.478098
360.0369340.40120.344496
370.0671850.72980.233473
380.075470.81980.206989
39-0.085701-0.9310.176889
40-0.039459-0.42860.334486
410.0178940.19440.423108
420.0287470.31230.377693
430.0284540.30910.378898
44-0.034706-0.3770.353423
45-0.080107-0.87020.192983
46-0.025506-0.27710.391108
47-0.111732-1.21370.11364
48-0.045965-0.49930.309245
49-0.050659-0.55030.291578
500.0132250.14370.443008
517.4e-058e-040.499679
520.019830.21540.414911
53-0.064302-0.69850.243119
540.0434450.47190.318924
55-0.041263-0.44820.327403
56-0.001268-0.01380.494516
570.0419530.45570.324713
58-0.027763-0.30160.381751
59-0.017924-0.19470.422978
600.0169390.1840.427164


Partial Autocorrelation Function
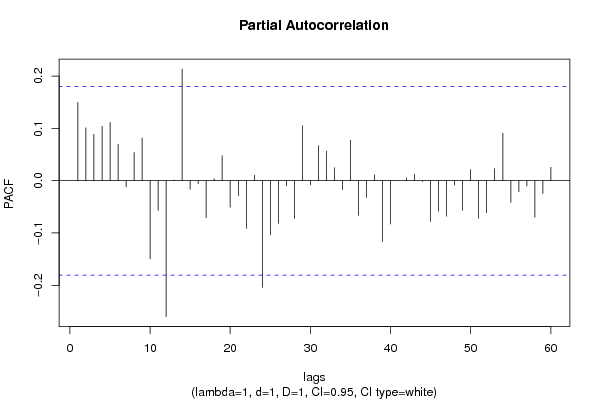
Time lag kPACF(k)T-STATP-value
10.1494711.62370.053557
20.1010341.09750.137326
30.0886650.96310.168722
40.1038551.12810.130773
50.1113281.20930.114476
60.0691440.75110.227044
7-0.011802-0.12820.449104
80.0537470.58380.280222
90.081560.8860.188719
10-0.149247-1.62120.053818
11-0.056902-0.61810.268846
12-0.259991-2.82420.002783
130.0012040.01310.494796
140.2135662.31990.011032
15-0.016482-0.1790.429105
16-0.005462-0.05930.476393
17-0.070838-0.76950.221568
180.0036340.03950.484288
190.0478490.51980.302096
20-0.050633-0.550.291675
21-0.028471-0.30930.378828
22-0.091181-0.99050.161983
230.0101030.10970.4564
24-0.204193-2.21810.014231
25-0.103545-1.12480.131481
26-0.081605-0.88650.188588
27-0.009936-0.10790.457116
28-0.072565-0.78830.216062
290.1048661.13910.128476
30-0.007984-0.08670.465516
310.0665630.72310.235536
320.0563390.6120.270859
330.024720.26850.39438
34-0.017239-0.18730.425889
350.0773770.84050.201155
36-0.066326-0.72050.236325
37-0.031878-0.34630.364872
380.0110090.11960.452505
39-0.116451-1.2650.104184
40-0.082687-0.89820.185452
410.0001270.00140.499451
420.0052730.05730.477209
430.0128610.13970.444565
44-0.001845-0.020.492024
45-0.078021-0.84750.199211
46-0.058417-0.63460.263468
47-0.067869-0.73720.231219
48-0.008075-0.08770.465127
49-0.056584-0.61470.269981
500.0213150.23150.408648
51-0.071867-0.78070.218277
52-0.061239-0.66520.253602
530.023250.25260.400522
540.0906060.98420.163506
55-0.041923-0.45540.324828
56-0.021351-0.23190.408497
57-0.010077-0.10950.456509
58-0.06994-0.75970.224462
59-0.024524-0.26640.395198
600.0255570.27760.390894

\begin{tabular}{lllllllll}
\hline
Partial Autocorrelation Function \tabularnewline
Time lag k & PACF(k) & T-STAT & P-value \tabularnewline
1 & 0.149471 & 1.6237 & 0.053557 \tabularnewline
2 & 0.101034 & 1.0975 & 0.137326 \tabularnewline
3 & 0.088665 & 0.9631 & 0.168722 \tabularnewline
4 & 0.103855 & 1.1281 & 0.130773 \tabularnewline
5 & 0.111328 & 1.2093 & 0.114476 \tabularnewline
6 & 0.069144 & 0.7511 & 0.227044 \tabularnewline
7 & -0.011802 & -0.1282 & 0.449104 \tabularnewline
8 & 0.053747 & 0.5838 & 0.280222 \tabularnewline
9 & 0.08156 & 0.886 & 0.188719 \tabularnewline
10 & -0.149247 & -1.6212 & 0.053818 \tabularnewline
11 & -0.056902 & -0.6181 & 0.268846 \tabularnewline
12 & -0.259991 & -2.8242 & 0.002783 \tabularnewline
13 & 0.001204 & 0.0131 & 0.494796 \tabularnewline
14 & 0.213566 & 2.3199 & 0.011032 \tabularnewline
15 & -0.016482 & -0.179 & 0.429105 \tabularnewline
16 & -0.005462 & -0.0593 & 0.476393 \tabularnewline
17 & -0.070838 & -0.7695 & 0.221568 \tabularnewline
18 & 0.003634 & 0.0395 & 0.484288 \tabularnewline
19 & 0.047849 & 0.5198 & 0.302096 \tabularnewline
20 & -0.050633 & -0.55 & 0.291675 \tabularnewline
21 & -0.028471 & -0.3093 & 0.378828 \tabularnewline
22 & -0.091181 & -0.9905 & 0.161983 \tabularnewline
23 & 0.010103 & 0.1097 & 0.4564 \tabularnewline
24 & -0.204193 & -2.2181 & 0.014231 \tabularnewline
25 & -0.103545 & -1.1248 & 0.131481 \tabularnewline
26 & -0.081605 & -0.8865 & 0.188588 \tabularnewline
27 & -0.009936 & -0.1079 & 0.457116 \tabularnewline
28 & -0.072565 & -0.7883 & 0.216062 \tabularnewline
29 & 0.104866 & 1.1391 & 0.128476 \tabularnewline
30 & -0.007984 & -0.0867 & 0.465516 \tabularnewline
31 & 0.066563 & 0.7231 & 0.235536 \tabularnewline
32 & 0.056339 & 0.612 & 0.270859 \tabularnewline
33 & 0.02472 & 0.2685 & 0.39438 \tabularnewline
34 & -0.017239 & -0.1873 & 0.425889 \tabularnewline
35 & 0.077377 & 0.8405 & 0.201155 \tabularnewline
36 & -0.066326 & -0.7205 & 0.236325 \tabularnewline
37 & -0.031878 & -0.3463 & 0.364872 \tabularnewline
38 & 0.011009 & 0.1196 & 0.452505 \tabularnewline
39 & -0.116451 & -1.265 & 0.104184 \tabularnewline
40 & -0.082687 & -0.8982 & 0.185452 \tabularnewline
41 & 0.000127 & 0.0014 & 0.499451 \tabularnewline
42 & 0.005273 & 0.0573 & 0.477209 \tabularnewline
43 & 0.012861 & 0.1397 & 0.444565 \tabularnewline
44 & -0.001845 & -0.02 & 0.492024 \tabularnewline
45 & -0.078021 & -0.8475 & 0.199211 \tabularnewline
46 & -0.058417 & -0.6346 & 0.263468 \tabularnewline
47 & -0.067869 & -0.7372 & 0.231219 \tabularnewline
48 & -0.008075 & -0.0877 & 0.465127 \tabularnewline
49 & -0.056584 & -0.6147 & 0.269981 \tabularnewline
50 & 0.021315 & 0.2315 & 0.408648 \tabularnewline
51 & -0.071867 & -0.7807 & 0.218277 \tabularnewline
52 & -0.061239 & -0.6652 & 0.253602 \tabularnewline
53 & 0.02325 & 0.2526 & 0.400522 \tabularnewline
54 & 0.090606 & 0.9842 & 0.163506 \tabularnewline
55 & -0.041923 & -0.4554 & 0.324828 \tabularnewline
56 & -0.021351 & -0.2319 & 0.408497 \tabularnewline
57 & -0.010077 & -0.1095 & 0.456509 \tabularnewline
58 & -0.06994 & -0.7597 & 0.224462 \tabularnewline
59 & -0.024524 & -0.2664 & 0.395198 \tabularnewline
60 & 0.025557 & 0.2776 & 0.390894 \tabularnewline
\hline
\end{tabular}
%Source: https://freestatistics.org/blog/index.php?pk=112862&T=2

[TABLE]
[ROW][C]Partial Autocorrelation Function[/C][/ROW]
[ROW][C]Time lag k[/C][C]PACF(k)[/C][C]T-STAT[/C][C]P-value[/C][/ROW]
[ROW][C]1[/C][C]0.149471[/C][C]1.6237[/C][C]0.053557[/C][/ROW]
[ROW][C]2[/C][C]0.101034[/C][C]1.0975[/C][C]0.137326[/C][/ROW]
[ROW][C]3[/C][C]0.088665[/C][C]0.9631[/C][C]0.168722[/C][/ROW]
[ROW][C]4[/C][C]0.103855[/C][C]1.1281[/C][C]0.130773[/C][/ROW]
[ROW][C]5[/C][C]0.111328[/C][C]1.2093[/C][C]0.114476[/C][/ROW]
[ROW][C]6[/C][C]0.069144[/C][C]0.7511[/C][C]0.227044[/C][/ROW]
[ROW][C]7[/C][C]-0.011802[/C][C]-0.1282[/C][C]0.449104[/C][/ROW]
[ROW][C]8[/C][C]0.053747[/C][C]0.5838[/C][C]0.280222[/C][/ROW]
[ROW][C]9[/C][C]0.08156[/C][C]0.886[/C][C]0.188719[/C][/ROW]
[ROW][C]10[/C][C]-0.149247[/C][C]-1.6212[/C][C]0.053818[/C][/ROW]
[ROW][C]11[/C][C]-0.056902[/C][C]-0.6181[/C][C]0.268846[/C][/ROW]
[ROW][C]12[/C][C]-0.259991[/C][C]-2.8242[/C][C]0.002783[/C][/ROW]
[ROW][C]13[/C][C]0.001204[/C][C]0.0131[/C][C]0.494796[/C][/ROW]
[ROW][C]14[/C][C]0.213566[/C][C]2.3199[/C][C]0.011032[/C][/ROW]
[ROW][C]15[/C][C]-0.016482[/C][C]-0.179[/C][C]0.429105[/C][/ROW]
[ROW][C]16[/C][C]-0.005462[/C][C]-0.0593[/C][C]0.476393[/C][/ROW]
[ROW][C]17[/C][C]-0.070838[/C][C]-0.7695[/C][C]0.221568[/C][/ROW]
[ROW][C]18[/C][C]0.003634[/C][C]0.0395[/C][C]0.484288[/C][/ROW]
[ROW][C]19[/C][C]0.047849[/C][C]0.5198[/C][C]0.302096[/C][/ROW]
[ROW][C]20[/C][C]-0.050633[/C][C]-0.55[/C][C]0.291675[/C][/ROW]
[ROW][C]21[/C][C]-0.028471[/C][C]-0.3093[/C][C]0.378828[/C][/ROW]
[ROW][C]22[/C][C]-0.091181[/C][C]-0.9905[/C][C]0.161983[/C][/ROW]
[ROW][C]23[/C][C]0.010103[/C][C]0.1097[/C][C]0.4564[/C][/ROW]
[ROW][C]24[/C][C]-0.204193[/C][C]-2.2181[/C][C]0.014231[/C][/ROW]
[ROW][C]25[/C][C]-0.103545[/C][C]-1.1248[/C][C]0.131481[/C][/ROW]
[ROW][C]26[/C][C]-0.081605[/C][C]-0.8865[/C][C]0.188588[/C][/ROW]
[ROW][C]27[/C][C]-0.009936[/C][C]-0.1079[/C][C]0.457116[/C][/ROW]
[ROW][C]28[/C][C]-0.072565[/C][C]-0.7883[/C][C]0.216062[/C][/ROW]
[ROW][C]29[/C][C]0.104866[/C][C]1.1391[/C][C]0.128476[/C][/ROW]
[ROW][C]30[/C][C]-0.007984[/C][C]-0.0867[/C][C]0.465516[/C][/ROW]
[ROW][C]31[/C][C]0.066563[/C][C]0.7231[/C][C]0.235536[/C][/ROW]
[ROW][C]32[/C][C]0.056339[/C][C]0.612[/C][C]0.270859[/C][/ROW]
[ROW][C]33[/C][C]0.02472[/C][C]0.2685[/C][C]0.39438[/C][/ROW]
[ROW][C]34[/C][C]-0.017239[/C][C]-0.1873[/C][C]0.425889[/C][/ROW]
[ROW][C]35[/C][C]0.077377[/C][C]0.8405[/C][C]0.201155[/C][/ROW]
[ROW][C]36[/C][C]-0.066326[/C][C]-0.7205[/C][C]0.236325[/C][/ROW]
[ROW][C]37[/C][C]-0.031878[/C][C]-0.3463[/C][C]0.364872[/C][/ROW]
[ROW][C]38[/C][C]0.011009[/C][C]0.1196[/C][C]0.452505[/C][/ROW]
[ROW][C]39[/C][C]-0.116451[/C][C]-1.265[/C][C]0.104184[/C][/ROW]
[ROW][C]40[/C][C]-0.082687[/C][C]-0.8982[/C][C]0.185452[/C][/ROW]
[ROW][C]41[/C][C]0.000127[/C][C]0.0014[/C][C]0.499451[/C][/ROW]
[ROW][C]42[/C][C]0.005273[/C][C]0.0573[/C][C]0.477209[/C][/ROW]
[ROW][C]43[/C][C]0.012861[/C][C]0.1397[/C][C]0.444565[/C][/ROW]
[ROW][C]44[/C][C]-0.001845[/C][C]-0.02[/C][C]0.492024[/C][/ROW]
[ROW][C]45[/C][C]-0.078021[/C][C]-0.8475[/C][C]0.199211[/C][/ROW]
[ROW][C]46[/C][C]-0.058417[/C][C]-0.6346[/C][C]0.263468[/C][/ROW]
[ROW][C]47[/C][C]-0.067869[/C][C]-0.7372[/C][C]0.231219[/C][/ROW]
[ROW][C]48[/C][C]-0.008075[/C][C]-0.0877[/C][C]0.465127[/C][/ROW]
[ROW][C]49[/C][C]-0.056584[/C][C]-0.6147[/C][C]0.269981[/C][/ROW]
[ROW][C]50[/C][C]0.021315[/C][C]0.2315[/C][C]0.408648[/C][/ROW]
[ROW][C]51[/C][C]-0.071867[/C][C]-0.7807[/C][C]0.218277[/C][/ROW]
[ROW][C]52[/C][C]-0.061239[/C][C]-0.6652[/C][C]0.253602[/C][/ROW]
[ROW][C]53[/C][C]0.02325[/C][C]0.2526[/C][C]0.400522[/C][/ROW]
[ROW][C]54[/C][C]0.090606[/C][C]0.9842[/C][C]0.163506[/C][/ROW]
[ROW][C]55[/C][C]-0.041923[/C][C]-0.4554[/C][C]0.324828[/C][/ROW]
[ROW][C]56[/C][C]-0.021351[/C][C]-0.2319[/C][C]0.408497[/C][/ROW]
[ROW][C]57[/C][C]-0.010077[/C][C]-0.1095[/C][C]0.456509[/C][/ROW]
[ROW][C]58[/C][C]-0.06994[/C][C]-0.7597[/C][C]0.224462[/C][/ROW]
[ROW][C]59[/C][C]-0.024524[/C][C]-0.2664[/C][C]0.395198[/C][/ROW]
[ROW][C]60[/C][C]0.025557[/C][C]0.2776[/C][C]0.390894[/C][/ROW]
[/TABLE]
Source: https://freestatistics.org/blog/index.php?pk=112862&T=2

Globally Unique Identifier (entire table): ba.freestatistics.org/blog/index.php?pk=112862&T=2

As an alternative you can also use a QR Code:  

The GUIDs for individual cells are displayed in the table below:

Partial Autocorrelation Function
Time lag kPACF(k)T-STATP-value
10.1494711.62370.053557
20.1010341.09750.137326
30.0886650.96310.168722
40.1038551.12810.130773
50.1113281.20930.114476
60.0691440.75110.227044
7-0.011802-0.12820.449104
80.0537470.58380.280222
90.081560.8860.188719
10-0.149247-1.62120.053818
11-0.056902-0.61810.268846
12-0.259991-2.82420.002783
130.0012040.01310.494796
140.2135662.31990.011032
15-0.016482-0.1790.429105
16-0.005462-0.05930.476393
17-0.070838-0.76950.221568
180.0036340.03950.484288
190.0478490.51980.302096
20-0.050633-0.550.291675
21-0.028471-0.30930.378828
22-0.091181-0.99050.161983
230.0101030.10970.4564
24-0.204193-2.21810.014231
25-0.103545-1.12480.131481
26-0.081605-0.88650.188588
27-0.009936-0.10790.457116
28-0.072565-0.78830.216062
290.1048661.13910.128476
30-0.007984-0.08670.465516
310.0665630.72310.235536
320.0563390.6120.270859
330.024720.26850.39438
34-0.017239-0.18730.425889
350.0773770.84050.201155
36-0.066326-0.72050.236325
37-0.031878-0.34630.364872
380.0110090.11960.452505
39-0.116451-1.2650.104184
40-0.082687-0.89820.185452
410.0001270.00140.499451
420.0052730.05730.477209
430.0128610.13970.444565
44-0.001845-0.020.492024
45-0.078021-0.84750.199211
46-0.058417-0.63460.263468
47-0.067869-0.73720.231219
48-0.008075-0.08770.465127
49-0.056584-0.61470.269981
500.0213150.23150.408648
51-0.071867-0.78070.218277
52-0.061239-0.66520.253602
530.023250.25260.400522
540.0906060.98420.163506
55-0.041923-0.45540.324828
56-0.021351-0.23190.408497
57-0.010077-0.10950.456509
58-0.06994-0.75970.224462
59-0.024524-0.26640.395198
600.0255570.27760.390894


Parameters (Session):
par1 = 60 ; par2 = 1 ; par3 = 1 ; par4 = 1 ; par5 = 12 ; par6 = White Noise ; par7 = 0.95 ;
Parameters (R input):
par1 = 60 ; par2 = 1 ; par3 = 1 ; par4 = 1 ; par5 = 12 ; par6 = White Noise ; par7 = 0.95 ; par8 = ;
R code (references can be found in the software module):
if (par1 == 'Default') {
par1 = 10*log10(length(x))
} else {
par1 <- as.numeric(par1)
}
par2 <- as.numeric(par2)
par3 <- as.numeric(par3)
par4 <- as.numeric(par4)
par5 <- as.numeric(par5)
if (par6 == 'White Noise') par6 <- 'white' else par6 <- 'ma'
par7 <- as.numeric(par7)
if (par8 != '') par8 <- as.numeric(par8)
ox <- x
if (par8 == '') {
if (par2 == 0) {
x <- log(x)
} else {
x <- (x ^ par2 - 1) / par2
}
} else {
x <- log(x,base=par8)
}
if (par3 > 0) x <- diff(x,lag=1,difference=par3)
if (par4 > 0) x <- diff(x,lag=par5,difference=par4)
bitmap(file='picts.png')
op <- par(mfrow=c(2,1))
plot(ox,type='l',main='Original Time Series',xlab='time',ylab='value')
if (par8=='') {
mytitle <- paste('Working Time Series (lambda=',par2,', d=',par3,', D=',par4,')',sep='')
mysub <- paste('(lambda=',par2,', d=',par3,', D=',par4,', CI=', par7, ', CI type=',par6,')',sep='')
} else {
mytitle <- paste('Working Time Series (base=',par8,', d=',par3,', D=',par4,')',sep='')
mysub <- paste('(base=',par8,', d=',par3,', D=',par4,', CI=', par7, ', CI type=',par6,')',sep='')
}
plot(x,type='l', main=mytitle,xlab='time',ylab='value')
par(op)
dev.off()
bitmap(file='pic1.png')
racf <- acf(x, par1, main='Autocorrelation', xlab='time lag', ylab='ACF', ci.type=par6, ci=par7, sub=mysub)
dev.off()
bitmap(file='pic2.png')
rpacf <- pacf(x,par1,main='Partial Autocorrelation',xlab='lags',ylab='PACF',sub=mysub)
dev.off()
(myacf <- c(racf$acf))
(mypacf <- c(rpacf$acf))
lengthx <- length(x)
sqrtn <- sqrt(lengthx)
load(file='createtable')
a<-table.start()
a<-table.row.start(a)
a<-table.element(a,'Autocorrelation Function',4,TRUE)
a<-table.row.end(a)
a<-table.row.start(a)
a<-table.element(a,'Time lag k',header=TRUE)
a<-table.element(a,hyperlink('basics.htm','ACF(k)','click here for more information about the Autocorrelation Function'),header=TRUE)
a<-table.element(a,'T-STAT',header=TRUE)
a<-table.element(a,'P-value',header=TRUE)
a<-table.row.end(a)
for (i in 2:(par1+1)) {
a<-table.row.start(a)
a<-table.element(a,i-1,header=TRUE)
a<-table.element(a,round(myacf[i],6))
mytstat <- myacf[i]*sqrtn
a<-table.element(a,round(mytstat,4))
a<-table.element(a,round(1-pt(abs(mytstat),lengthx),6))
a<-table.row.end(a)
}
a<-table.end(a)
table.save(a,file='mytable.tab')
a<-table.start()
a<-table.row.start(a)
a<-table.element(a,'Partial Autocorrelation Function',4,TRUE)
a<-table.row.end(a)
a<-table.row.start(a)
a<-table.element(a,'Time lag k',header=TRUE)
a<-table.element(a,hyperlink('basics.htm','PACF(k)','click here for more information about the Partial Autocorrelation Function'),header=TRUE)
a<-table.element(a,'T-STAT',header=TRUE)
a<-table.element(a,'P-value',header=TRUE)
a<-table.row.end(a)
for (i in 1:par1) {
a<-table.row.start(a)
a<-table.element(a,i,header=TRUE)
a<-table.element(a,round(mypacf[i],6))
mytstat <- mypacf[i]*sqrtn
a<-table.element(a,round(mytstat,4))
a<-table.element(a,round(1-pt(abs(mytstat),lengthx),6))
a<-table.row.end(a)
}
a<-table.end(a)
table.save(a,file='mytable1.tab')