Free Statistics

of Irreproducible Research!

Author's title

Author*The author of this computation has been verified*
R Software Modulerwasp_autocorrelation.wasp
Title produced by software(Partial) Autocorrelation Function
Date of computationMon, 20 Dec 2010 11:53:46 +0000
Cite this page as followsStatistical Computations at FreeStatistics.org, Office for Research Development and Education, URL https://freestatistics.org/blog/index.php?v=date/2010/Dec/20/t1292845912rn8sfp9qsb1c3i8.htm/, Retrieved Sat, 04 May 2024 00:46:29 +0000
Statistical Computations at FreeStatistics.org, Office for Research Development and Education, URL https://freestatistics.org/blog/index.php?pk=112856, Retrieved Sat, 04 May 2024 00:46:29 +0000
QR Codes:

Original text written by user:
IsPrivate?No (this computation is public)
User-defined keywords
Estimated Impact200
Family? (F = Feedback message, R = changed R code, M = changed R Module, P = changed Parameters, D = changed Data)
-     [Univariate Data Series] [data set] [2008-12-01 19:54:57] [b98453cac15ba1066b407e146608df68]
- RMP   [Exponential Smoothing] [Unemployment] [2010-11-30 13:37:23] [b98453cac15ba1066b407e146608df68]
- RMPD      [(Partial) Autocorrelation Function] [BEL20-ACF] [2010-12-20 11:53:46] [4c7d8c32b2e34fcaa7f14928b91d45ae] [Current]
Feedback Forum

Post a new message
Dataseries X:
3030
2803
2768
2883
2863
2897
3013
3143
3033
3046
3111
3013
2987
2996
2833
2849
2795
2845
2915
2893
2604
2642
2660
2639
2720
2746
2736
2812
2799
2555
2305
2215
2066
1940
2042
1995
1947
1766
1635
1833
1910
1960
1970
2061
2093
2121
2175
2197
2350
2440
2409
2473
2408
2455
2448
2498
2646
2757
2849
2921
2982
3081
3106
3119
3061
3097
3162
3257
3277
3295
3364
3494
3667
3813
3918
3896
3801
3570
3702
3862
3970
4139
4200
4291
4444
4503
4357
4591
4697
4621
4563
4203
4296
4435
4105
4117
3844
3721
3674
3858
3801
3504
3033
3047
2962
2198
2014
1863
1905
1811
1670
1864
2052
2030
2071
2293
2443
2513
2467
2503
2540
2483
2626
2656
2447
2467
2462
2505
2579
2649
2637


Summary of computational transaction
Raw Inputview raw input (R code)
Raw Outputview raw output of R engine
Computing time2 seconds
R Server'Gwilym Jenkins' @ 72.249.127.135

\begin{tabular}{lllllllll}
\hline
Summary of computational transaction \tabularnewline
Raw Input & view raw input (R code)  \tabularnewline
Raw Output & view raw output of R engine  \tabularnewline
Computing time & 2 seconds \tabularnewline
R Server & 'Gwilym Jenkins' @ 72.249.127.135 \tabularnewline
\hline
\end{tabular}
%Source: https://freestatistics.org/blog/index.php?pk=112856&T=0

[TABLE]
[ROW][C]Summary of computational transaction[/C][/ROW]
[ROW][C]Raw Input[/C][C]view raw input (R code) [/C][/ROW]
[ROW][C]Raw Output[/C][C]view raw output of R engine [/C][/ROW]
[ROW][C]Computing time[/C][C]2 seconds[/C][/ROW]
[ROW][C]R Server[/C][C]'Gwilym Jenkins' @ 72.249.127.135[/C][/ROW]
[/TABLE]
Source: https://freestatistics.org/blog/index.php?pk=112856&T=0

Globally Unique Identifier (entire table): ba.freestatistics.org/blog/index.php?pk=112856&T=0

As an alternative you can also use a QR Code:  

The GUIDs for individual cells are displayed in the table below:

Summary of computational transaction
Raw Inputview raw input (R code)
Raw Outputview raw output of R engine
Computing time2 seconds
R Server'Gwilym Jenkins' @ 72.249.127.135


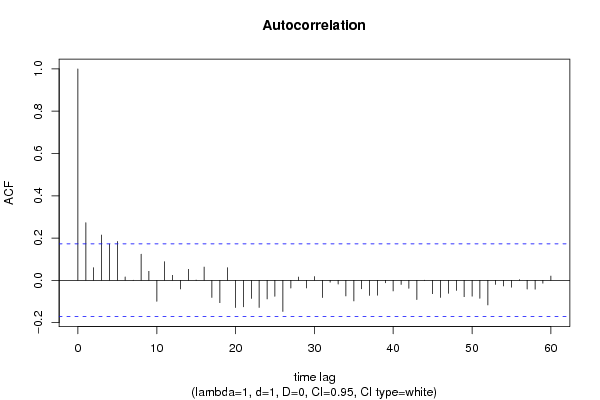
Autocorrelation Function
Time lag kACF(k)T-STATP-value
10.2727013.10930.001152
20.0595570.6790.249157
30.2140892.4410.007997
40.171841.95930.02611
50.184022.09820.018914
60.0161990.18470.426878
70.0003890.00440.498234
80.1238231.41180.080199
90.0423480.48280.315011
10-0.099417-1.13350.129539
110.0881151.00470.158462
120.0237950.27130.393294
13-0.040977-0.46720.320566
140.0521430.59450.276599
150.001420.01620.493552
160.062450.7120.238859
17-0.080824-0.92150.17924
18-0.105552-1.20350.115489
190.0599630.68370.247696
20-0.128769-1.46820.072234
21-0.12514-1.42680.078015
22-0.08598-0.98030.164373
23-0.128159-1.46120.073181
24-0.088012-1.00350.158745
25-0.075433-0.86010.195667
26-0.147382-1.68040.04764
27-0.036825-0.41990.337636
280.015170.1730.431476
29-0.036253-0.41330.340018
300.0176520.20130.420403
31-0.081718-0.93170.176602
32-0.008937-0.10190.459496
33-0.017948-0.20460.419089
34-0.073673-0.840.201226
35-0.097476-1.11140.134224
36-0.040263-0.45910.323475
37-0.071726-0.81780.207484
38-0.070243-0.80090.212328
39-0.011711-0.13350.446992
40-0.050074-0.57090.284515
41-0.01935-0.22060.412865
42-0.037649-0.42930.334219
43-0.091065-1.03830.15053
440.0004020.00460.498176
45-0.063197-0.72060.236238
46-0.08089-0.92230.179044
47-0.061343-0.69940.242772
48-0.048087-0.54830.292219
49-0.077377-0.88220.18964
50-0.074867-0.85360.197445
51-0.08489-0.96790.167446
52-0.116289-1.32590.093598
53-0.019449-0.22180.412426
54-0.026513-0.30230.381456
55-0.03242-0.36960.356126
560.0030920.03530.485966
57-0.04126-0.47040.319414
58-0.041828-0.47690.317112
59-0.013552-0.15450.43872
600.0199190.22710.410346

\begin{tabular}{lllllllll}
\hline
Autocorrelation Function \tabularnewline
Time lag k & ACF(k) & T-STAT & P-value \tabularnewline
1 & 0.272701 & 3.1093 & 0.001152 \tabularnewline
2 & 0.059557 & 0.679 & 0.249157 \tabularnewline
3 & 0.214089 & 2.441 & 0.007997 \tabularnewline
4 & 0.17184 & 1.9593 & 0.02611 \tabularnewline
5 & 0.18402 & 2.0982 & 0.018914 \tabularnewline
6 & 0.016199 & 0.1847 & 0.426878 \tabularnewline
7 & 0.000389 & 0.0044 & 0.498234 \tabularnewline
8 & 0.123823 & 1.4118 & 0.080199 \tabularnewline
9 & 0.042348 & 0.4828 & 0.315011 \tabularnewline
10 & -0.099417 & -1.1335 & 0.129539 \tabularnewline
11 & 0.088115 & 1.0047 & 0.158462 \tabularnewline
12 & 0.023795 & 0.2713 & 0.393294 \tabularnewline
13 & -0.040977 & -0.4672 & 0.320566 \tabularnewline
14 & 0.052143 & 0.5945 & 0.276599 \tabularnewline
15 & 0.00142 & 0.0162 & 0.493552 \tabularnewline
16 & 0.06245 & 0.712 & 0.238859 \tabularnewline
17 & -0.080824 & -0.9215 & 0.17924 \tabularnewline
18 & -0.105552 & -1.2035 & 0.115489 \tabularnewline
19 & 0.059963 & 0.6837 & 0.247696 \tabularnewline
20 & -0.128769 & -1.4682 & 0.072234 \tabularnewline
21 & -0.12514 & -1.4268 & 0.078015 \tabularnewline
22 & -0.08598 & -0.9803 & 0.164373 \tabularnewline
23 & -0.128159 & -1.4612 & 0.073181 \tabularnewline
24 & -0.088012 & -1.0035 & 0.158745 \tabularnewline
25 & -0.075433 & -0.8601 & 0.195667 \tabularnewline
26 & -0.147382 & -1.6804 & 0.04764 \tabularnewline
27 & -0.036825 & -0.4199 & 0.337636 \tabularnewline
28 & 0.01517 & 0.173 & 0.431476 \tabularnewline
29 & -0.036253 & -0.4133 & 0.340018 \tabularnewline
30 & 0.017652 & 0.2013 & 0.420403 \tabularnewline
31 & -0.081718 & -0.9317 & 0.176602 \tabularnewline
32 & -0.008937 & -0.1019 & 0.459496 \tabularnewline
33 & -0.017948 & -0.2046 & 0.419089 \tabularnewline
34 & -0.073673 & -0.84 & 0.201226 \tabularnewline
35 & -0.097476 & -1.1114 & 0.134224 \tabularnewline
36 & -0.040263 & -0.4591 & 0.323475 \tabularnewline
37 & -0.071726 & -0.8178 & 0.207484 \tabularnewline
38 & -0.070243 & -0.8009 & 0.212328 \tabularnewline
39 & -0.011711 & -0.1335 & 0.446992 \tabularnewline
40 & -0.050074 & -0.5709 & 0.284515 \tabularnewline
41 & -0.01935 & -0.2206 & 0.412865 \tabularnewline
42 & -0.037649 & -0.4293 & 0.334219 \tabularnewline
43 & -0.091065 & -1.0383 & 0.15053 \tabularnewline
44 & 0.000402 & 0.0046 & 0.498176 \tabularnewline
45 & -0.063197 & -0.7206 & 0.236238 \tabularnewline
46 & -0.08089 & -0.9223 & 0.179044 \tabularnewline
47 & -0.061343 & -0.6994 & 0.242772 \tabularnewline
48 & -0.048087 & -0.5483 & 0.292219 \tabularnewline
49 & -0.077377 & -0.8822 & 0.18964 \tabularnewline
50 & -0.074867 & -0.8536 & 0.197445 \tabularnewline
51 & -0.08489 & -0.9679 & 0.167446 \tabularnewline
52 & -0.116289 & -1.3259 & 0.093598 \tabularnewline
53 & -0.019449 & -0.2218 & 0.412426 \tabularnewline
54 & -0.026513 & -0.3023 & 0.381456 \tabularnewline
55 & -0.03242 & -0.3696 & 0.356126 \tabularnewline
56 & 0.003092 & 0.0353 & 0.485966 \tabularnewline
57 & -0.04126 & -0.4704 & 0.319414 \tabularnewline
58 & -0.041828 & -0.4769 & 0.317112 \tabularnewline
59 & -0.013552 & -0.1545 & 0.43872 \tabularnewline
60 & 0.019919 & 0.2271 & 0.410346 \tabularnewline
\hline
\end{tabular}
%Source: https://freestatistics.org/blog/index.php?pk=112856&T=1

[TABLE]
[ROW][C]Autocorrelation Function[/C][/ROW]
[ROW][C]Time lag k[/C][C]ACF(k)[/C][C]T-STAT[/C][C]P-value[/C][/ROW]
[ROW][C]1[/C][C]0.272701[/C][C]3.1093[/C][C]0.001152[/C][/ROW]
[ROW][C]2[/C][C]0.059557[/C][C]0.679[/C][C]0.249157[/C][/ROW]
[ROW][C]3[/C][C]0.214089[/C][C]2.441[/C][C]0.007997[/C][/ROW]
[ROW][C]4[/C][C]0.17184[/C][C]1.9593[/C][C]0.02611[/C][/ROW]
[ROW][C]5[/C][C]0.18402[/C][C]2.0982[/C][C]0.018914[/C][/ROW]
[ROW][C]6[/C][C]0.016199[/C][C]0.1847[/C][C]0.426878[/C][/ROW]
[ROW][C]7[/C][C]0.000389[/C][C]0.0044[/C][C]0.498234[/C][/ROW]
[ROW][C]8[/C][C]0.123823[/C][C]1.4118[/C][C]0.080199[/C][/ROW]
[ROW][C]9[/C][C]0.042348[/C][C]0.4828[/C][C]0.315011[/C][/ROW]
[ROW][C]10[/C][C]-0.099417[/C][C]-1.1335[/C][C]0.129539[/C][/ROW]
[ROW][C]11[/C][C]0.088115[/C][C]1.0047[/C][C]0.158462[/C][/ROW]
[ROW][C]12[/C][C]0.023795[/C][C]0.2713[/C][C]0.393294[/C][/ROW]
[ROW][C]13[/C][C]-0.040977[/C][C]-0.4672[/C][C]0.320566[/C][/ROW]
[ROW][C]14[/C][C]0.052143[/C][C]0.5945[/C][C]0.276599[/C][/ROW]
[ROW][C]15[/C][C]0.00142[/C][C]0.0162[/C][C]0.493552[/C][/ROW]
[ROW][C]16[/C][C]0.06245[/C][C]0.712[/C][C]0.238859[/C][/ROW]
[ROW][C]17[/C][C]-0.080824[/C][C]-0.9215[/C][C]0.17924[/C][/ROW]
[ROW][C]18[/C][C]-0.105552[/C][C]-1.2035[/C][C]0.115489[/C][/ROW]
[ROW][C]19[/C][C]0.059963[/C][C]0.6837[/C][C]0.247696[/C][/ROW]
[ROW][C]20[/C][C]-0.128769[/C][C]-1.4682[/C][C]0.072234[/C][/ROW]
[ROW][C]21[/C][C]-0.12514[/C][C]-1.4268[/C][C]0.078015[/C][/ROW]
[ROW][C]22[/C][C]-0.08598[/C][C]-0.9803[/C][C]0.164373[/C][/ROW]
[ROW][C]23[/C][C]-0.128159[/C][C]-1.4612[/C][C]0.073181[/C][/ROW]
[ROW][C]24[/C][C]-0.088012[/C][C]-1.0035[/C][C]0.158745[/C][/ROW]
[ROW][C]25[/C][C]-0.075433[/C][C]-0.8601[/C][C]0.195667[/C][/ROW]
[ROW][C]26[/C][C]-0.147382[/C][C]-1.6804[/C][C]0.04764[/C][/ROW]
[ROW][C]27[/C][C]-0.036825[/C][C]-0.4199[/C][C]0.337636[/C][/ROW]
[ROW][C]28[/C][C]0.01517[/C][C]0.173[/C][C]0.431476[/C][/ROW]
[ROW][C]29[/C][C]-0.036253[/C][C]-0.4133[/C][C]0.340018[/C][/ROW]
[ROW][C]30[/C][C]0.017652[/C][C]0.2013[/C][C]0.420403[/C][/ROW]
[ROW][C]31[/C][C]-0.081718[/C][C]-0.9317[/C][C]0.176602[/C][/ROW]
[ROW][C]32[/C][C]-0.008937[/C][C]-0.1019[/C][C]0.459496[/C][/ROW]
[ROW][C]33[/C][C]-0.017948[/C][C]-0.2046[/C][C]0.419089[/C][/ROW]
[ROW][C]34[/C][C]-0.073673[/C][C]-0.84[/C][C]0.201226[/C][/ROW]
[ROW][C]35[/C][C]-0.097476[/C][C]-1.1114[/C][C]0.134224[/C][/ROW]
[ROW][C]36[/C][C]-0.040263[/C][C]-0.4591[/C][C]0.323475[/C][/ROW]
[ROW][C]37[/C][C]-0.071726[/C][C]-0.8178[/C][C]0.207484[/C][/ROW]
[ROW][C]38[/C][C]-0.070243[/C][C]-0.8009[/C][C]0.212328[/C][/ROW]
[ROW][C]39[/C][C]-0.011711[/C][C]-0.1335[/C][C]0.446992[/C][/ROW]
[ROW][C]40[/C][C]-0.050074[/C][C]-0.5709[/C][C]0.284515[/C][/ROW]
[ROW][C]41[/C][C]-0.01935[/C][C]-0.2206[/C][C]0.412865[/C][/ROW]
[ROW][C]42[/C][C]-0.037649[/C][C]-0.4293[/C][C]0.334219[/C][/ROW]
[ROW][C]43[/C][C]-0.091065[/C][C]-1.0383[/C][C]0.15053[/C][/ROW]
[ROW][C]44[/C][C]0.000402[/C][C]0.0046[/C][C]0.498176[/C][/ROW]
[ROW][C]45[/C][C]-0.063197[/C][C]-0.7206[/C][C]0.236238[/C][/ROW]
[ROW][C]46[/C][C]-0.08089[/C][C]-0.9223[/C][C]0.179044[/C][/ROW]
[ROW][C]47[/C][C]-0.061343[/C][C]-0.6994[/C][C]0.242772[/C][/ROW]
[ROW][C]48[/C][C]-0.048087[/C][C]-0.5483[/C][C]0.292219[/C][/ROW]
[ROW][C]49[/C][C]-0.077377[/C][C]-0.8822[/C][C]0.18964[/C][/ROW]
[ROW][C]50[/C][C]-0.074867[/C][C]-0.8536[/C][C]0.197445[/C][/ROW]
[ROW][C]51[/C][C]-0.08489[/C][C]-0.9679[/C][C]0.167446[/C][/ROW]
[ROW][C]52[/C][C]-0.116289[/C][C]-1.3259[/C][C]0.093598[/C][/ROW]
[ROW][C]53[/C][C]-0.019449[/C][C]-0.2218[/C][C]0.412426[/C][/ROW]
[ROW][C]54[/C][C]-0.026513[/C][C]-0.3023[/C][C]0.381456[/C][/ROW]
[ROW][C]55[/C][C]-0.03242[/C][C]-0.3696[/C][C]0.356126[/C][/ROW]
[ROW][C]56[/C][C]0.003092[/C][C]0.0353[/C][C]0.485966[/C][/ROW]
[ROW][C]57[/C][C]-0.04126[/C][C]-0.4704[/C][C]0.319414[/C][/ROW]
[ROW][C]58[/C][C]-0.041828[/C][C]-0.4769[/C][C]0.317112[/C][/ROW]
[ROW][C]59[/C][C]-0.013552[/C][C]-0.1545[/C][C]0.43872[/C][/ROW]
[ROW][C]60[/C][C]0.019919[/C][C]0.2271[/C][C]0.410346[/C][/ROW]
[/TABLE]
Source: https://freestatistics.org/blog/index.php?pk=112856&T=1

Globally Unique Identifier (entire table): ba.freestatistics.org/blog/index.php?pk=112856&T=1

As an alternative you can also use a QR Code:  

The GUIDs for individual cells are displayed in the table below:

Autocorrelation Function
Time lag kACF(k)T-STATP-value
10.2727013.10930.001152
20.0595570.6790.249157
30.2140892.4410.007997
40.171841.95930.02611
50.184022.09820.018914
60.0161990.18470.426878
70.0003890.00440.498234
80.1238231.41180.080199
90.0423480.48280.315011
10-0.099417-1.13350.129539
110.0881151.00470.158462
120.0237950.27130.393294
13-0.040977-0.46720.320566
140.0521430.59450.276599
150.001420.01620.493552
160.062450.7120.238859
17-0.080824-0.92150.17924
18-0.105552-1.20350.115489
190.0599630.68370.247696
20-0.128769-1.46820.072234
21-0.12514-1.42680.078015
22-0.08598-0.98030.164373
23-0.128159-1.46120.073181
24-0.088012-1.00350.158745
25-0.075433-0.86010.195667
26-0.147382-1.68040.04764
27-0.036825-0.41990.337636
280.015170.1730.431476
29-0.036253-0.41330.340018
300.0176520.20130.420403
31-0.081718-0.93170.176602
32-0.008937-0.10190.459496
33-0.017948-0.20460.419089
34-0.073673-0.840.201226
35-0.097476-1.11140.134224
36-0.040263-0.45910.323475
37-0.071726-0.81780.207484
38-0.070243-0.80090.212328
39-0.011711-0.13350.446992
40-0.050074-0.57090.284515
41-0.01935-0.22060.412865
42-0.037649-0.42930.334219
43-0.091065-1.03830.15053
440.0004020.00460.498176
45-0.063197-0.72060.236238
46-0.08089-0.92230.179044
47-0.061343-0.69940.242772
48-0.048087-0.54830.292219
49-0.077377-0.88220.18964
50-0.074867-0.85360.197445
51-0.08489-0.96790.167446
52-0.116289-1.32590.093598
53-0.019449-0.22180.412426
54-0.026513-0.30230.381456
55-0.03242-0.36960.356126
560.0030920.03530.485966
57-0.04126-0.47040.319414
58-0.041828-0.47690.317112
59-0.013552-0.15450.43872
600.0199190.22710.410346


Partial Autocorrelation Function
Time lag kPACF(k)T-STATP-value
10.2727013.10930.001152
2-0.015999-0.18240.427769
30.2182312.48820.007051
40.0644690.73510.231813
50.1413311.61140.054756
6-0.115286-1.31450.095502
7-0.010086-0.1150.454312
80.0613850.69990.242621
9-0.020302-0.23150.408655
10-0.122997-1.40240.081593
110.1537551.75310.040973
12-0.072489-0.82650.205016
13-0.010171-0.1160.453928
140.0600540.68470.247369
150.0010340.01180.495308
160.0321540.36660.357252
17-0.13957-1.59130.056981
18-0.017439-0.19880.421352
190.0416550.47490.317812
20-0.187261-2.13510.017314
210.0344870.39320.347403
22-0.076345-0.87050.192825
23-0.062405-0.71150.239016
24-0.012256-0.13970.444539
250.0257760.29390.384653
26-0.074516-0.84960.198551
270.0256370.29230.385258
280.0723370.82480.205505
290.0478730.54580.293059
30-0.043846-0.49990.30899
31-0.036762-0.41920.337897
320.040460.46130.32267
33-0.107353-1.2240.11158
340.0126460.14420.442786
35-0.108557-1.23770.109022
360.055870.6370.262617
37-0.091439-1.04260.149543
380.0127830.14570.442173
390.0635430.72450.235031
40-0.058068-0.66210.254547
41-0.014105-0.16080.436244
420.017310.19740.421926
43-0.157479-1.79550.037446
440.0273420.31170.377867
45-0.080503-0.91790.180192
46-0.025626-0.29220.385305
47-0.071115-0.81080.209471
480.0051910.05920.476448
49-0.03754-0.4280.334673
50-0.011021-0.12570.450097
51-0.070211-0.80050.212433
52-0.033891-0.38640.349912
53-0.010794-0.12310.451121
540.0607410.69250.244914
55-0.078834-0.89880.185199
560.070270.80120.212239
57-0.103767-1.18310.119458
58-0.072805-0.83010.204
590.0152390.17380.431164
600.0038350.04370.482597

\begin{tabular}{lllllllll}
\hline
Partial Autocorrelation Function \tabularnewline
Time lag k & PACF(k) & T-STAT & P-value \tabularnewline
1 & 0.272701 & 3.1093 & 0.001152 \tabularnewline
2 & -0.015999 & -0.1824 & 0.427769 \tabularnewline
3 & 0.218231 & 2.4882 & 0.007051 \tabularnewline
4 & 0.064469 & 0.7351 & 0.231813 \tabularnewline
5 & 0.141331 & 1.6114 & 0.054756 \tabularnewline
6 & -0.115286 & -1.3145 & 0.095502 \tabularnewline
7 & -0.010086 & -0.115 & 0.454312 \tabularnewline
8 & 0.061385 & 0.6999 & 0.242621 \tabularnewline
9 & -0.020302 & -0.2315 & 0.408655 \tabularnewline
10 & -0.122997 & -1.4024 & 0.081593 \tabularnewline
11 & 0.153755 & 1.7531 & 0.040973 \tabularnewline
12 & -0.072489 & -0.8265 & 0.205016 \tabularnewline
13 & -0.010171 & -0.116 & 0.453928 \tabularnewline
14 & 0.060054 & 0.6847 & 0.247369 \tabularnewline
15 & 0.001034 & 0.0118 & 0.495308 \tabularnewline
16 & 0.032154 & 0.3666 & 0.357252 \tabularnewline
17 & -0.13957 & -1.5913 & 0.056981 \tabularnewline
18 & -0.017439 & -0.1988 & 0.421352 \tabularnewline
19 & 0.041655 & 0.4749 & 0.317812 \tabularnewline
20 & -0.187261 & -2.1351 & 0.017314 \tabularnewline
21 & 0.034487 & 0.3932 & 0.347403 \tabularnewline
22 & -0.076345 & -0.8705 & 0.192825 \tabularnewline
23 & -0.062405 & -0.7115 & 0.239016 \tabularnewline
24 & -0.012256 & -0.1397 & 0.444539 \tabularnewline
25 & 0.025776 & 0.2939 & 0.384653 \tabularnewline
26 & -0.074516 & -0.8496 & 0.198551 \tabularnewline
27 & 0.025637 & 0.2923 & 0.385258 \tabularnewline
28 & 0.072337 & 0.8248 & 0.205505 \tabularnewline
29 & 0.047873 & 0.5458 & 0.293059 \tabularnewline
30 & -0.043846 & -0.4999 & 0.30899 \tabularnewline
31 & -0.036762 & -0.4192 & 0.337897 \tabularnewline
32 & 0.04046 & 0.4613 & 0.32267 \tabularnewline
33 & -0.107353 & -1.224 & 0.11158 \tabularnewline
34 & 0.012646 & 0.1442 & 0.442786 \tabularnewline
35 & -0.108557 & -1.2377 & 0.109022 \tabularnewline
36 & 0.05587 & 0.637 & 0.262617 \tabularnewline
37 & -0.091439 & -1.0426 & 0.149543 \tabularnewline
38 & 0.012783 & 0.1457 & 0.442173 \tabularnewline
39 & 0.063543 & 0.7245 & 0.235031 \tabularnewline
40 & -0.058068 & -0.6621 & 0.254547 \tabularnewline
41 & -0.014105 & -0.1608 & 0.436244 \tabularnewline
42 & 0.01731 & 0.1974 & 0.421926 \tabularnewline
43 & -0.157479 & -1.7955 & 0.037446 \tabularnewline
44 & 0.027342 & 0.3117 & 0.377867 \tabularnewline
45 & -0.080503 & -0.9179 & 0.180192 \tabularnewline
46 & -0.025626 & -0.2922 & 0.385305 \tabularnewline
47 & -0.071115 & -0.8108 & 0.209471 \tabularnewline
48 & 0.005191 & 0.0592 & 0.476448 \tabularnewline
49 & -0.03754 & -0.428 & 0.334673 \tabularnewline
50 & -0.011021 & -0.1257 & 0.450097 \tabularnewline
51 & -0.070211 & -0.8005 & 0.212433 \tabularnewline
52 & -0.033891 & -0.3864 & 0.349912 \tabularnewline
53 & -0.010794 & -0.1231 & 0.451121 \tabularnewline
54 & 0.060741 & 0.6925 & 0.244914 \tabularnewline
55 & -0.078834 & -0.8988 & 0.185199 \tabularnewline
56 & 0.07027 & 0.8012 & 0.212239 \tabularnewline
57 & -0.103767 & -1.1831 & 0.119458 \tabularnewline
58 & -0.072805 & -0.8301 & 0.204 \tabularnewline
59 & 0.015239 & 0.1738 & 0.431164 \tabularnewline
60 & 0.003835 & 0.0437 & 0.482597 \tabularnewline
\hline
\end{tabular}
%Source: https://freestatistics.org/blog/index.php?pk=112856&T=2

[TABLE]
[ROW][C]Partial Autocorrelation Function[/C][/ROW]
[ROW][C]Time lag k[/C][C]PACF(k)[/C][C]T-STAT[/C][C]P-value[/C][/ROW]
[ROW][C]1[/C][C]0.272701[/C][C]3.1093[/C][C]0.001152[/C][/ROW]
[ROW][C]2[/C][C]-0.015999[/C][C]-0.1824[/C][C]0.427769[/C][/ROW]
[ROW][C]3[/C][C]0.218231[/C][C]2.4882[/C][C]0.007051[/C][/ROW]
[ROW][C]4[/C][C]0.064469[/C][C]0.7351[/C][C]0.231813[/C][/ROW]
[ROW][C]5[/C][C]0.141331[/C][C]1.6114[/C][C]0.054756[/C][/ROW]
[ROW][C]6[/C][C]-0.115286[/C][C]-1.3145[/C][C]0.095502[/C][/ROW]
[ROW][C]7[/C][C]-0.010086[/C][C]-0.115[/C][C]0.454312[/C][/ROW]
[ROW][C]8[/C][C]0.061385[/C][C]0.6999[/C][C]0.242621[/C][/ROW]
[ROW][C]9[/C][C]-0.020302[/C][C]-0.2315[/C][C]0.408655[/C][/ROW]
[ROW][C]10[/C][C]-0.122997[/C][C]-1.4024[/C][C]0.081593[/C][/ROW]
[ROW][C]11[/C][C]0.153755[/C][C]1.7531[/C][C]0.040973[/C][/ROW]
[ROW][C]12[/C][C]-0.072489[/C][C]-0.8265[/C][C]0.205016[/C][/ROW]
[ROW][C]13[/C][C]-0.010171[/C][C]-0.116[/C][C]0.453928[/C][/ROW]
[ROW][C]14[/C][C]0.060054[/C][C]0.6847[/C][C]0.247369[/C][/ROW]
[ROW][C]15[/C][C]0.001034[/C][C]0.0118[/C][C]0.495308[/C][/ROW]
[ROW][C]16[/C][C]0.032154[/C][C]0.3666[/C][C]0.357252[/C][/ROW]
[ROW][C]17[/C][C]-0.13957[/C][C]-1.5913[/C][C]0.056981[/C][/ROW]
[ROW][C]18[/C][C]-0.017439[/C][C]-0.1988[/C][C]0.421352[/C][/ROW]
[ROW][C]19[/C][C]0.041655[/C][C]0.4749[/C][C]0.317812[/C][/ROW]
[ROW][C]20[/C][C]-0.187261[/C][C]-2.1351[/C][C]0.017314[/C][/ROW]
[ROW][C]21[/C][C]0.034487[/C][C]0.3932[/C][C]0.347403[/C][/ROW]
[ROW][C]22[/C][C]-0.076345[/C][C]-0.8705[/C][C]0.192825[/C][/ROW]
[ROW][C]23[/C][C]-0.062405[/C][C]-0.7115[/C][C]0.239016[/C][/ROW]
[ROW][C]24[/C][C]-0.012256[/C][C]-0.1397[/C][C]0.444539[/C][/ROW]
[ROW][C]25[/C][C]0.025776[/C][C]0.2939[/C][C]0.384653[/C][/ROW]
[ROW][C]26[/C][C]-0.074516[/C][C]-0.8496[/C][C]0.198551[/C][/ROW]
[ROW][C]27[/C][C]0.025637[/C][C]0.2923[/C][C]0.385258[/C][/ROW]
[ROW][C]28[/C][C]0.072337[/C][C]0.8248[/C][C]0.205505[/C][/ROW]
[ROW][C]29[/C][C]0.047873[/C][C]0.5458[/C][C]0.293059[/C][/ROW]
[ROW][C]30[/C][C]-0.043846[/C][C]-0.4999[/C][C]0.30899[/C][/ROW]
[ROW][C]31[/C][C]-0.036762[/C][C]-0.4192[/C][C]0.337897[/C][/ROW]
[ROW][C]32[/C][C]0.04046[/C][C]0.4613[/C][C]0.32267[/C][/ROW]
[ROW][C]33[/C][C]-0.107353[/C][C]-1.224[/C][C]0.11158[/C][/ROW]
[ROW][C]34[/C][C]0.012646[/C][C]0.1442[/C][C]0.442786[/C][/ROW]
[ROW][C]35[/C][C]-0.108557[/C][C]-1.2377[/C][C]0.109022[/C][/ROW]
[ROW][C]36[/C][C]0.05587[/C][C]0.637[/C][C]0.262617[/C][/ROW]
[ROW][C]37[/C][C]-0.091439[/C][C]-1.0426[/C][C]0.149543[/C][/ROW]
[ROW][C]38[/C][C]0.012783[/C][C]0.1457[/C][C]0.442173[/C][/ROW]
[ROW][C]39[/C][C]0.063543[/C][C]0.7245[/C][C]0.235031[/C][/ROW]
[ROW][C]40[/C][C]-0.058068[/C][C]-0.6621[/C][C]0.254547[/C][/ROW]
[ROW][C]41[/C][C]-0.014105[/C][C]-0.1608[/C][C]0.436244[/C][/ROW]
[ROW][C]42[/C][C]0.01731[/C][C]0.1974[/C][C]0.421926[/C][/ROW]
[ROW][C]43[/C][C]-0.157479[/C][C]-1.7955[/C][C]0.037446[/C][/ROW]
[ROW][C]44[/C][C]0.027342[/C][C]0.3117[/C][C]0.377867[/C][/ROW]
[ROW][C]45[/C][C]-0.080503[/C][C]-0.9179[/C][C]0.180192[/C][/ROW]
[ROW][C]46[/C][C]-0.025626[/C][C]-0.2922[/C][C]0.385305[/C][/ROW]
[ROW][C]47[/C][C]-0.071115[/C][C]-0.8108[/C][C]0.209471[/C][/ROW]
[ROW][C]48[/C][C]0.005191[/C][C]0.0592[/C][C]0.476448[/C][/ROW]
[ROW][C]49[/C][C]-0.03754[/C][C]-0.428[/C][C]0.334673[/C][/ROW]
[ROW][C]50[/C][C]-0.011021[/C][C]-0.1257[/C][C]0.450097[/C][/ROW]
[ROW][C]51[/C][C]-0.070211[/C][C]-0.8005[/C][C]0.212433[/C][/ROW]
[ROW][C]52[/C][C]-0.033891[/C][C]-0.3864[/C][C]0.349912[/C][/ROW]
[ROW][C]53[/C][C]-0.010794[/C][C]-0.1231[/C][C]0.451121[/C][/ROW]
[ROW][C]54[/C][C]0.060741[/C][C]0.6925[/C][C]0.244914[/C][/ROW]
[ROW][C]55[/C][C]-0.078834[/C][C]-0.8988[/C][C]0.185199[/C][/ROW]
[ROW][C]56[/C][C]0.07027[/C][C]0.8012[/C][C]0.212239[/C][/ROW]
[ROW][C]57[/C][C]-0.103767[/C][C]-1.1831[/C][C]0.119458[/C][/ROW]
[ROW][C]58[/C][C]-0.072805[/C][C]-0.8301[/C][C]0.204[/C][/ROW]
[ROW][C]59[/C][C]0.015239[/C][C]0.1738[/C][C]0.431164[/C][/ROW]
[ROW][C]60[/C][C]0.003835[/C][C]0.0437[/C][C]0.482597[/C][/ROW]
[/TABLE]
Source: https://freestatistics.org/blog/index.php?pk=112856&T=2

Globally Unique Identifier (entire table): ba.freestatistics.org/blog/index.php?pk=112856&T=2

As an alternative you can also use a QR Code:  

The GUIDs for individual cells are displayed in the table below:

Partial Autocorrelation Function
Time lag kPACF(k)T-STATP-value
10.2727013.10930.001152
2-0.015999-0.18240.427769
30.2182312.48820.007051
40.0644690.73510.231813
50.1413311.61140.054756
6-0.115286-1.31450.095502
7-0.010086-0.1150.454312
80.0613850.69990.242621
9-0.020302-0.23150.408655
10-0.122997-1.40240.081593
110.1537551.75310.040973
12-0.072489-0.82650.205016
13-0.010171-0.1160.453928
140.0600540.68470.247369
150.0010340.01180.495308
160.0321540.36660.357252
17-0.13957-1.59130.056981
18-0.017439-0.19880.421352
190.0416550.47490.317812
20-0.187261-2.13510.017314
210.0344870.39320.347403
22-0.076345-0.87050.192825
23-0.062405-0.71150.239016
24-0.012256-0.13970.444539
250.0257760.29390.384653
26-0.074516-0.84960.198551
270.0256370.29230.385258
280.0723370.82480.205505
290.0478730.54580.293059
30-0.043846-0.49990.30899
31-0.036762-0.41920.337897
320.040460.46130.32267
33-0.107353-1.2240.11158
340.0126460.14420.442786
35-0.108557-1.23770.109022
360.055870.6370.262617
37-0.091439-1.04260.149543
380.0127830.14570.442173
390.0635430.72450.235031
40-0.058068-0.66210.254547
41-0.014105-0.16080.436244
420.017310.19740.421926
43-0.157479-1.79550.037446
440.0273420.31170.377867
45-0.080503-0.91790.180192
46-0.025626-0.29220.385305
47-0.071115-0.81080.209471
480.0051910.05920.476448
49-0.03754-0.4280.334673
50-0.011021-0.12570.450097
51-0.070211-0.80050.212433
52-0.033891-0.38640.349912
53-0.010794-0.12310.451121
540.0607410.69250.244914
55-0.078834-0.89880.185199
560.070270.80120.212239
57-0.103767-1.18310.119458
58-0.072805-0.83010.204
590.0152390.17380.431164
600.0038350.04370.482597


Parameters (Session):
par1 = 60 ; par2 = 1 ; par3 = 1 ; par4 = 0 ; par5 = 12 ; par6 = White Noise ; par7 = 0.95 ;
Parameters (R input):
par1 = 60 ; par2 = 1 ; par3 = 1 ; par4 = 0 ; par5 = 12 ; par6 = White Noise ; par7 = 0.95 ; par8 = ;
R code (references can be found in the software module):
if (par1 == 'Default') {
par1 = 10*log10(length(x))
} else {
par1 <- as.numeric(par1)
}
par2 <- as.numeric(par2)
par3 <- as.numeric(par3)
par4 <- as.numeric(par4)
par5 <- as.numeric(par5)
if (par6 == 'White Noise') par6 <- 'white' else par6 <- 'ma'
par7 <- as.numeric(par7)
if (par8 != '') par8 <- as.numeric(par8)
ox <- x
if (par8 == '') {
if (par2 == 0) {
x <- log(x)
} else {
x <- (x ^ par2 - 1) / par2
}
} else {
x <- log(x,base=par8)
}
if (par3 > 0) x <- diff(x,lag=1,difference=par3)
if (par4 > 0) x <- diff(x,lag=par5,difference=par4)
bitmap(file='picts.png')
op <- par(mfrow=c(2,1))
plot(ox,type='l',main='Original Time Series',xlab='time',ylab='value')
if (par8=='') {
mytitle <- paste('Working Time Series (lambda=',par2,', d=',par3,', D=',par4,')',sep='')
mysub <- paste('(lambda=',par2,', d=',par3,', D=',par4,', CI=', par7, ', CI type=',par6,')',sep='')
} else {
mytitle <- paste('Working Time Series (base=',par8,', d=',par3,', D=',par4,')',sep='')
mysub <- paste('(base=',par8,', d=',par3,', D=',par4,', CI=', par7, ', CI type=',par6,')',sep='')
}
plot(x,type='l', main=mytitle,xlab='time',ylab='value')
par(op)
dev.off()
bitmap(file='pic1.png')
racf <- acf(x, par1, main='Autocorrelation', xlab='time lag', ylab='ACF', ci.type=par6, ci=par7, sub=mysub)
dev.off()
bitmap(file='pic2.png')
rpacf <- pacf(x,par1,main='Partial Autocorrelation',xlab='lags',ylab='PACF',sub=mysub)
dev.off()
(myacf <- c(racf$acf))
(mypacf <- c(rpacf$acf))
lengthx <- length(x)
sqrtn <- sqrt(lengthx)
load(file='createtable')
a<-table.start()
a<-table.row.start(a)
a<-table.element(a,'Autocorrelation Function',4,TRUE)
a<-table.row.end(a)
a<-table.row.start(a)
a<-table.element(a,'Time lag k',header=TRUE)
a<-table.element(a,hyperlink('basics.htm','ACF(k)','click here for more information about the Autocorrelation Function'),header=TRUE)
a<-table.element(a,'T-STAT',header=TRUE)
a<-table.element(a,'P-value',header=TRUE)
a<-table.row.end(a)
for (i in 2:(par1+1)) {
a<-table.row.start(a)
a<-table.element(a,i-1,header=TRUE)
a<-table.element(a,round(myacf[i],6))
mytstat <- myacf[i]*sqrtn
a<-table.element(a,round(mytstat,4))
a<-table.element(a,round(1-pt(abs(mytstat),lengthx),6))
a<-table.row.end(a)
}
a<-table.end(a)
table.save(a,file='mytable.tab')
a<-table.start()
a<-table.row.start(a)
a<-table.element(a,'Partial Autocorrelation Function',4,TRUE)
a<-table.row.end(a)
a<-table.row.start(a)
a<-table.element(a,'Time lag k',header=TRUE)
a<-table.element(a,hyperlink('basics.htm','PACF(k)','click here for more information about the Partial Autocorrelation Function'),header=TRUE)
a<-table.element(a,'T-STAT',header=TRUE)
a<-table.element(a,'P-value',header=TRUE)
a<-table.row.end(a)
for (i in 1:par1) {
a<-table.row.start(a)
a<-table.element(a,i,header=TRUE)
a<-table.element(a,round(mypacf[i],6))
mytstat <- mypacf[i]*sqrtn
a<-table.element(a,round(mytstat,4))
a<-table.element(a,round(1-pt(abs(mytstat),lengthx),6))
a<-table.row.end(a)
}
a<-table.end(a)
table.save(a,file='mytable1.tab')