Free Statistics
of Irreproducible Research!
Description of Statistical Computation | |||||||||||||||||||||||||||||||||||||||||||||||||||||||||||||||||||||||||||||||||||||||||||||||||||
|---|---|---|---|---|---|---|---|---|---|---|---|---|---|---|---|---|---|---|---|---|---|---|---|---|---|---|---|---|---|---|---|---|---|---|---|---|---|---|---|---|---|---|---|---|---|---|---|---|---|---|---|---|---|---|---|---|---|---|---|---|---|---|---|---|---|---|---|---|---|---|---|---|---|---|---|---|---|---|---|---|---|---|---|---|---|---|---|---|---|---|---|---|---|---|---|---|---|---|---|
| Author's title | |||||||||||||||||||||||||||||||||||||||||||||||||||||||||||||||||||||||||||||||||||||||||||||||||||
| Author | *The author of this computation has been verified* | ||||||||||||||||||||||||||||||||||||||||||||||||||||||||||||||||||||||||||||||||||||||||||||||||||
| R Software Module | rwasp_correlation.wasp | ||||||||||||||||||||||||||||||||||||||||||||||||||||||||||||||||||||||||||||||||||||||||||||||||||
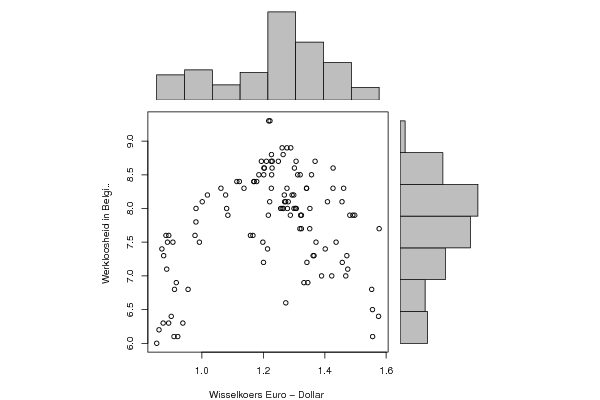
| Title produced by software | Pearson Correlation | ||||||||||||||||||||||||||||||||||||||||||||||||||||||||||||||||||||||||||||||||||||||||||||||||||
| Date of computation | Mon, 20 Dec 2010 11:17:27 +0000 | ||||||||||||||||||||||||||||||||||||||||||||||||||||||||||||||||||||||||||||||||||||||||||||||||||
| Cite this page as follows | Statistical Computations at FreeStatistics.org, Office for Research Development and Education, URL https://freestatistics.org/blog/index.php?v=date/2010/Dec/20/t1292843700vzguhknzq7p8p5p.htm/, Retrieved Fri, 03 May 2024 21:50:25 +0000 | ||||||||||||||||||||||||||||||||||||||||||||||||||||||||||||||||||||||||||||||||||||||||||||||||||
| Statistical Computations at FreeStatistics.org, Office for Research Development and Education, URL https://freestatistics.org/blog/index.php?pk=112843, Retrieved Fri, 03 May 2024 21:50:25 +0000 | |||||||||||||||||||||||||||||||||||||||||||||||||||||||||||||||||||||||||||||||||||||||||||||||||||
| QR Codes: | |||||||||||||||||||||||||||||||||||||||||||||||||||||||||||||||||||||||||||||||||||||||||||||||||||
|
| |||||||||||||||||||||||||||||||||||||||||||||||||||||||||||||||||||||||||||||||||||||||||||||||||||
| Original text written by user: | |||||||||||||||||||||||||||||||||||||||||||||||||||||||||||||||||||||||||||||||||||||||||||||||||||
| IsPrivate? | No (this computation is public) | ||||||||||||||||||||||||||||||||||||||||||||||||||||||||||||||||||||||||||||||||||||||||||||||||||
| User-defined keywords | |||||||||||||||||||||||||||||||||||||||||||||||||||||||||||||||||||||||||||||||||||||||||||||||||||
| Estimated Impact | 131 | ||||||||||||||||||||||||||||||||||||||||||||||||||||||||||||||||||||||||||||||||||||||||||||||||||
Tree of Dependent Computations | |||||||||||||||||||||||||||||||||||||||||||||||||||||||||||||||||||||||||||||||||||||||||||||||||||
| Family? (F = Feedback message, R = changed R code, M = changed R Module, P = changed Parameters, D = changed Data) | |||||||||||||||||||||||||||||||||||||||||||||||||||||||||||||||||||||||||||||||||||||||||||||||||||
| - [Mean versus Median] [Totale Invoer naa...] [2008-12-07 18:21:05] [299afd6311e4c20059ea2f05c8dd029d] - RM D [Variability] [Totale Invoer naa...] [2008-12-07 18:28:38] [299afd6311e4c20059ea2f05c8dd029d] - RMP [Stem-and-leaf Plot] [Totale Invoer naa...] [2008-12-07 18:32:41] [299afd6311e4c20059ea2f05c8dd029d] - RMPD [Quartiles] [Totale Invoer naa...] [2008-12-07 18:52:56] [299afd6311e4c20059ea2f05c8dd029d] - RM D [Harrell-Davis Quantiles] [Totale Invoer naa...] [2008-12-07 19:02:20] [299afd6311e4c20059ea2f05c8dd029d] - RM D [Pearson Correlation] [Totale Uitvoer vs...] [2008-12-07 19:10:32] [299afd6311e4c20059ea2f05c8dd029d] - MPD [Pearson Correlation] [] [2010-12-20 11:17:27] [23ca1b0f6f6de1e008a90be3f55e3db8] [Current] | |||||||||||||||||||||||||||||||||||||||||||||||||||||||||||||||||||||||||||||||||||||||||||||||||||
| Feedback Forum | |||||||||||||||||||||||||||||||||||||||||||||||||||||||||||||||||||||||||||||||||||||||||||||||||||
Post a new message | |||||||||||||||||||||||||||||||||||||||||||||||||||||||||||||||||||||||||||||||||||||||||||||||||||
Dataset | |||||||||||||||||||||||||||||||||||||||||||||||||||||||||||||||||||||||||||||||||||||||||||||||||||
| Dataseries X: | |||||||||||||||||||||||||||||||||||||||||||||||||||||||||||||||||||||||||||||||||||||||||||||||||||
1.3067 1.2894 1.2770 1.2208 1.2565 1.3406 1.3569 1.3686 1.4272 1.4614 1.4914 1.4816 1.4562 1.4268 1.4088 1.4016 1.3650 1.3190 1.3050 1.2785 1.3239 1.3449 1.2732 1.3322 1.4369 1.4975 1.5770 1.5553 1.5557 1.5750 1.5527 1.4748 1.4718 1.4570 1.4684 1.4227 1.3896 1.3622 1.3716 1.3419 1.3511 1.3516 1.3242 1.3074 1.2999 1.3213 1.2881 1.2611 1.2727 1.2811 1.2684 1.2650 1.2770 1.2271 1.2020 1.1938 1.2103 1.1856 1.1786 1.2015 1.2256 1.2292 1.2037 1.2165 1.2694 1.2938 1.3201 1.3014 1.3119 1.3408 1.2991 1.2490 1.2218 1.2176 1.2266 1.2138 1.2007 1.1985 1.2262 1.2646 1.2613 1.2286 1.1702 1.1692 1.1222 1.1139 1.1372 1.1663 1.1582 1.0848 1.0807 1.0773 1.0622 1.0183 1.0014 0.9811 0.9808 0.9778 0.9922 0.9554 0.9170 0.8858 0.8758 0.8700 0.8833 0.8924 0.8883 0.9059 0.9111 0.9005 0.8607 0.8532 0.8742 0.8920 0.9095 0.9217 0.9383 | |||||||||||||||||||||||||||||||||||||||||||||||||||||||||||||||||||||||||||||||||||||||||||||||||||
| Dataseries Y: | |||||||||||||||||||||||||||||||||||||||||||||||||||||||||||||||||||||||||||||||||||||||||||||||||||
8.7000 8.9000 8.9000 8.1000 8.0000 8.3000 8.5000 8.7000 8.6000 8.3000 7.9000 7.9000 8.1000 8.3000 8.1000 7.4000 7.3000 7.7000 8.0000 8.0000 7.7000 6.9000 6.6000 6.9000 7.5000 7.9000 7.7000 6.5000 6.1000 6.4000 6.8000 7.1000 7.3000 7.2000 7.0000 7.0000 7.0000 7.3000 7.5000 7.2000 7.7000 8.0000 7.9000 8.0000 8.0000 7.9000 7.9000 8.0000 8.1000 8.1000 8.2000 8.0000 8.3000 8.5000 8.6000 8.7000 8.7000 8.5000 8.4000 8.5000 8.7000 8.7000 8.6000 7.9000 8.1000 8.2000 8.5000 8.6000 8.5000 8.3000 8.2000 8.7000 9.3000 9.3000 8.8000 7.4000 7.2000 7.5000 8.3000 8.8000 8.9000 8.6000 8.4000 8.4000 8.4000 8.4000 8.3000 7.6000 7.6000 7.9000 8.0000 8.2000 8.3000 8.2000 8.1000 8.0000 7.8000 7.6000 7.5000 6.8000 6.9000 7.1000 7.3000 7.4000 7.6000 7.6000 7.5000 7.5000 6.8000 6.4000 6.2000 6.0000 6.3000 6.3000 6.1000 6.1000 6.3000 | |||||||||||||||||||||||||||||||||||||||||||||||||||||||||||||||||||||||||||||||||||||||||||||||||||
Tables (Output of Computation) | |||||||||||||||||||||||||||||||||||||||||||||||||||||||||||||||||||||||||||||||||||||||||||||||||||
| |||||||||||||||||||||||||||||||||||||||||||||||||||||||||||||||||||||||||||||||||||||||||||||||||||
Figures (Output of Computation) | |||||||||||||||||||||||||||||||||||||||||||||||||||||||||||||||||||||||||||||||||||||||||||||||||||
Input Parameters & R Code | |||||||||||||||||||||||||||||||||||||||||||||||||||||||||||||||||||||||||||||||||||||||||||||||||||
| Parameters (Session): | |||||||||||||||||||||||||||||||||||||||||||||||||||||||||||||||||||||||||||||||||||||||||||||||||||
| Parameters (R input): | |||||||||||||||||||||||||||||||||||||||||||||||||||||||||||||||||||||||||||||||||||||||||||||||||||
| R code (references can be found in the software module): | |||||||||||||||||||||||||||||||||||||||||||||||||||||||||||||||||||||||||||||||||||||||||||||||||||
bitmap(file='test1.png') | |||||||||||||||||||||||||||||||||||||||||||||||||||||||||||||||||||||||||||||||||||||||||||||||||||