Free Statistics

of Irreproducible Research!

Author's title

Author*The author of this computation has been verified*
R Software Modulerwasp_autocorrelation.wasp
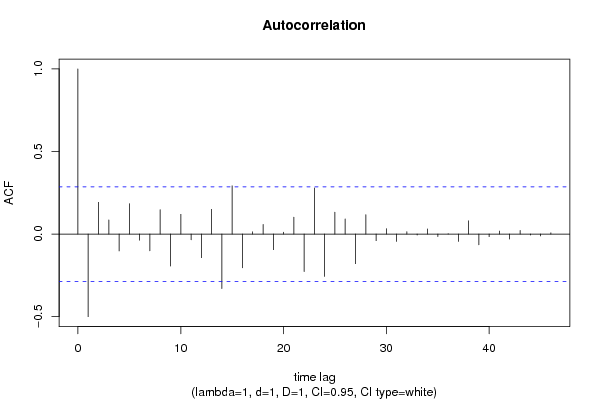
Title produced by software(Partial) Autocorrelation Function
Date of computationMon, 20 Dec 2010 09:36:47 +0000
Cite this page as followsStatistical Computations at FreeStatistics.org, Office for Research Development and Education, URL https://freestatistics.org/blog/index.php?v=date/2010/Dec/20/t12928376774k9cqkjatw1r9ik.htm/, Retrieved Sat, 04 May 2024 03:50:01 +0000
Statistical Computations at FreeStatistics.org, Office for Research Development and Education, URL https://freestatistics.org/blog/index.php?pk=112813, Retrieved Sat, 04 May 2024 03:50:01 +0000
QR Codes:

Original text written by user:
IsPrivate?No (this computation is public)
User-defined keywords
Estimated Impact144
Family? (F = Feedback message, R = changed R code, M = changed R Module, P = changed Parameters, D = changed Data)
F     [(Partial) Autocorrelation Function] [acf methode] [2009-11-25 20:17:41] [21324e9cdf3569788a3d630236984d87]
-   P   [(Partial) Autocorrelation Function] [acf methode] [2009-11-30 18:50:07] [21324e9cdf3569788a3d630236984d87]
-    D    [(Partial) Autocorrelation Function] [] [2010-12-16 14:40:12] [f47feae0308dca73181bb669fbad1c56]
-   PD      [(Partial) Autocorrelation Function] [] [2010-12-16 14:50:06] [f47feae0308dca73181bb669fbad1c56]
-   P           [(Partial) Autocorrelation Function] [] [2010-12-20 09:36:47] [1d208f56d63f78e3037c4c685f0bba30] [Current]
Feedback Forum

Post a new message
Dataseries X:
112.3
117.3
111.1
102.2
104.3
122.9
107.6
121.3
131.5
89
104.4
128.9
135.9
133.3
121.3
120.5
120.4
137.9
126.1
133.2
151.1
105
119
140.4
156.6
137.1
122.7
125.8
139.3
134.9
149.2
132.3
149
117.2
119.6
152
149.4
127.3
114.1
102.1
107.7
104.4
102.1
96
109.3
90
83.9
112
114.3
103.6
91.7
80.8
87.2
109.2
102.7
95.1
117.5
85.1
92.1
113.5


Summary of computational transaction
Raw Inputview raw input (R code)
Raw Outputview raw output of R engine
Computing time2 seconds
R Server'George Udny Yule' @ 72.249.76.132

\begin{tabular}{lllllllll}
\hline
Summary of computational transaction \tabularnewline
Raw Input & view raw input (R code)  \tabularnewline
Raw Output & view raw output of R engine  \tabularnewline
Computing time & 2 seconds \tabularnewline
R Server & 'George Udny Yule' @ 72.249.76.132 \tabularnewline
\hline
\end{tabular}
%Source: https://freestatistics.org/blog/index.php?pk=112813&T=0

[TABLE]
[ROW][C]Summary of computational transaction[/C][/ROW]
[ROW][C]Raw Input[/C][C]view raw input (R code) [/C][/ROW]
[ROW][C]Raw Output[/C][C]view raw output of R engine [/C][/ROW]
[ROW][C]Computing time[/C][C]2 seconds[/C][/ROW]
[ROW][C]R Server[/C][C]'George Udny Yule' @ 72.249.76.132[/C][/ROW]
[/TABLE]
Source: https://freestatistics.org/blog/index.php?pk=112813&T=0

Globally Unique Identifier (entire table): ba.freestatistics.org/blog/index.php?pk=112813&T=0

As an alternative you can also use a QR Code:  

The GUIDs for individual cells are displayed in the table below:

Summary of computational transaction
Raw Inputview raw input (R code)
Raw Outputview raw output of R engine
Computing time2 seconds
R Server'George Udny Yule' @ 72.249.76.132


Autocorrelation Function
Time lag kACF(k)T-STATP-value
1-0.500208-3.42930.000635
20.1926131.32050.096534
30.0854690.58590.280358
4-0.101878-0.69840.244172
50.1840511.26180.106626
6-0.037328-0.25590.399569
7-0.101815-0.6980.244306
80.1476261.01210.158342
9-0.193821-1.32880.09517
100.1196210.82010.208156
11-0.035007-0.240.405688
12-0.143406-0.98310.165286
130.1499121.02770.154666
14-0.330175-2.26360.014129
150.2923222.00410.025423
16-0.204713-1.40340.083529
170.0133830.09170.463645
180.0583980.40040.345354
19-0.09476-0.64960.259544
200.0114330.07840.468929
210.1025610.70310.242723
22-0.227504-1.55970.062771
230.27941.91550.030764
24-0.25662-1.75930.042518
250.1325740.90890.184026
260.0915010.62730.26675
27-0.179527-1.23080.112265
280.117480.80540.212322
29-0.040426-0.27710.391442
300.0324260.22230.412522
31-0.044884-0.30770.379832
320.0142550.09770.461281
33-0.006108-0.04190.483387
340.0307610.21090.416942
35-0.015422-0.10570.458124
360.0024650.01690.493293
37-0.045051-0.30890.3794
380.0805370.55210.291737
39-0.064822-0.44440.329398
40-0.015765-0.10810.457196
410.0181420.12440.450776
42-0.030297-0.20770.418179
430.0222920.15280.439594
44-0.006303-0.04320.482859
45-0.011229-0.0770.469481
460.0078490.05380.478658
47NANANA
48NANANA
49NANANA
50NANANA
51NANANA
52NANANA
53NANANA
54NANANA
55NANANA
56NANANA
57NANANA
58NANANA
59NANANA
60NANANA

\begin{tabular}{lllllllll}
\hline
Autocorrelation Function \tabularnewline
Time lag k & ACF(k) & T-STAT & P-value \tabularnewline
1 & -0.500208 & -3.4293 & 0.000635 \tabularnewline
2 & 0.192613 & 1.3205 & 0.096534 \tabularnewline
3 & 0.085469 & 0.5859 & 0.280358 \tabularnewline
4 & -0.101878 & -0.6984 & 0.244172 \tabularnewline
5 & 0.184051 & 1.2618 & 0.106626 \tabularnewline
6 & -0.037328 & -0.2559 & 0.399569 \tabularnewline
7 & -0.101815 & -0.698 & 0.244306 \tabularnewline
8 & 0.147626 & 1.0121 & 0.158342 \tabularnewline
9 & -0.193821 & -1.3288 & 0.09517 \tabularnewline
10 & 0.119621 & 0.8201 & 0.208156 \tabularnewline
11 & -0.035007 & -0.24 & 0.405688 \tabularnewline
12 & -0.143406 & -0.9831 & 0.165286 \tabularnewline
13 & 0.149912 & 1.0277 & 0.154666 \tabularnewline
14 & -0.330175 & -2.2636 & 0.014129 \tabularnewline
15 & 0.292322 & 2.0041 & 0.025423 \tabularnewline
16 & -0.204713 & -1.4034 & 0.083529 \tabularnewline
17 & 0.013383 & 0.0917 & 0.463645 \tabularnewline
18 & 0.058398 & 0.4004 & 0.345354 \tabularnewline
19 & -0.09476 & -0.6496 & 0.259544 \tabularnewline
20 & 0.011433 & 0.0784 & 0.468929 \tabularnewline
21 & 0.102561 & 0.7031 & 0.242723 \tabularnewline
22 & -0.227504 & -1.5597 & 0.062771 \tabularnewline
23 & 0.2794 & 1.9155 & 0.030764 \tabularnewline
24 & -0.25662 & -1.7593 & 0.042518 \tabularnewline
25 & 0.132574 & 0.9089 & 0.184026 \tabularnewline
26 & 0.091501 & 0.6273 & 0.26675 \tabularnewline
27 & -0.179527 & -1.2308 & 0.112265 \tabularnewline
28 & 0.11748 & 0.8054 & 0.212322 \tabularnewline
29 & -0.040426 & -0.2771 & 0.391442 \tabularnewline
30 & 0.032426 & 0.2223 & 0.412522 \tabularnewline
31 & -0.044884 & -0.3077 & 0.379832 \tabularnewline
32 & 0.014255 & 0.0977 & 0.461281 \tabularnewline
33 & -0.006108 & -0.0419 & 0.483387 \tabularnewline
34 & 0.030761 & 0.2109 & 0.416942 \tabularnewline
35 & -0.015422 & -0.1057 & 0.458124 \tabularnewline
36 & 0.002465 & 0.0169 & 0.493293 \tabularnewline
37 & -0.045051 & -0.3089 & 0.3794 \tabularnewline
38 & 0.080537 & 0.5521 & 0.291737 \tabularnewline
39 & -0.064822 & -0.4444 & 0.329398 \tabularnewline
40 & -0.015765 & -0.1081 & 0.457196 \tabularnewline
41 & 0.018142 & 0.1244 & 0.450776 \tabularnewline
42 & -0.030297 & -0.2077 & 0.418179 \tabularnewline
43 & 0.022292 & 0.1528 & 0.439594 \tabularnewline
44 & -0.006303 & -0.0432 & 0.482859 \tabularnewline
45 & -0.011229 & -0.077 & 0.469481 \tabularnewline
46 & 0.007849 & 0.0538 & 0.478658 \tabularnewline
47 & NA & NA & NA \tabularnewline
48 & NA & NA & NA \tabularnewline
49 & NA & NA & NA \tabularnewline
50 & NA & NA & NA \tabularnewline
51 & NA & NA & NA \tabularnewline
52 & NA & NA & NA \tabularnewline
53 & NA & NA & NA \tabularnewline
54 & NA & NA & NA \tabularnewline
55 & NA & NA & NA \tabularnewline
56 & NA & NA & NA \tabularnewline
57 & NA & NA & NA \tabularnewline
58 & NA & NA & NA \tabularnewline
59 & NA & NA & NA \tabularnewline
60 & NA & NA & NA \tabularnewline
\hline
\end{tabular}
%Source: https://freestatistics.org/blog/index.php?pk=112813&T=1

[TABLE]
[ROW][C]Autocorrelation Function[/C][/ROW]
[ROW][C]Time lag k[/C][C]ACF(k)[/C][C]T-STAT[/C][C]P-value[/C][/ROW]
[ROW][C]1[/C][C]-0.500208[/C][C]-3.4293[/C][C]0.000635[/C][/ROW]
[ROW][C]2[/C][C]0.192613[/C][C]1.3205[/C][C]0.096534[/C][/ROW]
[ROW][C]3[/C][C]0.085469[/C][C]0.5859[/C][C]0.280358[/C][/ROW]
[ROW][C]4[/C][C]-0.101878[/C][C]-0.6984[/C][C]0.244172[/C][/ROW]
[ROW][C]5[/C][C]0.184051[/C][C]1.2618[/C][C]0.106626[/C][/ROW]
[ROW][C]6[/C][C]-0.037328[/C][C]-0.2559[/C][C]0.399569[/C][/ROW]
[ROW][C]7[/C][C]-0.101815[/C][C]-0.698[/C][C]0.244306[/C][/ROW]
[ROW][C]8[/C][C]0.147626[/C][C]1.0121[/C][C]0.158342[/C][/ROW]
[ROW][C]9[/C][C]-0.193821[/C][C]-1.3288[/C][C]0.09517[/C][/ROW]
[ROW][C]10[/C][C]0.119621[/C][C]0.8201[/C][C]0.208156[/C][/ROW]
[ROW][C]11[/C][C]-0.035007[/C][C]-0.24[/C][C]0.405688[/C][/ROW]
[ROW][C]12[/C][C]-0.143406[/C][C]-0.9831[/C][C]0.165286[/C][/ROW]
[ROW][C]13[/C][C]0.149912[/C][C]1.0277[/C][C]0.154666[/C][/ROW]
[ROW][C]14[/C][C]-0.330175[/C][C]-2.2636[/C][C]0.014129[/C][/ROW]
[ROW][C]15[/C][C]0.292322[/C][C]2.0041[/C][C]0.025423[/C][/ROW]
[ROW][C]16[/C][C]-0.204713[/C][C]-1.4034[/C][C]0.083529[/C][/ROW]
[ROW][C]17[/C][C]0.013383[/C][C]0.0917[/C][C]0.463645[/C][/ROW]
[ROW][C]18[/C][C]0.058398[/C][C]0.4004[/C][C]0.345354[/C][/ROW]
[ROW][C]19[/C][C]-0.09476[/C][C]-0.6496[/C][C]0.259544[/C][/ROW]
[ROW][C]20[/C][C]0.011433[/C][C]0.0784[/C][C]0.468929[/C][/ROW]
[ROW][C]21[/C][C]0.102561[/C][C]0.7031[/C][C]0.242723[/C][/ROW]
[ROW][C]22[/C][C]-0.227504[/C][C]-1.5597[/C][C]0.062771[/C][/ROW]
[ROW][C]23[/C][C]0.2794[/C][C]1.9155[/C][C]0.030764[/C][/ROW]
[ROW][C]24[/C][C]-0.25662[/C][C]-1.7593[/C][C]0.042518[/C][/ROW]
[ROW][C]25[/C][C]0.132574[/C][C]0.9089[/C][C]0.184026[/C][/ROW]
[ROW][C]26[/C][C]0.091501[/C][C]0.6273[/C][C]0.26675[/C][/ROW]
[ROW][C]27[/C][C]-0.179527[/C][C]-1.2308[/C][C]0.112265[/C][/ROW]
[ROW][C]28[/C][C]0.11748[/C][C]0.8054[/C][C]0.212322[/C][/ROW]
[ROW][C]29[/C][C]-0.040426[/C][C]-0.2771[/C][C]0.391442[/C][/ROW]
[ROW][C]30[/C][C]0.032426[/C][C]0.2223[/C][C]0.412522[/C][/ROW]
[ROW][C]31[/C][C]-0.044884[/C][C]-0.3077[/C][C]0.379832[/C][/ROW]
[ROW][C]32[/C][C]0.014255[/C][C]0.0977[/C][C]0.461281[/C][/ROW]
[ROW][C]33[/C][C]-0.006108[/C][C]-0.0419[/C][C]0.483387[/C][/ROW]
[ROW][C]34[/C][C]0.030761[/C][C]0.2109[/C][C]0.416942[/C][/ROW]
[ROW][C]35[/C][C]-0.015422[/C][C]-0.1057[/C][C]0.458124[/C][/ROW]
[ROW][C]36[/C][C]0.002465[/C][C]0.0169[/C][C]0.493293[/C][/ROW]
[ROW][C]37[/C][C]-0.045051[/C][C]-0.3089[/C][C]0.3794[/C][/ROW]
[ROW][C]38[/C][C]0.080537[/C][C]0.5521[/C][C]0.291737[/C][/ROW]
[ROW][C]39[/C][C]-0.064822[/C][C]-0.4444[/C][C]0.329398[/C][/ROW]
[ROW][C]40[/C][C]-0.015765[/C][C]-0.1081[/C][C]0.457196[/C][/ROW]
[ROW][C]41[/C][C]0.018142[/C][C]0.1244[/C][C]0.450776[/C][/ROW]
[ROW][C]42[/C][C]-0.030297[/C][C]-0.2077[/C][C]0.418179[/C][/ROW]
[ROW][C]43[/C][C]0.022292[/C][C]0.1528[/C][C]0.439594[/C][/ROW]
[ROW][C]44[/C][C]-0.006303[/C][C]-0.0432[/C][C]0.482859[/C][/ROW]
[ROW][C]45[/C][C]-0.011229[/C][C]-0.077[/C][C]0.469481[/C][/ROW]
[ROW][C]46[/C][C]0.007849[/C][C]0.0538[/C][C]0.478658[/C][/ROW]
[ROW][C]47[/C][C]NA[/C][C]NA[/C][C]NA[/C][/ROW]
[ROW][C]48[/C][C]NA[/C][C]NA[/C][C]NA[/C][/ROW]
[ROW][C]49[/C][C]NA[/C][C]NA[/C][C]NA[/C][/ROW]
[ROW][C]50[/C][C]NA[/C][C]NA[/C][C]NA[/C][/ROW]
[ROW][C]51[/C][C]NA[/C][C]NA[/C][C]NA[/C][/ROW]
[ROW][C]52[/C][C]NA[/C][C]NA[/C][C]NA[/C][/ROW]
[ROW][C]53[/C][C]NA[/C][C]NA[/C][C]NA[/C][/ROW]
[ROW][C]54[/C][C]NA[/C][C]NA[/C][C]NA[/C][/ROW]
[ROW][C]55[/C][C]NA[/C][C]NA[/C][C]NA[/C][/ROW]
[ROW][C]56[/C][C]NA[/C][C]NA[/C][C]NA[/C][/ROW]
[ROW][C]57[/C][C]NA[/C][C]NA[/C][C]NA[/C][/ROW]
[ROW][C]58[/C][C]NA[/C][C]NA[/C][C]NA[/C][/ROW]
[ROW][C]59[/C][C]NA[/C][C]NA[/C][C]NA[/C][/ROW]
[ROW][C]60[/C][C]NA[/C][C]NA[/C][C]NA[/C][/ROW]
[/TABLE]
Source: https://freestatistics.org/blog/index.php?pk=112813&T=1

Globally Unique Identifier (entire table): ba.freestatistics.org/blog/index.php?pk=112813&T=1

As an alternative you can also use a QR Code:  

The GUIDs for individual cells are displayed in the table below:

Autocorrelation Function
Time lag kACF(k)T-STATP-value
1-0.500208-3.42930.000635
20.1926131.32050.096534
30.0854690.58590.280358
4-0.101878-0.69840.244172
50.1840511.26180.106626
6-0.037328-0.25590.399569
7-0.101815-0.6980.244306
80.1476261.01210.158342
9-0.193821-1.32880.09517
100.1196210.82010.208156
11-0.035007-0.240.405688
12-0.143406-0.98310.165286
130.1499121.02770.154666
14-0.330175-2.26360.014129
150.2923222.00410.025423
16-0.204713-1.40340.083529
170.0133830.09170.463645
180.0583980.40040.345354
19-0.09476-0.64960.259544
200.0114330.07840.468929
210.1025610.70310.242723
22-0.227504-1.55970.062771
230.27941.91550.030764
24-0.25662-1.75930.042518
250.1325740.90890.184026
260.0915010.62730.26675
27-0.179527-1.23080.112265
280.117480.80540.212322
29-0.040426-0.27710.391442
300.0324260.22230.412522
31-0.044884-0.30770.379832
320.0142550.09770.461281
33-0.006108-0.04190.483387
340.0307610.21090.416942
35-0.015422-0.10570.458124
360.0024650.01690.493293
37-0.045051-0.30890.3794
380.0805370.55210.291737
39-0.064822-0.44440.329398
40-0.015765-0.10810.457196
410.0181420.12440.450776
42-0.030297-0.20770.418179
430.0222920.15280.439594
44-0.006303-0.04320.482859
45-0.011229-0.0770.469481
460.0078490.05380.478658
47NANANA
48NANANA
49NANANA
50NANANA
51NANANA
52NANANA
53NANANA
54NANANA
55NANANA
56NANANA
57NANANA
58NANANA
59NANANA
60NANANA


Partial Autocorrelation Function
Time lag kPACF(k)T-STATP-value
1-0.500208-3.42930.000635
2-0.076816-0.52660.300467
30.2023061.38690.086001
40.0529230.36280.359182
50.1532421.05060.149414
60.1341260.91950.18126
7-0.12686-0.86970.194439
8-0.037255-0.25540.399761
9-0.158189-1.08450.14184
10-0.053402-0.36610.357965
110.0202790.1390.445013
12-0.10844-0.74340.230463
130.0197640.13550.4464
14-0.296705-2.03410.023803
150.0707720.48520.314898
16-0.021915-0.15020.440608
170.0242040.16590.434459
180.046210.31680.3764
190.0273890.18780.425933
20-0.070878-0.48590.314642
210.006420.0440.48254
22-0.133718-0.91670.181984
230.0622320.42660.335794
24-0.089366-0.61270.271526
25-0.00833-0.05710.47735
260.0974050.66780.253771
27-0.010095-0.06920.47256
28-0.148334-1.01690.157197
290.0043870.03010.488067
300.0533780.36590.358024
31-0.117661-0.80660.211967
320.0113350.07770.469195
330.0068490.0470.481375
34-0.007093-0.04860.48071
350.0906740.62160.268596
36-0.119261-0.81760.208853
370.0151080.10360.458973
38-0.048625-0.33340.370175
390.0561420.38490.351027
40-0.085112-0.58350.281174
41-0.105931-0.72620.235651
42-0.00739-0.05070.479904
430.0262040.17960.429103
44-0.027017-0.18520.426928
450.0144620.09910.460721
460.0226290.15510.438689
47NANANA
48NANANA
49NANANA
50NANANA
51NANANA
52NANANA
53NANANA
54NANANA
55NANANA
56NANANA
57NANANA
58NANANA
59NANANA
60NANANA

\begin{tabular}{lllllllll}
\hline
Partial Autocorrelation Function \tabularnewline
Time lag k & PACF(k) & T-STAT & P-value \tabularnewline
1 & -0.500208 & -3.4293 & 0.000635 \tabularnewline
2 & -0.076816 & -0.5266 & 0.300467 \tabularnewline
3 & 0.202306 & 1.3869 & 0.086001 \tabularnewline
4 & 0.052923 & 0.3628 & 0.359182 \tabularnewline
5 & 0.153242 & 1.0506 & 0.149414 \tabularnewline
6 & 0.134126 & 0.9195 & 0.18126 \tabularnewline
7 & -0.12686 & -0.8697 & 0.194439 \tabularnewline
8 & -0.037255 & -0.2554 & 0.399761 \tabularnewline
9 & -0.158189 & -1.0845 & 0.14184 \tabularnewline
10 & -0.053402 & -0.3661 & 0.357965 \tabularnewline
11 & 0.020279 & 0.139 & 0.445013 \tabularnewline
12 & -0.10844 & -0.7434 & 0.230463 \tabularnewline
13 & 0.019764 & 0.1355 & 0.4464 \tabularnewline
14 & -0.296705 & -2.0341 & 0.023803 \tabularnewline
15 & 0.070772 & 0.4852 & 0.314898 \tabularnewline
16 & -0.021915 & -0.1502 & 0.440608 \tabularnewline
17 & 0.024204 & 0.1659 & 0.434459 \tabularnewline
18 & 0.04621 & 0.3168 & 0.3764 \tabularnewline
19 & 0.027389 & 0.1878 & 0.425933 \tabularnewline
20 & -0.070878 & -0.4859 & 0.314642 \tabularnewline
21 & 0.00642 & 0.044 & 0.48254 \tabularnewline
22 & -0.133718 & -0.9167 & 0.181984 \tabularnewline
23 & 0.062232 & 0.4266 & 0.335794 \tabularnewline
24 & -0.089366 & -0.6127 & 0.271526 \tabularnewline
25 & -0.00833 & -0.0571 & 0.47735 \tabularnewline
26 & 0.097405 & 0.6678 & 0.253771 \tabularnewline
27 & -0.010095 & -0.0692 & 0.47256 \tabularnewline
28 & -0.148334 & -1.0169 & 0.157197 \tabularnewline
29 & 0.004387 & 0.0301 & 0.488067 \tabularnewline
30 & 0.053378 & 0.3659 & 0.358024 \tabularnewline
31 & -0.117661 & -0.8066 & 0.211967 \tabularnewline
32 & 0.011335 & 0.0777 & 0.469195 \tabularnewline
33 & 0.006849 & 0.047 & 0.481375 \tabularnewline
34 & -0.007093 & -0.0486 & 0.48071 \tabularnewline
35 & 0.090674 & 0.6216 & 0.268596 \tabularnewline
36 & -0.119261 & -0.8176 & 0.208853 \tabularnewline
37 & 0.015108 & 0.1036 & 0.458973 \tabularnewline
38 & -0.048625 & -0.3334 & 0.370175 \tabularnewline
39 & 0.056142 & 0.3849 & 0.351027 \tabularnewline
40 & -0.085112 & -0.5835 & 0.281174 \tabularnewline
41 & -0.105931 & -0.7262 & 0.235651 \tabularnewline
42 & -0.00739 & -0.0507 & 0.479904 \tabularnewline
43 & 0.026204 & 0.1796 & 0.429103 \tabularnewline
44 & -0.027017 & -0.1852 & 0.426928 \tabularnewline
45 & 0.014462 & 0.0991 & 0.460721 \tabularnewline
46 & 0.022629 & 0.1551 & 0.438689 \tabularnewline
47 & NA & NA & NA \tabularnewline
48 & NA & NA & NA \tabularnewline
49 & NA & NA & NA \tabularnewline
50 & NA & NA & NA \tabularnewline
51 & NA & NA & NA \tabularnewline
52 & NA & NA & NA \tabularnewline
53 & NA & NA & NA \tabularnewline
54 & NA & NA & NA \tabularnewline
55 & NA & NA & NA \tabularnewline
56 & NA & NA & NA \tabularnewline
57 & NA & NA & NA \tabularnewline
58 & NA & NA & NA \tabularnewline
59 & NA & NA & NA \tabularnewline
60 & NA & NA & NA \tabularnewline
\hline
\end{tabular}
%Source: https://freestatistics.org/blog/index.php?pk=112813&T=2

[TABLE]
[ROW][C]Partial Autocorrelation Function[/C][/ROW]
[ROW][C]Time lag k[/C][C]PACF(k)[/C][C]T-STAT[/C][C]P-value[/C][/ROW]
[ROW][C]1[/C][C]-0.500208[/C][C]-3.4293[/C][C]0.000635[/C][/ROW]
[ROW][C]2[/C][C]-0.076816[/C][C]-0.5266[/C][C]0.300467[/C][/ROW]
[ROW][C]3[/C][C]0.202306[/C][C]1.3869[/C][C]0.086001[/C][/ROW]
[ROW][C]4[/C][C]0.052923[/C][C]0.3628[/C][C]0.359182[/C][/ROW]
[ROW][C]5[/C][C]0.153242[/C][C]1.0506[/C][C]0.149414[/C][/ROW]
[ROW][C]6[/C][C]0.134126[/C][C]0.9195[/C][C]0.18126[/C][/ROW]
[ROW][C]7[/C][C]-0.12686[/C][C]-0.8697[/C][C]0.194439[/C][/ROW]
[ROW][C]8[/C][C]-0.037255[/C][C]-0.2554[/C][C]0.399761[/C][/ROW]
[ROW][C]9[/C][C]-0.158189[/C][C]-1.0845[/C][C]0.14184[/C][/ROW]
[ROW][C]10[/C][C]-0.053402[/C][C]-0.3661[/C][C]0.357965[/C][/ROW]
[ROW][C]11[/C][C]0.020279[/C][C]0.139[/C][C]0.445013[/C][/ROW]
[ROW][C]12[/C][C]-0.10844[/C][C]-0.7434[/C][C]0.230463[/C][/ROW]
[ROW][C]13[/C][C]0.019764[/C][C]0.1355[/C][C]0.4464[/C][/ROW]
[ROW][C]14[/C][C]-0.296705[/C][C]-2.0341[/C][C]0.023803[/C][/ROW]
[ROW][C]15[/C][C]0.070772[/C][C]0.4852[/C][C]0.314898[/C][/ROW]
[ROW][C]16[/C][C]-0.021915[/C][C]-0.1502[/C][C]0.440608[/C][/ROW]
[ROW][C]17[/C][C]0.024204[/C][C]0.1659[/C][C]0.434459[/C][/ROW]
[ROW][C]18[/C][C]0.04621[/C][C]0.3168[/C][C]0.3764[/C][/ROW]
[ROW][C]19[/C][C]0.027389[/C][C]0.1878[/C][C]0.425933[/C][/ROW]
[ROW][C]20[/C][C]-0.070878[/C][C]-0.4859[/C][C]0.314642[/C][/ROW]
[ROW][C]21[/C][C]0.00642[/C][C]0.044[/C][C]0.48254[/C][/ROW]
[ROW][C]22[/C][C]-0.133718[/C][C]-0.9167[/C][C]0.181984[/C][/ROW]
[ROW][C]23[/C][C]0.062232[/C][C]0.4266[/C][C]0.335794[/C][/ROW]
[ROW][C]24[/C][C]-0.089366[/C][C]-0.6127[/C][C]0.271526[/C][/ROW]
[ROW][C]25[/C][C]-0.00833[/C][C]-0.0571[/C][C]0.47735[/C][/ROW]
[ROW][C]26[/C][C]0.097405[/C][C]0.6678[/C][C]0.253771[/C][/ROW]
[ROW][C]27[/C][C]-0.010095[/C][C]-0.0692[/C][C]0.47256[/C][/ROW]
[ROW][C]28[/C][C]-0.148334[/C][C]-1.0169[/C][C]0.157197[/C][/ROW]
[ROW][C]29[/C][C]0.004387[/C][C]0.0301[/C][C]0.488067[/C][/ROW]
[ROW][C]30[/C][C]0.053378[/C][C]0.3659[/C][C]0.358024[/C][/ROW]
[ROW][C]31[/C][C]-0.117661[/C][C]-0.8066[/C][C]0.211967[/C][/ROW]
[ROW][C]32[/C][C]0.011335[/C][C]0.0777[/C][C]0.469195[/C][/ROW]
[ROW][C]33[/C][C]0.006849[/C][C]0.047[/C][C]0.481375[/C][/ROW]
[ROW][C]34[/C][C]-0.007093[/C][C]-0.0486[/C][C]0.48071[/C][/ROW]
[ROW][C]35[/C][C]0.090674[/C][C]0.6216[/C][C]0.268596[/C][/ROW]
[ROW][C]36[/C][C]-0.119261[/C][C]-0.8176[/C][C]0.208853[/C][/ROW]
[ROW][C]37[/C][C]0.015108[/C][C]0.1036[/C][C]0.458973[/C][/ROW]
[ROW][C]38[/C][C]-0.048625[/C][C]-0.3334[/C][C]0.370175[/C][/ROW]
[ROW][C]39[/C][C]0.056142[/C][C]0.3849[/C][C]0.351027[/C][/ROW]
[ROW][C]40[/C][C]-0.085112[/C][C]-0.5835[/C][C]0.281174[/C][/ROW]
[ROW][C]41[/C][C]-0.105931[/C][C]-0.7262[/C][C]0.235651[/C][/ROW]
[ROW][C]42[/C][C]-0.00739[/C][C]-0.0507[/C][C]0.479904[/C][/ROW]
[ROW][C]43[/C][C]0.026204[/C][C]0.1796[/C][C]0.429103[/C][/ROW]
[ROW][C]44[/C][C]-0.027017[/C][C]-0.1852[/C][C]0.426928[/C][/ROW]
[ROW][C]45[/C][C]0.014462[/C][C]0.0991[/C][C]0.460721[/C][/ROW]
[ROW][C]46[/C][C]0.022629[/C][C]0.1551[/C][C]0.438689[/C][/ROW]
[ROW][C]47[/C][C]NA[/C][C]NA[/C][C]NA[/C][/ROW]
[ROW][C]48[/C][C]NA[/C][C]NA[/C][C]NA[/C][/ROW]
[ROW][C]49[/C][C]NA[/C][C]NA[/C][C]NA[/C][/ROW]
[ROW][C]50[/C][C]NA[/C][C]NA[/C][C]NA[/C][/ROW]
[ROW][C]51[/C][C]NA[/C][C]NA[/C][C]NA[/C][/ROW]
[ROW][C]52[/C][C]NA[/C][C]NA[/C][C]NA[/C][/ROW]
[ROW][C]53[/C][C]NA[/C][C]NA[/C][C]NA[/C][/ROW]
[ROW][C]54[/C][C]NA[/C][C]NA[/C][C]NA[/C][/ROW]
[ROW][C]55[/C][C]NA[/C][C]NA[/C][C]NA[/C][/ROW]
[ROW][C]56[/C][C]NA[/C][C]NA[/C][C]NA[/C][/ROW]
[ROW][C]57[/C][C]NA[/C][C]NA[/C][C]NA[/C][/ROW]
[ROW][C]58[/C][C]NA[/C][C]NA[/C][C]NA[/C][/ROW]
[ROW][C]59[/C][C]NA[/C][C]NA[/C][C]NA[/C][/ROW]
[ROW][C]60[/C][C]NA[/C][C]NA[/C][C]NA[/C][/ROW]
[/TABLE]
Source: https://freestatistics.org/blog/index.php?pk=112813&T=2

Globally Unique Identifier (entire table): ba.freestatistics.org/blog/index.php?pk=112813&T=2

As an alternative you can also use a QR Code:  

The GUIDs for individual cells are displayed in the table below:

Partial Autocorrelation Function
Time lag kPACF(k)T-STATP-value
1-0.500208-3.42930.000635
2-0.076816-0.52660.300467
30.2023061.38690.086001
40.0529230.36280.359182
50.1532421.05060.149414
60.1341260.91950.18126
7-0.12686-0.86970.194439
8-0.037255-0.25540.399761
9-0.158189-1.08450.14184
10-0.053402-0.36610.357965
110.0202790.1390.445013
12-0.10844-0.74340.230463
130.0197640.13550.4464
14-0.296705-2.03410.023803
150.0707720.48520.314898
16-0.021915-0.15020.440608
170.0242040.16590.434459
180.046210.31680.3764
190.0273890.18780.425933
20-0.070878-0.48590.314642
210.006420.0440.48254
22-0.133718-0.91670.181984
230.0622320.42660.335794
24-0.089366-0.61270.271526
25-0.00833-0.05710.47735
260.0974050.66780.253771
27-0.010095-0.06920.47256
28-0.148334-1.01690.157197
290.0043870.03010.488067
300.0533780.36590.358024
31-0.117661-0.80660.211967
320.0113350.07770.469195
330.0068490.0470.481375
34-0.007093-0.04860.48071
350.0906740.62160.268596
36-0.119261-0.81760.208853
370.0151080.10360.458973
38-0.048625-0.33340.370175
390.0561420.38490.351027
40-0.085112-0.58350.281174
41-0.105931-0.72620.235651
42-0.00739-0.05070.479904
430.0262040.17960.429103
44-0.027017-0.18520.426928
450.0144620.09910.460721
460.0226290.15510.438689
47NANANA
48NANANA
49NANANA
50NANANA
51NANANA
52NANANA
53NANANA
54NANANA
55NANANA
56NANANA
57NANANA
58NANANA
59NANANA
60NANANA


Parameters (Session):
par1 = 60 ; par2 = 1 ; par3 = 1 ; par4 = 1 ; par5 = 12 ; par6 = White Noise ; par7 = 0.95 ;
Parameters (R input):
par1 = 60 ; par2 = 1 ; par3 = 1 ; par4 = 1 ; par5 = 12 ; par6 = White Noise ; par7 = 0.95 ; par8 = ;
R code (references can be found in the software module):
if (par1 == 'Default') {
par1 = 10*log10(length(x))
} else {
par1 <- as.numeric(par1)
}
par2 <- as.numeric(par2)
par3 <- as.numeric(par3)
par4 <- as.numeric(par4)
par5 <- as.numeric(par5)
if (par6 == 'White Noise') par6 <- 'white' else par6 <- 'ma'
par7 <- as.numeric(par7)
if (par2 == 0) {
x <- log(x)
} else {
x <- (x ^ par2 - 1) / par2
}
if (par3 > 0) x <- diff(x,lag=1,difference=par3)
if (par4 > 0) x <- diff(x,lag=par5,difference=par4)
bitmap(file='pic1.png')
racf <- acf(x, par1, main='Autocorrelation', xlab='time lag', ylab='ACF', ci.type=par6, ci=par7, sub=paste('(lambda=',par2,', d=',par3,', D=',par4,', CI=', par7, ', CI type=',par6,')',sep=''))
dev.off()
bitmap(file='pic2.png')
rpacf <- pacf(x,par1,main='Partial Autocorrelation',xlab='lags',ylab='PACF')
dev.off()
(myacf <- c(racf$acf))
(mypacf <- c(rpacf$acf))
lengthx <- length(x)
sqrtn <- sqrt(lengthx)
load(file='createtable')
a<-table.start()
a<-table.row.start(a)
a<-table.element(a,'Autocorrelation Function',4,TRUE)
a<-table.row.end(a)
a<-table.row.start(a)
a<-table.element(a,'Time lag k',header=TRUE)
a<-table.element(a,hyperlink('basics.htm','ACF(k)','click here for more information about the Autocorrelation Function'),header=TRUE)
a<-table.element(a,'T-STAT',header=TRUE)
a<-table.element(a,'P-value',header=TRUE)
a<-table.row.end(a)
for (i in 2:(par1+1)) {
a<-table.row.start(a)
a<-table.element(a,i-1,header=TRUE)
a<-table.element(a,round(myacf[i],6))
mytstat <- myacf[i]*sqrtn
a<-table.element(a,round(mytstat,4))
a<-table.element(a,round(1-pt(abs(mytstat),lengthx),6))
a<-table.row.end(a)
}
a<-table.end(a)
table.save(a,file='mytable.tab')
a<-table.start()
a<-table.row.start(a)
a<-table.element(a,'Partial Autocorrelation Function',4,TRUE)
a<-table.row.end(a)
a<-table.row.start(a)
a<-table.element(a,'Time lag k',header=TRUE)
a<-table.element(a,hyperlink('basics.htm','PACF(k)','click here for more information about the Partial Autocorrelation Function'),header=TRUE)
a<-table.element(a,'T-STAT',header=TRUE)
a<-table.element(a,'P-value',header=TRUE)
a<-table.row.end(a)
for (i in 1:par1) {
a<-table.row.start(a)
a<-table.element(a,i,header=TRUE)
a<-table.element(a,round(mypacf[i],6))
mytstat <- mypacf[i]*sqrtn
a<-table.element(a,round(mytstat,4))
a<-table.element(a,round(1-pt(abs(mytstat),lengthx),6))
a<-table.row.end(a)
}
a<-table.end(a)
table.save(a,file='mytable1.tab')