Free Statistics

of Irreproducible Research!

Author's title

Author*The author of this computation has been verified*
R Software Modulerwasp_multipleregression.wasp
Title produced by softwareMultiple Regression
Date of computationMon, 20 Dec 2010 08:24:20 +0000
Cite this page as followsStatistical Computations at FreeStatistics.org, Office for Research Development and Education, URL https://freestatistics.org/blog/index.php?v=date/2010/Dec/20/t1292833344v65227njnxe0wow.htm/, Retrieved Fri, 03 May 2024 21:24:14 +0000
Statistical Computations at FreeStatistics.org, Office for Research Development and Education, URL https://freestatistics.org/blog/index.php?pk=112801, Retrieved Fri, 03 May 2024 21:24:14 +0000
QR Codes:

Original text written by user:
IsPrivate?No (this computation is public)
User-defined keywords
Estimated Impact160
Family? (F = Feedback message, R = changed R code, M = changed R Module, P = changed Parameters, D = changed Data)
-     [Multiple Regression] [] [2010-12-05 18:56:24] [b98453cac15ba1066b407e146608df68]
-   PD  [Multiple Regression] [ws10 multiple reg...] [2010-12-14 23:42:00] [f9eaed74daea918f73b9f505c5b1f19e]
-   P       [Multiple Regression] [Verbetering WS10] [2010-12-20 08:24:20] [c6b3e187a4a1689d42fffda4bc860ab5] [Current]
Feedback Forum

Post a new message
Dataseries X:
0.504208603	0.397232704
0.457969746	0.382767296
0.509923035	0.396037736
0.606622221	0.441761006
0.626210885	0.445220126
0.626631316	0.438490566
0.676731276	0.467484277
0.613117455	0.465786164
0.486215861	0.402075472
0.452529881	0.376163522
0.467150592	0.37591195
0.494624486	0.392955975
0.444567428	0.34490566
0.478862605	0.368553459
0.544458459	0.390880503
0.628201498	0.424842767
0.672578445	0.426855346
0.652706633	0.442327044
0.645430599	0.474842767
0.576334011	0.447610063
0.618334234	0.480754717
0.639896351	0.516037736
0.72850438	0.580628931
0.694655375	0.573522013
0.689773225	0.578867925
0.712244845	0.593584906
0.760337031	0.645974843
0.837816503	0.690503145
0.90688735	0.782201258
0.976018259	0.839056604
0.962066806	0.847484277
0.837593417	0.726855346
0.767638807	0.635534591
0.580006349	0.470943396
0.387740568	0.346163522
0.331274078	0.272327044
0.345251272	0.286792453
0.380172806	0.27672956
0.399838692	0.297421384
0.425742404	0.321698113
0.524183377	0.365597484
0.597115327	0.435220126
0.541489699	0.412893082
0.615039426	0.458679245
0.547924872	0.428427673
0.574540743	0.463522013
0.603438956	0.487169811
0.577492342	0.473584906
0.614198564	0.491886792
0.584776957	0.474842767
0.62752366	0.502327044
0.676859979	0.539371069
0.645996894	0.484402516
0.596059959	0.474654088
0.585961029	0.473522013
0.607617528	0.48754717
0.598462423	0.493333333
0.638703699	0.525157233
0.64923164	0.542704403


Summary of computational transaction
Raw Inputview raw input (R code)
Raw Outputview raw output of R engine
Computing time6 seconds
R Server'RServer@AstonUniversity' @ vre.aston.ac.uk

\begin{tabular}{lllllllll}
\hline
Summary of computational transaction \tabularnewline
Raw Input & view raw input (R code)  \tabularnewline
Raw Output & view raw output of R engine  \tabularnewline
Computing time & 6 seconds \tabularnewline
R Server & 'RServer@AstonUniversity' @ vre.aston.ac.uk \tabularnewline
\hline
\end{tabular}
%Source: https://freestatistics.org/blog/index.php?pk=112801&T=0

[TABLE]
[ROW][C]Summary of computational transaction[/C][/ROW]
[ROW][C]Raw Input[/C][C]view raw input (R code) [/C][/ROW]
[ROW][C]Raw Output[/C][C]view raw output of R engine [/C][/ROW]
[ROW][C]Computing time[/C][C]6 seconds[/C][/ROW]
[ROW][C]R Server[/C][C]'RServer@AstonUniversity' @ vre.aston.ac.uk[/C][/ROW]
[/TABLE]
Source: https://freestatistics.org/blog/index.php?pk=112801&T=0

Globally Unique Identifier (entire table): ba.freestatistics.org/blog/index.php?pk=112801&T=0

As an alternative you can also use a QR Code:  

The GUIDs for individual cells are displayed in the table below:

Summary of computational transaction
Raw Inputview raw input (R code)
Raw Outputview raw output of R engine
Computing time6 seconds
R Server'RServer@AstonUniversity' @ vre.aston.ac.uk


Multiple Linear Regression - Estimated Regression Equation
olie[t] = -0.0821808528703387 + 0.945106889984705benzine[t] -0.00109177410960875M1[t] -0.00524818743131263M2[t] -0.0216078434842863M3[t] -0.0479609090217005M4[t] -0.0691464777635879M5[t] -0.058274475041758M6[t] -0.0424983401680099M7[t] -0.0303160965189834M8[t] -0.0163841445707708M9[t] -0.0094090313816478M10[t] -0.00436586437226947M11[t] + 0.00048529461501224t + e[t]

\begin{tabular}{lllllllll}
\hline
Multiple Linear Regression - Estimated Regression Equation \tabularnewline
olie[t] =  -0.0821808528703387 +  0.945106889984705benzine[t] -0.00109177410960875M1[t] -0.00524818743131263M2[t] -0.0216078434842863M3[t] -0.0479609090217005M4[t] -0.0691464777635879M5[t] -0.058274475041758M6[t] -0.0424983401680099M7[t] -0.0303160965189834M8[t] -0.0163841445707708M9[t] -0.0094090313816478M10[t] -0.00436586437226947M11[t] +  0.00048529461501224t  + e[t] \tabularnewline
\hline
\end{tabular}
%Source: https://freestatistics.org/blog/index.php?pk=112801&T=1

[TABLE]
[ROW][C]Multiple Linear Regression - Estimated Regression Equation[/C][/ROW]
[ROW][C]olie[t] =  -0.0821808528703387 +  0.945106889984705benzine[t] -0.00109177410960875M1[t] -0.00524818743131263M2[t] -0.0216078434842863M3[t] -0.0479609090217005M4[t] -0.0691464777635879M5[t] -0.058274475041758M6[t] -0.0424983401680099M7[t] -0.0303160965189834M8[t] -0.0163841445707708M9[t] -0.0094090313816478M10[t] -0.00436586437226947M11[t] +  0.00048529461501224t  + e[t][/C][/ROW]
[/TABLE]
Source: https://freestatistics.org/blog/index.php?pk=112801&T=1

Globally Unique Identifier (entire table): ba.freestatistics.org/blog/index.php?pk=112801&T=1

As an alternative you can also use a QR Code:  

The GUIDs for individual cells are displayed in the table below:

Multiple Linear Regression - Estimated Regression Equation
olie[t] = -0.0821808528703387 + 0.945106889984705benzine[t] -0.00109177410960875M1[t] -0.00524818743131263M2[t] -0.0216078434842863M3[t] -0.0479609090217005M4[t] -0.0691464777635879M5[t] -0.058274475041758M6[t] -0.0424983401680099M7[t] -0.0303160965189834M8[t] -0.0163841445707708M9[t] -0.0094090313816478M10[t] -0.00436586437226947M11[t] + 0.00048529461501224t + e[t]


Multiple Linear Regression - Ordinary Least Squares
VariableParameterS.D.T-STATH0: parameter = 02-tail p-value1-tail p-value
(Intercept)-0.08218085287033870.022579-3.63970.0007010.000351
benzine0.9451068899847050.03120730.285600
M1-0.001091774109608750.019339-0.05650.9552290.477614
M2-0.005248187431312630.019327-0.27150.787210.393605
M3-0.02160784348428630.019369-1.11560.2705080.135254
M4-0.04796090902170050.019621-2.44440.018490.009245
M5-0.06914647776358790.019874-3.47920.0011280.000564
M6-0.0582744750417580.019983-2.91630.0055070.002753
M7-0.04249834016800990.019923-2.13310.0384030.019202
M8-0.03031609651898340.0197-1.53890.1308310.065415
M9-0.01638414457077080.019471-0.84150.4045440.202272
M10-0.00940903138164780.019393-0.48520.6299040.314952
M11-0.004365864372269470.019381-0.22530.8227910.411395
t0.000485294615012240.0002242.16760.0355220.017761

\begin{tabular}{lllllllll}
\hline
Multiple Linear Regression - Ordinary Least Squares \tabularnewline
Variable & Parameter & S.D. & T-STATH0: parameter = 0 & 2-tail p-value & 1-tail p-value \tabularnewline
(Intercept) & -0.0821808528703387 & 0.022579 & -3.6397 & 0.000701 & 0.000351 \tabularnewline
benzine & 0.945106889984705 & 0.031207 & 30.2856 & 0 & 0 \tabularnewline
M1 & -0.00109177410960875 & 0.019339 & -0.0565 & 0.955229 & 0.477614 \tabularnewline
M2 & -0.00524818743131263 & 0.019327 & -0.2715 & 0.78721 & 0.393605 \tabularnewline
M3 & -0.0216078434842863 & 0.019369 & -1.1156 & 0.270508 & 0.135254 \tabularnewline
M4 & -0.0479609090217005 & 0.019621 & -2.4444 & 0.01849 & 0.009245 \tabularnewline
M5 & -0.0691464777635879 & 0.019874 & -3.4792 & 0.001128 & 0.000564 \tabularnewline
M6 & -0.058274475041758 & 0.019983 & -2.9163 & 0.005507 & 0.002753 \tabularnewline
M7 & -0.0424983401680099 & 0.019923 & -2.1331 & 0.038403 & 0.019202 \tabularnewline
M8 & -0.0303160965189834 & 0.0197 & -1.5389 & 0.130831 & 0.065415 \tabularnewline
M9 & -0.0163841445707708 & 0.019471 & -0.8415 & 0.404544 & 0.202272 \tabularnewline
M10 & -0.0094090313816478 & 0.019393 & -0.4852 & 0.629904 & 0.314952 \tabularnewline
M11 & -0.00436586437226947 & 0.019381 & -0.2253 & 0.822791 & 0.411395 \tabularnewline
t & 0.00048529461501224 & 0.000224 & 2.1676 & 0.035522 & 0.017761 \tabularnewline
\hline
\end{tabular}
%Source: https://freestatistics.org/blog/index.php?pk=112801&T=2

[TABLE]
[ROW][C]Multiple Linear Regression - Ordinary Least Squares[/C][/ROW]
[ROW][C]Variable[/C][C]Parameter[/C][C]S.D.[/C][C]T-STATH0: parameter = 0[/C][C]2-tail p-value[/C][C]1-tail p-value[/C][/ROW]
[ROW][C](Intercept)[/C][C]-0.0821808528703387[/C][C]0.022579[/C][C]-3.6397[/C][C]0.000701[/C][C]0.000351[/C][/ROW]
[ROW][C]benzine[/C][C]0.945106889984705[/C][C]0.031207[/C][C]30.2856[/C][C]0[/C][C]0[/C][/ROW]
[ROW][C]M1[/C][C]-0.00109177410960875[/C][C]0.019339[/C][C]-0.0565[/C][C]0.955229[/C][C]0.477614[/C][/ROW]
[ROW][C]M2[/C][C]-0.00524818743131263[/C][C]0.019327[/C][C]-0.2715[/C][C]0.78721[/C][C]0.393605[/C][/ROW]
[ROW][C]M3[/C][C]-0.0216078434842863[/C][C]0.019369[/C][C]-1.1156[/C][C]0.270508[/C][C]0.135254[/C][/ROW]
[ROW][C]M4[/C][C]-0.0479609090217005[/C][C]0.019621[/C][C]-2.4444[/C][C]0.01849[/C][C]0.009245[/C][/ROW]
[ROW][C]M5[/C][C]-0.0691464777635879[/C][C]0.019874[/C][C]-3.4792[/C][C]0.001128[/C][C]0.000564[/C][/ROW]
[ROW][C]M6[/C][C]-0.058274475041758[/C][C]0.019983[/C][C]-2.9163[/C][C]0.005507[/C][C]0.002753[/C][/ROW]
[ROW][C]M7[/C][C]-0.0424983401680099[/C][C]0.019923[/C][C]-2.1331[/C][C]0.038403[/C][C]0.019202[/C][/ROW]
[ROW][C]M8[/C][C]-0.0303160965189834[/C][C]0.0197[/C][C]-1.5389[/C][C]0.130831[/C][C]0.065415[/C][/ROW]
[ROW][C]M9[/C][C]-0.0163841445707708[/C][C]0.019471[/C][C]-0.8415[/C][C]0.404544[/C][C]0.202272[/C][/ROW]
[ROW][C]M10[/C][C]-0.0094090313816478[/C][C]0.019393[/C][C]-0.4852[/C][C]0.629904[/C][C]0.314952[/C][/ROW]
[ROW][C]M11[/C][C]-0.00436586437226947[/C][C]0.019381[/C][C]-0.2253[/C][C]0.822791[/C][C]0.411395[/C][/ROW]
[ROW][C]t[/C][C]0.00048529461501224[/C][C]0.000224[/C][C]2.1676[/C][C]0.035522[/C][C]0.017761[/C][/ROW]
[/TABLE]
Source: https://freestatistics.org/blog/index.php?pk=112801&T=2

Globally Unique Identifier (entire table): ba.freestatistics.org/blog/index.php?pk=112801&T=2

As an alternative you can also use a QR Code:  

The GUIDs for individual cells are displayed in the table below:

Multiple Linear Regression - Ordinary Least Squares
VariableParameterS.D.T-STATH0: parameter = 02-tail p-value1-tail p-value
(Intercept)-0.08218085287033870.022579-3.63970.0007010.000351
benzine0.9451068899847050.03120730.285600
M1-0.001091774109608750.019339-0.05650.9552290.477614
M2-0.005248187431312630.019327-0.27150.787210.393605
M3-0.02160784348428630.019369-1.11560.2705080.135254
M4-0.04796090902170050.019621-2.44440.018490.009245
M5-0.06914647776358790.019874-3.47920.0011280.000564
M6-0.0582744750417580.019983-2.91630.0055070.002753
M7-0.04249834016800990.019923-2.13310.0384030.019202
M8-0.03031609651898340.0197-1.53890.1308310.065415
M9-0.01638414457077080.019471-0.84150.4045440.202272
M10-0.00940903138164780.019393-0.48520.6299040.314952
M11-0.004365864372269470.019381-0.22530.8227910.411395
t0.000485294615012240.0002242.16760.0355220.017761


Multiple Linear Regression - Regression Statistics
Multiple R0.978985184238817
R-squared0.958411990959111
Adjusted R-squared0.946397677236188
F-TEST (value)79.7725124432574
F-TEST (DF numerator)13
F-TEST (DF denominator)45
p-value0
Multiple Linear Regression - Residual Statistics
Residual Standard Deviation0.0287798049466305
Sum Squared Residuals0.0372724727744743

\begin{tabular}{lllllllll}
\hline
Multiple Linear Regression - Regression Statistics \tabularnewline
Multiple R & 0.978985184238817 \tabularnewline
R-squared & 0.958411990959111 \tabularnewline
Adjusted R-squared & 0.946397677236188 \tabularnewline
F-TEST (value) & 79.7725124432574 \tabularnewline
F-TEST (DF numerator) & 13 \tabularnewline
F-TEST (DF denominator) & 45 \tabularnewline
p-value & 0 \tabularnewline
Multiple Linear Regression - Residual Statistics \tabularnewline
Residual Standard Deviation & 0.0287798049466305 \tabularnewline
Sum Squared Residuals & 0.0372724727744743 \tabularnewline
\hline
\end{tabular}
%Source: https://freestatistics.org/blog/index.php?pk=112801&T=3

[TABLE]
[ROW][C]Multiple Linear Regression - Regression Statistics[/C][/ROW]
[ROW][C]Multiple R[/C][C]0.978985184238817[/C][/ROW]
[ROW][C]R-squared[/C][C]0.958411990959111[/C][/ROW]
[ROW][C]Adjusted R-squared[/C][C]0.946397677236188[/C][/ROW]
[ROW][C]F-TEST (value)[/C][C]79.7725124432574[/C][/ROW]
[ROW][C]F-TEST (DF numerator)[/C][C]13[/C][/ROW]
[ROW][C]F-TEST (DF denominator)[/C][C]45[/C][/ROW]
[ROW][C]p-value[/C][C]0[/C][/ROW]
[ROW][C]Multiple Linear Regression - Residual Statistics[/C][/ROW]
[ROW][C]Residual Standard Deviation[/C][C]0.0287798049466305[/C][/ROW]
[ROW][C]Sum Squared Residuals[/C][C]0.0372724727744743[/C][/ROW]
[/TABLE]
Source: https://freestatistics.org/blog/index.php?pk=112801&T=3

Globally Unique Identifier (entire table): ba.freestatistics.org/blog/index.php?pk=112801&T=3

As an alternative you can also use a QR Code:  

The GUIDs for individual cells are displayed in the table below:

Multiple Linear Regression - Regression Statistics
Multiple R0.978985184238817
R-squared0.958411990959111
Adjusted R-squared0.946397677236188
F-TEST (value)79.7725124432574
F-TEST (DF numerator)13
F-TEST (DF denominator)45
p-value0
Multiple Linear Regression - Residual Statistics
Residual Standard Deviation0.0287798049466305
Sum Squared Residuals0.0372724727744743


Multiple Linear Regression - Actuals, Interpolation, and Residuals
Time or IndexActualsInterpolationForecastResidualsPrediction Error
10.3972327040.3937436923199280.00348901168007235
20.3827672960.3463719112775180.0363953847224817
30.3960377360.3795989612308240.0164387747691764
40.4417610060.445122257252934-0.003361251252934
50.4452201260.4429353644380540.00228476156194571
60.4384905660.45469001400976-0.0161994480097595
70.4674842770.518301260882478-0.0508169838824781
80.4657861640.470846938621163-0.00506077462116303
90.4020754720.3653286143449460.0367468576550537
100.3761635220.3409521703551940.0352113516448055
110.375911950.360298766682160.0156131833178398
120.3929559750.3911156921835510.00184028281644867
130.344905660.3431999422807910.00170571771920913
140.3685534590.371941431650044-0.00338797265004419
150.3908805030.418062163781914-0.0271816607819135
160.4248427670.471340516006669-0.0464977490066694
170.4268553460.49258120024598-0.0657258542459803
180.4423270440.485157511145142-0.0428304671451417
190.4748427670.494542310768739-0.0196995437687391
200.4476100630.4419061876395430.00570387536045662
210.4807547170.496018134340962-0.0152634173409623
220.5160377360.523857047484454-0.00781931148445382
230.5806289310.613129567824709-0.0325006368247089
240.5735220130.585989798967364-0.0124677859673639
250.5788679250.580769165869829-0.00190124086982872
260.5935849060.598336130054255-0.004751224054255
270.6459748430.627914024959320.0180608180406804
280.6905031450.6752726368564950.0152305081435054
290.7822012580.7198516961263990.0623495618736011
300.8390566040.7965450918700470.0425115121299535
310.8474842770.7996209070032090.0478633699967908
320.7268553460.6946477877036020.0322075582963985
330.6355345910.642950450369633-0.00741585936963354
340.4709433960.473078129333203-0.002134733333203
350.3461635220.2968948766262030.0492686453737968
360.2723270440.2483791668612320.0239478771387676
370.2867924530.2609826297186890.0258098232813112
380.276729560.290316093404232-0.0135865334042323
390.2974213840.2930280963225250.00439328767747539
400.3216981130.2916421020875020.0300560109124979
410.3655974840.3639790697997250.00161841420027471
420.4352201260.444264855581587-0.00904472958158742
430.4128930820.4079541207878220.00493896121217841
440.4586792450.490134012796054-0.0314547677960544
450.4284276730.441120831955629-0.0126931589556288
460.4635220130.473736082824808-0.0102140698248081
470.4871698110.506576444663744-0.0194066336637442
480.4735849060.486905279987852-0.0133203739878523
490.4918867920.520990103810764-0.0291033118107639
500.4748427670.48951242161395-0.0146696546139501
510.5023270440.514038263705419-0.0117112197054186
520.5393710690.53479858779640.00457248120360015
530.4844025160.484929399389841-0.000526883389841208
540.4746540880.4490909553934650.0255631326065351
550.4735220130.4558078165577520.017714196442248
560.487547170.488943061239638-0.00139589123963766
570.4933333330.494707754988829-0.00137442198882909
580.5251572330.54020047000234-0.0150432370023405
590.5427044030.555678961203183-0.0129745582031835

\begin{tabular}{lllllllll}
\hline
Multiple Linear Regression - Actuals, Interpolation, and Residuals \tabularnewline
Time or Index & Actuals & InterpolationForecast & ResidualsPrediction Error \tabularnewline
1 & 0.397232704 & 0.393743692319928 & 0.00348901168007235 \tabularnewline
2 & 0.382767296 & 0.346371911277518 & 0.0363953847224817 \tabularnewline
3 & 0.396037736 & 0.379598961230824 & 0.0164387747691764 \tabularnewline
4 & 0.441761006 & 0.445122257252934 & -0.003361251252934 \tabularnewline
5 & 0.445220126 & 0.442935364438054 & 0.00228476156194571 \tabularnewline
6 & 0.438490566 & 0.45469001400976 & -0.0161994480097595 \tabularnewline
7 & 0.467484277 & 0.518301260882478 & -0.0508169838824781 \tabularnewline
8 & 0.465786164 & 0.470846938621163 & -0.00506077462116303 \tabularnewline
9 & 0.402075472 & 0.365328614344946 & 0.0367468576550537 \tabularnewline
10 & 0.376163522 & 0.340952170355194 & 0.0352113516448055 \tabularnewline
11 & 0.37591195 & 0.36029876668216 & 0.0156131833178398 \tabularnewline
12 & 0.392955975 & 0.391115692183551 & 0.00184028281644867 \tabularnewline
13 & 0.34490566 & 0.343199942280791 & 0.00170571771920913 \tabularnewline
14 & 0.368553459 & 0.371941431650044 & -0.00338797265004419 \tabularnewline
15 & 0.390880503 & 0.418062163781914 & -0.0271816607819135 \tabularnewline
16 & 0.424842767 & 0.471340516006669 & -0.0464977490066694 \tabularnewline
17 & 0.426855346 & 0.49258120024598 & -0.0657258542459803 \tabularnewline
18 & 0.442327044 & 0.485157511145142 & -0.0428304671451417 \tabularnewline
19 & 0.474842767 & 0.494542310768739 & -0.0196995437687391 \tabularnewline
20 & 0.447610063 & 0.441906187639543 & 0.00570387536045662 \tabularnewline
21 & 0.480754717 & 0.496018134340962 & -0.0152634173409623 \tabularnewline
22 & 0.516037736 & 0.523857047484454 & -0.00781931148445382 \tabularnewline
23 & 0.580628931 & 0.613129567824709 & -0.0325006368247089 \tabularnewline
24 & 0.573522013 & 0.585989798967364 & -0.0124677859673639 \tabularnewline
25 & 0.578867925 & 0.580769165869829 & -0.00190124086982872 \tabularnewline
26 & 0.593584906 & 0.598336130054255 & -0.004751224054255 \tabularnewline
27 & 0.645974843 & 0.62791402495932 & 0.0180608180406804 \tabularnewline
28 & 0.690503145 & 0.675272636856495 & 0.0152305081435054 \tabularnewline
29 & 0.782201258 & 0.719851696126399 & 0.0623495618736011 \tabularnewline
30 & 0.839056604 & 0.796545091870047 & 0.0425115121299535 \tabularnewline
31 & 0.847484277 & 0.799620907003209 & 0.0478633699967908 \tabularnewline
32 & 0.726855346 & 0.694647787703602 & 0.0322075582963985 \tabularnewline
33 & 0.635534591 & 0.642950450369633 & -0.00741585936963354 \tabularnewline
34 & 0.470943396 & 0.473078129333203 & -0.002134733333203 \tabularnewline
35 & 0.346163522 & 0.296894876626203 & 0.0492686453737968 \tabularnewline
36 & 0.272327044 & 0.248379166861232 & 0.0239478771387676 \tabularnewline
37 & 0.286792453 & 0.260982629718689 & 0.0258098232813112 \tabularnewline
38 & 0.27672956 & 0.290316093404232 & -0.0135865334042323 \tabularnewline
39 & 0.297421384 & 0.293028096322525 & 0.00439328767747539 \tabularnewline
40 & 0.321698113 & 0.291642102087502 & 0.0300560109124979 \tabularnewline
41 & 0.365597484 & 0.363979069799725 & 0.00161841420027471 \tabularnewline
42 & 0.435220126 & 0.444264855581587 & -0.00904472958158742 \tabularnewline
43 & 0.412893082 & 0.407954120787822 & 0.00493896121217841 \tabularnewline
44 & 0.458679245 & 0.490134012796054 & -0.0314547677960544 \tabularnewline
45 & 0.428427673 & 0.441120831955629 & -0.0126931589556288 \tabularnewline
46 & 0.463522013 & 0.473736082824808 & -0.0102140698248081 \tabularnewline
47 & 0.487169811 & 0.506576444663744 & -0.0194066336637442 \tabularnewline
48 & 0.473584906 & 0.486905279987852 & -0.0133203739878523 \tabularnewline
49 & 0.491886792 & 0.520990103810764 & -0.0291033118107639 \tabularnewline
50 & 0.474842767 & 0.48951242161395 & -0.0146696546139501 \tabularnewline
51 & 0.502327044 & 0.514038263705419 & -0.0117112197054186 \tabularnewline
52 & 0.539371069 & 0.5347985877964 & 0.00457248120360015 \tabularnewline
53 & 0.484402516 & 0.484929399389841 & -0.000526883389841208 \tabularnewline
54 & 0.474654088 & 0.449090955393465 & 0.0255631326065351 \tabularnewline
55 & 0.473522013 & 0.455807816557752 & 0.017714196442248 \tabularnewline
56 & 0.48754717 & 0.488943061239638 & -0.00139589123963766 \tabularnewline
57 & 0.493333333 & 0.494707754988829 & -0.00137442198882909 \tabularnewline
58 & 0.525157233 & 0.54020047000234 & -0.0150432370023405 \tabularnewline
59 & 0.542704403 & 0.555678961203183 & -0.0129745582031835 \tabularnewline
\hline
\end{tabular}
%Source: https://freestatistics.org/blog/index.php?pk=112801&T=4

[TABLE]
[ROW][C]Multiple Linear Regression - Actuals, Interpolation, and Residuals[/C][/ROW]
[ROW][C]Time or Index[/C][C]Actuals[/C][C]InterpolationForecast[/C][C]ResidualsPrediction Error[/C][/ROW]
[ROW][C]1[/C][C]0.397232704[/C][C]0.393743692319928[/C][C]0.00348901168007235[/C][/ROW]
[ROW][C]2[/C][C]0.382767296[/C][C]0.346371911277518[/C][C]0.0363953847224817[/C][/ROW]
[ROW][C]3[/C][C]0.396037736[/C][C]0.379598961230824[/C][C]0.0164387747691764[/C][/ROW]
[ROW][C]4[/C][C]0.441761006[/C][C]0.445122257252934[/C][C]-0.003361251252934[/C][/ROW]
[ROW][C]5[/C][C]0.445220126[/C][C]0.442935364438054[/C][C]0.00228476156194571[/C][/ROW]
[ROW][C]6[/C][C]0.438490566[/C][C]0.45469001400976[/C][C]-0.0161994480097595[/C][/ROW]
[ROW][C]7[/C][C]0.467484277[/C][C]0.518301260882478[/C][C]-0.0508169838824781[/C][/ROW]
[ROW][C]8[/C][C]0.465786164[/C][C]0.470846938621163[/C][C]-0.00506077462116303[/C][/ROW]
[ROW][C]9[/C][C]0.402075472[/C][C]0.365328614344946[/C][C]0.0367468576550537[/C][/ROW]
[ROW][C]10[/C][C]0.376163522[/C][C]0.340952170355194[/C][C]0.0352113516448055[/C][/ROW]
[ROW][C]11[/C][C]0.37591195[/C][C]0.36029876668216[/C][C]0.0156131833178398[/C][/ROW]
[ROW][C]12[/C][C]0.392955975[/C][C]0.391115692183551[/C][C]0.00184028281644867[/C][/ROW]
[ROW][C]13[/C][C]0.34490566[/C][C]0.343199942280791[/C][C]0.00170571771920913[/C][/ROW]
[ROW][C]14[/C][C]0.368553459[/C][C]0.371941431650044[/C][C]-0.00338797265004419[/C][/ROW]
[ROW][C]15[/C][C]0.390880503[/C][C]0.418062163781914[/C][C]-0.0271816607819135[/C][/ROW]
[ROW][C]16[/C][C]0.424842767[/C][C]0.471340516006669[/C][C]-0.0464977490066694[/C][/ROW]
[ROW][C]17[/C][C]0.426855346[/C][C]0.49258120024598[/C][C]-0.0657258542459803[/C][/ROW]
[ROW][C]18[/C][C]0.442327044[/C][C]0.485157511145142[/C][C]-0.0428304671451417[/C][/ROW]
[ROW][C]19[/C][C]0.474842767[/C][C]0.494542310768739[/C][C]-0.0196995437687391[/C][/ROW]
[ROW][C]20[/C][C]0.447610063[/C][C]0.441906187639543[/C][C]0.00570387536045662[/C][/ROW]
[ROW][C]21[/C][C]0.480754717[/C][C]0.496018134340962[/C][C]-0.0152634173409623[/C][/ROW]
[ROW][C]22[/C][C]0.516037736[/C][C]0.523857047484454[/C][C]-0.00781931148445382[/C][/ROW]
[ROW][C]23[/C][C]0.580628931[/C][C]0.613129567824709[/C][C]-0.0325006368247089[/C][/ROW]
[ROW][C]24[/C][C]0.573522013[/C][C]0.585989798967364[/C][C]-0.0124677859673639[/C][/ROW]
[ROW][C]25[/C][C]0.578867925[/C][C]0.580769165869829[/C][C]-0.00190124086982872[/C][/ROW]
[ROW][C]26[/C][C]0.593584906[/C][C]0.598336130054255[/C][C]-0.004751224054255[/C][/ROW]
[ROW][C]27[/C][C]0.645974843[/C][C]0.62791402495932[/C][C]0.0180608180406804[/C][/ROW]
[ROW][C]28[/C][C]0.690503145[/C][C]0.675272636856495[/C][C]0.0152305081435054[/C][/ROW]
[ROW][C]29[/C][C]0.782201258[/C][C]0.719851696126399[/C][C]0.0623495618736011[/C][/ROW]
[ROW][C]30[/C][C]0.839056604[/C][C]0.796545091870047[/C][C]0.0425115121299535[/C][/ROW]
[ROW][C]31[/C][C]0.847484277[/C][C]0.799620907003209[/C][C]0.0478633699967908[/C][/ROW]
[ROW][C]32[/C][C]0.726855346[/C][C]0.694647787703602[/C][C]0.0322075582963985[/C][/ROW]
[ROW][C]33[/C][C]0.635534591[/C][C]0.642950450369633[/C][C]-0.00741585936963354[/C][/ROW]
[ROW][C]34[/C][C]0.470943396[/C][C]0.473078129333203[/C][C]-0.002134733333203[/C][/ROW]
[ROW][C]35[/C][C]0.346163522[/C][C]0.296894876626203[/C][C]0.0492686453737968[/C][/ROW]
[ROW][C]36[/C][C]0.272327044[/C][C]0.248379166861232[/C][C]0.0239478771387676[/C][/ROW]
[ROW][C]37[/C][C]0.286792453[/C][C]0.260982629718689[/C][C]0.0258098232813112[/C][/ROW]
[ROW][C]38[/C][C]0.27672956[/C][C]0.290316093404232[/C][C]-0.0135865334042323[/C][/ROW]
[ROW][C]39[/C][C]0.297421384[/C][C]0.293028096322525[/C][C]0.00439328767747539[/C][/ROW]
[ROW][C]40[/C][C]0.321698113[/C][C]0.291642102087502[/C][C]0.0300560109124979[/C][/ROW]
[ROW][C]41[/C][C]0.365597484[/C][C]0.363979069799725[/C][C]0.00161841420027471[/C][/ROW]
[ROW][C]42[/C][C]0.435220126[/C][C]0.444264855581587[/C][C]-0.00904472958158742[/C][/ROW]
[ROW][C]43[/C][C]0.412893082[/C][C]0.407954120787822[/C][C]0.00493896121217841[/C][/ROW]
[ROW][C]44[/C][C]0.458679245[/C][C]0.490134012796054[/C][C]-0.0314547677960544[/C][/ROW]
[ROW][C]45[/C][C]0.428427673[/C][C]0.441120831955629[/C][C]-0.0126931589556288[/C][/ROW]
[ROW][C]46[/C][C]0.463522013[/C][C]0.473736082824808[/C][C]-0.0102140698248081[/C][/ROW]
[ROW][C]47[/C][C]0.487169811[/C][C]0.506576444663744[/C][C]-0.0194066336637442[/C][/ROW]
[ROW][C]48[/C][C]0.473584906[/C][C]0.486905279987852[/C][C]-0.0133203739878523[/C][/ROW]
[ROW][C]49[/C][C]0.491886792[/C][C]0.520990103810764[/C][C]-0.0291033118107639[/C][/ROW]
[ROW][C]50[/C][C]0.474842767[/C][C]0.48951242161395[/C][C]-0.0146696546139501[/C][/ROW]
[ROW][C]51[/C][C]0.502327044[/C][C]0.514038263705419[/C][C]-0.0117112197054186[/C][/ROW]
[ROW][C]52[/C][C]0.539371069[/C][C]0.5347985877964[/C][C]0.00457248120360015[/C][/ROW]
[ROW][C]53[/C][C]0.484402516[/C][C]0.484929399389841[/C][C]-0.000526883389841208[/C][/ROW]
[ROW][C]54[/C][C]0.474654088[/C][C]0.449090955393465[/C][C]0.0255631326065351[/C][/ROW]
[ROW][C]55[/C][C]0.473522013[/C][C]0.455807816557752[/C][C]0.017714196442248[/C][/ROW]
[ROW][C]56[/C][C]0.48754717[/C][C]0.488943061239638[/C][C]-0.00139589123963766[/C][/ROW]
[ROW][C]57[/C][C]0.493333333[/C][C]0.494707754988829[/C][C]-0.00137442198882909[/C][/ROW]
[ROW][C]58[/C][C]0.525157233[/C][C]0.54020047000234[/C][C]-0.0150432370023405[/C][/ROW]
[ROW][C]59[/C][C]0.542704403[/C][C]0.555678961203183[/C][C]-0.0129745582031835[/C][/ROW]
[/TABLE]
Source: https://freestatistics.org/blog/index.php?pk=112801&T=4

Globally Unique Identifier (entire table): ba.freestatistics.org/blog/index.php?pk=112801&T=4

As an alternative you can also use a QR Code:  

The GUIDs for individual cells are displayed in the table below:

Multiple Linear Regression - Actuals, Interpolation, and Residuals
Time or IndexActualsInterpolationForecastResidualsPrediction Error
10.3972327040.3937436923199280.00348901168007235
20.3827672960.3463719112775180.0363953847224817
30.3960377360.3795989612308240.0164387747691764
40.4417610060.445122257252934-0.003361251252934
50.4452201260.4429353644380540.00228476156194571
60.4384905660.45469001400976-0.0161994480097595
70.4674842770.518301260882478-0.0508169838824781
80.4657861640.470846938621163-0.00506077462116303
90.4020754720.3653286143449460.0367468576550537
100.3761635220.3409521703551940.0352113516448055
110.375911950.360298766682160.0156131833178398
120.3929559750.3911156921835510.00184028281644867
130.344905660.3431999422807910.00170571771920913
140.3685534590.371941431650044-0.00338797265004419
150.3908805030.418062163781914-0.0271816607819135
160.4248427670.471340516006669-0.0464977490066694
170.4268553460.49258120024598-0.0657258542459803
180.4423270440.485157511145142-0.0428304671451417
190.4748427670.494542310768739-0.0196995437687391
200.4476100630.4419061876395430.00570387536045662
210.4807547170.496018134340962-0.0152634173409623
220.5160377360.523857047484454-0.00781931148445382
230.5806289310.613129567824709-0.0325006368247089
240.5735220130.585989798967364-0.0124677859673639
250.5788679250.580769165869829-0.00190124086982872
260.5935849060.598336130054255-0.004751224054255
270.6459748430.627914024959320.0180608180406804
280.6905031450.6752726368564950.0152305081435054
290.7822012580.7198516961263990.0623495618736011
300.8390566040.7965450918700470.0425115121299535
310.8474842770.7996209070032090.0478633699967908
320.7268553460.6946477877036020.0322075582963985
330.6355345910.642950450369633-0.00741585936963354
340.4709433960.473078129333203-0.002134733333203
350.3461635220.2968948766262030.0492686453737968
360.2723270440.2483791668612320.0239478771387676
370.2867924530.2609826297186890.0258098232813112
380.276729560.290316093404232-0.0135865334042323
390.2974213840.2930280963225250.00439328767747539
400.3216981130.2916421020875020.0300560109124979
410.3655974840.3639790697997250.00161841420027471
420.4352201260.444264855581587-0.00904472958158742
430.4128930820.4079541207878220.00493896121217841
440.4586792450.490134012796054-0.0314547677960544
450.4284276730.441120831955629-0.0126931589556288
460.4635220130.473736082824808-0.0102140698248081
470.4871698110.506576444663744-0.0194066336637442
480.4735849060.486905279987852-0.0133203739878523
490.4918867920.520990103810764-0.0291033118107639
500.4748427670.48951242161395-0.0146696546139501
510.5023270440.514038263705419-0.0117112197054186
520.5393710690.53479858779640.00457248120360015
530.4844025160.484929399389841-0.000526883389841208
540.4746540880.4490909553934650.0255631326065351
550.4735220130.4558078165577520.017714196442248
560.487547170.488943061239638-0.00139589123963766
570.4933333330.494707754988829-0.00137442198882909
580.5251572330.54020047000234-0.0150432370023405
590.5427044030.555678961203183-0.0129745582031835


Goldfeld-Quandt test for Heteroskedasticity
p-valuesAlternative Hypothesis
breakpoint indexgreater2-sidedless
170.01376114985422590.02752229970845180.986238850145774
180.02357012933760890.04714025867521780.976429870662391
190.1395792442647160.2791584885294320.860420755735284
200.0727682287481720.1455364574963440.927231771251828
210.1636583042924350.3273166085848710.836341695707565
220.2233845343260350.446769068652070.776615465673965
230.3258496209980190.6516992419960370.674150379001981
240.4139246107666970.8278492215333940.586075389233303
250.5632970201433880.8734059597132240.436702979856612
260.5072945979027980.9854108041944030.492705402097202
270.6510980768980520.6978038462038970.348901923101948
280.7913212225478450.4173575549043110.208678777452155
290.9646002238883630.07079955222327430.0353997761116371
300.9658531390004050.06829372199919010.034146860999595
310.9762233795875370.04755324082492690.0237766204124635
320.995592912349190.008814175301620480.00440708765081024
330.997972323556010.004055352887979090.00202767644398954
340.998267247573830.003465504852339670.00173275242616984
350.9999799180626714.0163874657696e-052.0081937328848e-05
360.9999297822772160.0001404354455676337.02177227838166e-05
370.9999742586474765.1482705047426e-052.5741352523713e-05
380.9999608070240967.83859518072013e-053.91929759036007e-05
390.9998301575129650.0003396849740698430.000169842487034921
400.9995863023883420.0008273952233150660.000413697611657533
410.9997578766818050.0004842466363900090.000242123318195004
420.9982452101012080.00350957979758370.00175478989879185

\begin{tabular}{lllllllll}
\hline
Goldfeld-Quandt test for Heteroskedasticity \tabularnewline
p-values & Alternative Hypothesis \tabularnewline
breakpoint index & greater & 2-sided & less \tabularnewline
17 & 0.0137611498542259 & 0.0275222997084518 & 0.986238850145774 \tabularnewline
18 & 0.0235701293376089 & 0.0471402586752178 & 0.976429870662391 \tabularnewline
19 & 0.139579244264716 & 0.279158488529432 & 0.860420755735284 \tabularnewline
20 & 0.072768228748172 & 0.145536457496344 & 0.927231771251828 \tabularnewline
21 & 0.163658304292435 & 0.327316608584871 & 0.836341695707565 \tabularnewline
22 & 0.223384534326035 & 0.44676906865207 & 0.776615465673965 \tabularnewline
23 & 0.325849620998019 & 0.651699241996037 & 0.674150379001981 \tabularnewline
24 & 0.413924610766697 & 0.827849221533394 & 0.586075389233303 \tabularnewline
25 & 0.563297020143388 & 0.873405959713224 & 0.436702979856612 \tabularnewline
26 & 0.507294597902798 & 0.985410804194403 & 0.492705402097202 \tabularnewline
27 & 0.651098076898052 & 0.697803846203897 & 0.348901923101948 \tabularnewline
28 & 0.791321222547845 & 0.417357554904311 & 0.208678777452155 \tabularnewline
29 & 0.964600223888363 & 0.0707995522232743 & 0.0353997761116371 \tabularnewline
30 & 0.965853139000405 & 0.0682937219991901 & 0.034146860999595 \tabularnewline
31 & 0.976223379587537 & 0.0475532408249269 & 0.0237766204124635 \tabularnewline
32 & 0.99559291234919 & 0.00881417530162048 & 0.00440708765081024 \tabularnewline
33 & 0.99797232355601 & 0.00405535288797909 & 0.00202767644398954 \tabularnewline
34 & 0.99826724757383 & 0.00346550485233967 & 0.00173275242616984 \tabularnewline
35 & 0.999979918062671 & 4.0163874657696e-05 & 2.0081937328848e-05 \tabularnewline
36 & 0.999929782277216 & 0.000140435445567633 & 7.02177227838166e-05 \tabularnewline
37 & 0.999974258647476 & 5.1482705047426e-05 & 2.5741352523713e-05 \tabularnewline
38 & 0.999960807024096 & 7.83859518072013e-05 & 3.91929759036007e-05 \tabularnewline
39 & 0.999830157512965 & 0.000339684974069843 & 0.000169842487034921 \tabularnewline
40 & 0.999586302388342 & 0.000827395223315066 & 0.000413697611657533 \tabularnewline
41 & 0.999757876681805 & 0.000484246636390009 & 0.000242123318195004 \tabularnewline
42 & 0.998245210101208 & 0.0035095797975837 & 0.00175478989879185 \tabularnewline
\hline
\end{tabular}
%Source: https://freestatistics.org/blog/index.php?pk=112801&T=5

[TABLE]
[ROW][C]Goldfeld-Quandt test for Heteroskedasticity[/C][/ROW]
[ROW][C]p-values[/C][C]Alternative Hypothesis[/C][/ROW]
[ROW][C]breakpoint index[/C][C]greater[/C][C]2-sided[/C][C]less[/C][/ROW]
[ROW][C]17[/C][C]0.0137611498542259[/C][C]0.0275222997084518[/C][C]0.986238850145774[/C][/ROW]
[ROW][C]18[/C][C]0.0235701293376089[/C][C]0.0471402586752178[/C][C]0.976429870662391[/C][/ROW]
[ROW][C]19[/C][C]0.139579244264716[/C][C]0.279158488529432[/C][C]0.860420755735284[/C][/ROW]
[ROW][C]20[/C][C]0.072768228748172[/C][C]0.145536457496344[/C][C]0.927231771251828[/C][/ROW]
[ROW][C]21[/C][C]0.163658304292435[/C][C]0.327316608584871[/C][C]0.836341695707565[/C][/ROW]
[ROW][C]22[/C][C]0.223384534326035[/C][C]0.44676906865207[/C][C]0.776615465673965[/C][/ROW]
[ROW][C]23[/C][C]0.325849620998019[/C][C]0.651699241996037[/C][C]0.674150379001981[/C][/ROW]
[ROW][C]24[/C][C]0.413924610766697[/C][C]0.827849221533394[/C][C]0.586075389233303[/C][/ROW]
[ROW][C]25[/C][C]0.563297020143388[/C][C]0.873405959713224[/C][C]0.436702979856612[/C][/ROW]
[ROW][C]26[/C][C]0.507294597902798[/C][C]0.985410804194403[/C][C]0.492705402097202[/C][/ROW]
[ROW][C]27[/C][C]0.651098076898052[/C][C]0.697803846203897[/C][C]0.348901923101948[/C][/ROW]
[ROW][C]28[/C][C]0.791321222547845[/C][C]0.417357554904311[/C][C]0.208678777452155[/C][/ROW]
[ROW][C]29[/C][C]0.964600223888363[/C][C]0.0707995522232743[/C][C]0.0353997761116371[/C][/ROW]
[ROW][C]30[/C][C]0.965853139000405[/C][C]0.0682937219991901[/C][C]0.034146860999595[/C][/ROW]
[ROW][C]31[/C][C]0.976223379587537[/C][C]0.0475532408249269[/C][C]0.0237766204124635[/C][/ROW]
[ROW][C]32[/C][C]0.99559291234919[/C][C]0.00881417530162048[/C][C]0.00440708765081024[/C][/ROW]
[ROW][C]33[/C][C]0.99797232355601[/C][C]0.00405535288797909[/C][C]0.00202767644398954[/C][/ROW]
[ROW][C]34[/C][C]0.99826724757383[/C][C]0.00346550485233967[/C][C]0.00173275242616984[/C][/ROW]
[ROW][C]35[/C][C]0.999979918062671[/C][C]4.0163874657696e-05[/C][C]2.0081937328848e-05[/C][/ROW]
[ROW][C]36[/C][C]0.999929782277216[/C][C]0.000140435445567633[/C][C]7.02177227838166e-05[/C][/ROW]
[ROW][C]37[/C][C]0.999974258647476[/C][C]5.1482705047426e-05[/C][C]2.5741352523713e-05[/C][/ROW]
[ROW][C]38[/C][C]0.999960807024096[/C][C]7.83859518072013e-05[/C][C]3.91929759036007e-05[/C][/ROW]
[ROW][C]39[/C][C]0.999830157512965[/C][C]0.000339684974069843[/C][C]0.000169842487034921[/C][/ROW]
[ROW][C]40[/C][C]0.999586302388342[/C][C]0.000827395223315066[/C][C]0.000413697611657533[/C][/ROW]
[ROW][C]41[/C][C]0.999757876681805[/C][C]0.000484246636390009[/C][C]0.000242123318195004[/C][/ROW]
[ROW][C]42[/C][C]0.998245210101208[/C][C]0.0035095797975837[/C][C]0.00175478989879185[/C][/ROW]
[/TABLE]
Source: https://freestatistics.org/blog/index.php?pk=112801&T=5

Globally Unique Identifier (entire table): ba.freestatistics.org/blog/index.php?pk=112801&T=5

As an alternative you can also use a QR Code:  

The GUIDs for individual cells are displayed in the table below:

Goldfeld-Quandt test for Heteroskedasticity
p-valuesAlternative Hypothesis
breakpoint indexgreater2-sidedless
170.01376114985422590.02752229970845180.986238850145774
180.02357012933760890.04714025867521780.976429870662391
190.1395792442647160.2791584885294320.860420755735284
200.0727682287481720.1455364574963440.927231771251828
210.1636583042924350.3273166085848710.836341695707565
220.2233845343260350.446769068652070.776615465673965
230.3258496209980190.6516992419960370.674150379001981
240.4139246107666970.8278492215333940.586075389233303
250.5632970201433880.8734059597132240.436702979856612
260.5072945979027980.9854108041944030.492705402097202
270.6510980768980520.6978038462038970.348901923101948
280.7913212225478450.4173575549043110.208678777452155
290.9646002238883630.07079955222327430.0353997761116371
300.9658531390004050.06829372199919010.034146860999595
310.9762233795875370.04755324082492690.0237766204124635
320.995592912349190.008814175301620480.00440708765081024
330.997972323556010.004055352887979090.00202767644398954
340.998267247573830.003465504852339670.00173275242616984
350.9999799180626714.0163874657696e-052.0081937328848e-05
360.9999297822772160.0001404354455676337.02177227838166e-05
370.9999742586474765.1482705047426e-052.5741352523713e-05
380.9999608070240967.83859518072013e-053.91929759036007e-05
390.9998301575129650.0003396849740698430.000169842487034921
400.9995863023883420.0008273952233150660.000413697611657533
410.9997578766818050.0004842466363900090.000242123318195004
420.9982452101012080.00350957979758370.00175478989879185


Meta Analysis of Goldfeld-Quandt test for Heteroskedasticity
Description# significant tests% significant testsOK/NOK
1% type I error level110.423076923076923NOK
5% type I error level140.538461538461538NOK
10% type I error level160.615384615384615NOK

\begin{tabular}{lllllllll}
\hline
Meta Analysis of Goldfeld-Quandt test for Heteroskedasticity \tabularnewline
Description & # significant tests & % significant tests & OK/NOK \tabularnewline
1% type I error level & 11 & 0.423076923076923 & NOK \tabularnewline
5% type I error level & 14 & 0.538461538461538 & NOK \tabularnewline
10% type I error level & 16 & 0.615384615384615 & NOK \tabularnewline
\hline
\end{tabular}
%Source: https://freestatistics.org/blog/index.php?pk=112801&T=6

[TABLE]
[ROW][C]Meta Analysis of Goldfeld-Quandt test for Heteroskedasticity[/C][/ROW]
[ROW][C]Description[/C][C]# significant tests[/C][C]% significant tests[/C][C]OK/NOK[/C][/ROW]
[ROW][C]1% type I error level[/C][C]11[/C][C]0.423076923076923[/C][C]NOK[/C][/ROW]
[ROW][C]5% type I error level[/C][C]14[/C][C]0.538461538461538[/C][C]NOK[/C][/ROW]
[ROW][C]10% type I error level[/C][C]16[/C][C]0.615384615384615[/C][C]NOK[/C][/ROW]
[/TABLE]
Source: https://freestatistics.org/blog/index.php?pk=112801&T=6

Globally Unique Identifier (entire table): ba.freestatistics.org/blog/index.php?pk=112801&T=6

As an alternative you can also use a QR Code:  

The GUIDs for individual cells are displayed in the table below:

Meta Analysis of Goldfeld-Quandt test for Heteroskedasticity
Description# significant tests% significant testsOK/NOK
1% type I error level110.423076923076923NOK
5% type I error level140.538461538461538NOK
10% type I error level160.615384615384615NOK


Parameters (Session):
par1 = 2 ; par2 = Include Monthly Dummies ; par3 = Linear Trend ;
Parameters (R input):
par1 = 2 ; par2 = Include Monthly Dummies ; par3 = Linear Trend ;
R code (references can be found in the software module):
library(lattice)
library(lmtest)
n25 <- 25 #minimum number of obs. for Goldfeld-Quandt test
par1 <- as.numeric(par1)
x <- t(y)
k <- length(x[1,])
n <- length(x[,1])
x1 <- cbind(x[,par1], x[,1:k!=par1])
mycolnames <- c(colnames(x)[par1], colnames(x)[1:k!=par1])
colnames(x1) <- mycolnames #colnames(x)[par1]
x <- x1
if (par3 == 'First Differences'){
x2 <- array(0, dim=c(n-1,k), dimnames=list(1:(n-1), paste('(1-B)',colnames(x),sep='')))
for (i in 1:n-1) {
for (j in 1:k) {
x2[i,j] <- x[i+1,j] - x[i,j]
}
}
x <- x2
}
if (par2 == 'Include Monthly Dummies'){
x2 <- array(0, dim=c(n,11), dimnames=list(1:n, paste('M', seq(1:11), sep ='')))
for (i in 1:11){
x2[seq(i,n,12),i] <- 1
}
x <- cbind(x, x2)
}
if (par2 == 'Include Quarterly Dummies'){
x2 <- array(0, dim=c(n,3), dimnames=list(1:n, paste('Q', seq(1:3), sep ='')))
for (i in 1:3){
x2[seq(i,n,4),i] <- 1
}
x <- cbind(x, x2)
}
k <- length(x[1,])
if (par3 == 'Linear Trend'){
x <- cbind(x, c(1:n))
colnames(x)[k+1] <- 't'
}
x
k <- length(x[1,])
df <- as.data.frame(x)
(mylm <- lm(df))
(mysum <- summary(mylm))
if (n > n25) {
kp3 <- k + 3
nmkm3 <- n - k - 3
gqarr <- array(NA, dim=c(nmkm3-kp3+1,3))
numgqtests <- 0
numsignificant1 <- 0
numsignificant5 <- 0
numsignificant10 <- 0
for (mypoint in kp3:nmkm3) {
j <- 0
numgqtests <- numgqtests + 1
for (myalt in c('greater', 'two.sided', 'less')) {
j <- j + 1
gqarr[mypoint-kp3+1,j] <- gqtest(mylm, point=mypoint, alternative=myalt)$p.value
}
if (gqarr[mypoint-kp3+1,2] < 0.01) numsignificant1 <- numsignificant1 + 1
if (gqarr[mypoint-kp3+1,2] < 0.05) numsignificant5 <- numsignificant5 + 1
if (gqarr[mypoint-kp3+1,2] < 0.10) numsignificant10 <- numsignificant10 + 1
}
gqarr
}
bitmap(file='test0.png')
plot(x[,1], type='l', main='Actuals and Interpolation', ylab='value of Actuals and Interpolation (dots)', xlab='time or index')
points(x[,1]-mysum$resid)
grid()
dev.off()
bitmap(file='test1.png')
plot(mysum$resid, type='b', pch=19, main='Residuals', ylab='value of Residuals', xlab='time or index')
grid()
dev.off()
bitmap(file='test2.png')
hist(mysum$resid, main='Residual Histogram', xlab='values of Residuals')
grid()
dev.off()
bitmap(file='test3.png')
densityplot(~mysum$resid,col='black',main='Residual Density Plot', xlab='values of Residuals')
dev.off()
bitmap(file='test4.png')
qqnorm(mysum$resid, main='Residual Normal Q-Q Plot')
qqline(mysum$resid)
grid()
dev.off()
(myerror <- as.ts(mysum$resid))
bitmap(file='test5.png')
dum <- cbind(lag(myerror,k=1),myerror)
dum
dum1 <- dum[2:length(myerror),]
dum1
z <- as.data.frame(dum1)
z
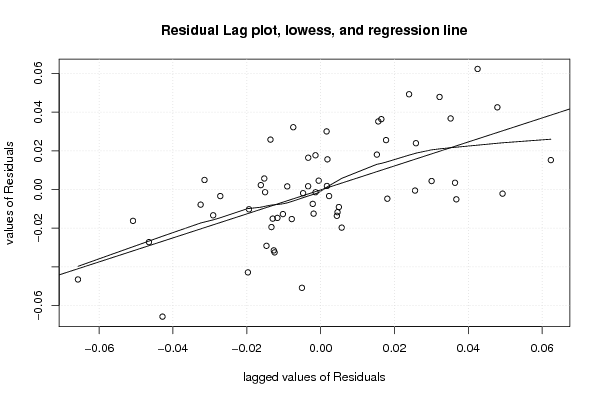
plot(z,main=paste('Residual Lag plot, lowess, and regression line'), ylab='values of Residuals', xlab='lagged values of Residuals')
lines(lowess(z))
abline(lm(z))
grid()
dev.off()
bitmap(file='test6.png')
acf(mysum$resid, lag.max=length(mysum$resid)/2, main='Residual Autocorrelation Function')
grid()
dev.off()
bitmap(file='test7.png')
pacf(mysum$resid, lag.max=length(mysum$resid)/2, main='Residual Partial Autocorrelation Function')
grid()
dev.off()
bitmap(file='test8.png')
opar <- par(mfrow = c(2,2), oma = c(0, 0, 1.1, 0))
plot(mylm, las = 1, sub='Residual Diagnostics')
par(opar)
dev.off()
if (n > n25) {
bitmap(file='test9.png')
plot(kp3:nmkm3,gqarr[,2], main='Goldfeld-Quandt test',ylab='2-sided p-value',xlab='breakpoint')
grid()
dev.off()
}
load(file='createtable')
a<-table.start()
a<-table.row.start(a)
a<-table.element(a, 'Multiple Linear Regression - Estimated Regression Equation', 1, TRUE)
a<-table.row.end(a)
myeq <- colnames(x)[1]
myeq <- paste(myeq, '[t] = ', sep='')
for (i in 1:k){
if (mysum$coefficients[i,1] > 0) myeq <- paste(myeq, '+', '')
myeq <- paste(myeq, mysum$coefficients[i,1], sep=' ')
if (rownames(mysum$coefficients)[i] != '(Intercept)') {
myeq <- paste(myeq, rownames(mysum$coefficients)[i], sep='')
if (rownames(mysum$coefficients)[i] != 't') myeq <- paste(myeq, '[t]', sep='')
}
}
myeq <- paste(myeq, ' + e[t]')
a<-table.row.start(a)
a<-table.element(a, myeq)
a<-table.row.end(a)
a<-table.end(a)
table.save(a,file='mytable1.tab')
a<-table.start()
a<-table.row.start(a)
a<-table.element(a,hyperlink('ols1.htm','Multiple Linear Regression - Ordinary Least Squares',''), 6, TRUE)
a<-table.row.end(a)
a<-table.row.start(a)
a<-table.element(a,'Variable',header=TRUE)
a<-table.element(a,'Parameter',header=TRUE)
a<-table.element(a,'S.D.',header=TRUE)
a<-table.element(a,'T-STAT
H0: parameter = 0',header=TRUE)
a<-table.element(a,'2-tail p-value',header=TRUE)
a<-table.element(a,'1-tail p-value',header=TRUE)
a<-table.row.end(a)
for (i in 1:k){
a<-table.row.start(a)
a<-table.element(a,rownames(mysum$coefficients)[i],header=TRUE)
a<-table.element(a,mysum$coefficients[i,1])
a<-table.element(a, round(mysum$coefficients[i,2],6))
a<-table.element(a, round(mysum$coefficients[i,3],4))
a<-table.element(a, round(mysum$coefficients[i,4],6))
a<-table.element(a, round(mysum$coefficients[i,4]/2,6))
a<-table.row.end(a)
}
a<-table.end(a)
table.save(a,file='mytable2.tab')
a<-table.start()
a<-table.row.start(a)
a<-table.element(a, 'Multiple Linear Regression - Regression Statistics', 2, TRUE)
a<-table.row.end(a)
a<-table.row.start(a)
a<-table.element(a, 'Multiple R',1,TRUE)
a<-table.element(a, sqrt(mysum$r.squared))
a<-table.row.end(a)
a<-table.row.start(a)
a<-table.element(a, 'R-squared',1,TRUE)
a<-table.element(a, mysum$r.squared)
a<-table.row.end(a)
a<-table.row.start(a)
a<-table.element(a, 'Adjusted R-squared',1,TRUE)
a<-table.element(a, mysum$adj.r.squared)
a<-table.row.end(a)
a<-table.row.start(a)
a<-table.element(a, 'F-TEST (value)',1,TRUE)
a<-table.element(a, mysum$fstatistic[1])
a<-table.row.end(a)
a<-table.row.start(a)
a<-table.element(a, 'F-TEST (DF numerator)',1,TRUE)
a<-table.element(a, mysum$fstatistic[2])
a<-table.row.end(a)
a<-table.row.start(a)
a<-table.element(a, 'F-TEST (DF denominator)',1,TRUE)
a<-table.element(a, mysum$fstatistic[3])
a<-table.row.end(a)
a<-table.row.start(a)
a<-table.element(a, 'p-value',1,TRUE)
a<-table.element(a, 1-pf(mysum$fstatistic[1],mysum$fstatistic[2],mysum$fstatistic[3]))
a<-table.row.end(a)
a<-table.row.start(a)
a<-table.element(a, 'Multiple Linear Regression - Residual Statistics', 2, TRUE)
a<-table.row.end(a)
a<-table.row.start(a)
a<-table.element(a, 'Residual Standard Deviation',1,TRUE)
a<-table.element(a, mysum$sigma)
a<-table.row.end(a)
a<-table.row.start(a)
a<-table.element(a, 'Sum Squared Residuals',1,TRUE)
a<-table.element(a, sum(myerror*myerror))
a<-table.row.end(a)
a<-table.end(a)
table.save(a,file='mytable3.tab')
a<-table.start()
a<-table.row.start(a)
a<-table.element(a, 'Multiple Linear Regression - Actuals, Interpolation, and Residuals', 4, TRUE)
a<-table.row.end(a)
a<-table.row.start(a)
a<-table.element(a, 'Time or Index', 1, TRUE)
a<-table.element(a, 'Actuals', 1, TRUE)
a<-table.element(a, 'Interpolation
Forecast', 1, TRUE)
a<-table.element(a, 'Residuals
Prediction Error', 1, TRUE)
a<-table.row.end(a)
for (i in 1:n) {
a<-table.row.start(a)
a<-table.element(a,i, 1, TRUE)
a<-table.element(a,x[i])
a<-table.element(a,x[i]-mysum$resid[i])
a<-table.element(a,mysum$resid[i])
a<-table.row.end(a)
}
a<-table.end(a)
table.save(a,file='mytable4.tab')
if (n > n25) {
a<-table.start()
a<-table.row.start(a)
a<-table.element(a,'Goldfeld-Quandt test for Heteroskedasticity',4,TRUE)
a<-table.row.end(a)
a<-table.row.start(a)
a<-table.element(a,'p-values',header=TRUE)
a<-table.element(a,'Alternative Hypothesis',3,header=TRUE)
a<-table.row.end(a)
a<-table.row.start(a)
a<-table.element(a,'breakpoint index',header=TRUE)
a<-table.element(a,'greater',header=TRUE)
a<-table.element(a,'2-sided',header=TRUE)
a<-table.element(a,'less',header=TRUE)
a<-table.row.end(a)
for (mypoint in kp3:nmkm3) {
a<-table.row.start(a)
a<-table.element(a,mypoint,header=TRUE)
a<-table.element(a,gqarr[mypoint-kp3+1,1])
a<-table.element(a,gqarr[mypoint-kp3+1,2])
a<-table.element(a,gqarr[mypoint-kp3+1,3])
a<-table.row.end(a)
}
a<-table.end(a)
table.save(a,file='mytable5.tab')
a<-table.start()
a<-table.row.start(a)
a<-table.element(a,'Meta Analysis of Goldfeld-Quandt test for Heteroskedasticity',4,TRUE)
a<-table.row.end(a)
a<-table.row.start(a)
a<-table.element(a,'Description',header=TRUE)
a<-table.element(a,'# significant tests',header=TRUE)
a<-table.element(a,'% significant tests',header=TRUE)
a<-table.element(a,'OK/NOK',header=TRUE)
a<-table.row.end(a)
a<-table.row.start(a)
a<-table.element(a,'1% type I error level',header=TRUE)
a<-table.element(a,numsignificant1)
a<-table.element(a,numsignificant1/numgqtests)
if (numsignificant1/numgqtests < 0.01) dum <- 'OK' else dum <- 'NOK'
a<-table.element(a,dum)
a<-table.row.end(a)
a<-table.row.start(a)
a<-table.element(a,'5% type I error level',header=TRUE)
a<-table.element(a,numsignificant5)
a<-table.element(a,numsignificant5/numgqtests)
if (numsignificant5/numgqtests < 0.05) dum <- 'OK' else dum <- 'NOK'
a<-table.element(a,dum)
a<-table.row.end(a)
a<-table.row.start(a)
a<-table.element(a,'10% type I error level',header=TRUE)
a<-table.element(a,numsignificant10)
a<-table.element(a,numsignificant10/numgqtests)
if (numsignificant10/numgqtests < 0.1) dum <- 'OK' else dum <- 'NOK'
a<-table.element(a,dum)
a<-table.row.end(a)
a<-table.end(a)
table.save(a,file='mytable6.tab')
}