Free Statistics

of Irreproducible Research!

Author's title

Author*The author of this computation has been verified*
R Software Modulerwasp_autocorrelation.wasp
Title produced by software(Partial) Autocorrelation Function
Date of computationMon, 20 Dec 2010 08:22:32 +0000
Cite this page as followsStatistical Computations at FreeStatistics.org, Office for Research Development and Education, URL https://freestatistics.org/blog/index.php?v=date/2010/Dec/20/t12928332789tpxnhsv9182a7f.htm/, Retrieved Fri, 03 May 2024 15:49:55 +0000
Statistical Computations at FreeStatistics.org, Office for Research Development and Education, URL https://freestatistics.org/blog/index.php?pk=112800, Retrieved Fri, 03 May 2024 15:49:55 +0000
QR Codes:

Original text written by user:
IsPrivate?No (this computation is public)
User-defined keywords
Estimated Impact146
Family? (F = Feedback message, R = changed R code, M = changed R Module, P = changed Parameters, D = changed Data)
-       [(Partial) Autocorrelation Function] [ACF exogene tijdr...] [2010-12-20 08:22:32] [19046f4a6967f3fb6f5f17d42e7d38f2] [Current]
Feedback Forum

Post a new message
Dataseries X:
94.6
95.9
104.7
102.8
98.1
113.9
80.9
95.7
113.2
105.9
108.8
102.3
99
100.7
115.5
100.7
109.9
114.6
85.4
100.5
114.8
116.5
112.9
102
106
105.3
118.8
106.1
109.3
117.2
92.5
104.2
112.5
122.4
113.3
100
110.7
112.8
109.8
117.3
109.1
115.9
96
99.8
116.8
115.7
99.4
94.3
91
93.2
103.1
94.1
91.8
102.7
82.6
89.1
104.5
105.1
95.1
88.7


Summary of computational transaction
Raw Inputview raw input (R code)
Raw Outputview raw output of R engine
Computing time2 seconds
R Server'Gwilym Jenkins' @ 72.249.127.135

\begin{tabular}{lllllllll}
\hline
Summary of computational transaction \tabularnewline
Raw Input & view raw input (R code)  \tabularnewline
Raw Output & view raw output of R engine  \tabularnewline
Computing time & 2 seconds \tabularnewline
R Server & 'Gwilym Jenkins' @ 72.249.127.135 \tabularnewline
\hline
\end{tabular}
%Source: https://freestatistics.org/blog/index.php?pk=112800&T=0

[TABLE]
[ROW][C]Summary of computational transaction[/C][/ROW]
[ROW][C]Raw Input[/C][C]view raw input (R code) [/C][/ROW]
[ROW][C]Raw Output[/C][C]view raw output of R engine [/C][/ROW]
[ROW][C]Computing time[/C][C]2 seconds[/C][/ROW]
[ROW][C]R Server[/C][C]'Gwilym Jenkins' @ 72.249.127.135[/C][/ROW]
[/TABLE]
Source: https://freestatistics.org/blog/index.php?pk=112800&T=0

Globally Unique Identifier (entire table): ba.freestatistics.org/blog/index.php?pk=112800&T=0

As an alternative you can also use a QR Code:  

The GUIDs for individual cells are displayed in the table below:

Summary of computational transaction
Raw Inputview raw input (R code)
Raw Outputview raw output of R engine
Computing time2 seconds
R Server'Gwilym Jenkins' @ 72.249.127.135


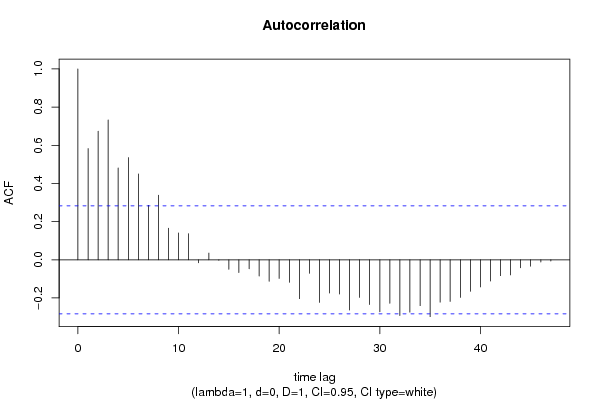
Autocorrelation Function
Time lag kACF(k)T-STATP-value
10.5828764.03839.7e-05
20.6739244.66911.2e-05
30.7330055.07843e-06
40.4813183.33470.000826
50.5358863.71270.000267
60.4498193.11640.001544
70.2858451.98040.026703
80.3384392.34480.011611
90.1653811.14580.128781
100.1407770.97530.167144
110.136850.94810.173908
12-0.015479-0.10720.457521
130.0354680.24570.40347
14-0.002498-0.01730.493132
15-0.049609-0.34370.366287
16-0.066864-0.46320.32264
17-0.047031-0.32580.37298
18-0.085413-0.59180.278395
19-0.11287-0.7820.219031
20-0.097856-0.6780.250523
21-0.117768-0.81590.209288
22-0.203541-1.41020.082468
23-0.070807-0.49060.312985
24-0.223499-1.54840.064042
25-0.174377-1.20810.11646
26-0.179291-1.24220.110105
27-0.263529-1.82580.037054
28-0.197-1.36490.089331
29-0.234534-1.62490.055367
30-0.272272-1.88640.032652
31-0.228158-1.58070.060254
32-0.292128-2.02390.024282
33-0.274408-1.90120.031647
34-0.240263-1.66460.051255
35-0.297848-2.06360.022245
36-0.222397-1.54080.064965
37-0.21797-1.51010.068781
38-0.197462-1.36810.088833
39-0.165025-1.14330.129286
40-0.142201-0.98520.164734
41-0.111234-0.77070.222345
42-0.083366-0.57760.283126
43-0.079101-0.5480.293106
44-0.042237-0.29260.385534
45-0.033371-0.23120.40907
46-0.011554-0.080.468265
47-0.006627-0.04590.481786
48NANANA

\begin{tabular}{lllllllll}
\hline
Autocorrelation Function \tabularnewline
Time lag k & ACF(k) & T-STAT & P-value \tabularnewline
1 & 0.582876 & 4.0383 & 9.7e-05 \tabularnewline
2 & 0.673924 & 4.6691 & 1.2e-05 \tabularnewline
3 & 0.733005 & 5.0784 & 3e-06 \tabularnewline
4 & 0.481318 & 3.3347 & 0.000826 \tabularnewline
5 & 0.535886 & 3.7127 & 0.000267 \tabularnewline
6 & 0.449819 & 3.1164 & 0.001544 \tabularnewline
7 & 0.285845 & 1.9804 & 0.026703 \tabularnewline
8 & 0.338439 & 2.3448 & 0.011611 \tabularnewline
9 & 0.165381 & 1.1458 & 0.128781 \tabularnewline
10 & 0.140777 & 0.9753 & 0.167144 \tabularnewline
11 & 0.13685 & 0.9481 & 0.173908 \tabularnewline
12 & -0.015479 & -0.1072 & 0.457521 \tabularnewline
13 & 0.035468 & 0.2457 & 0.40347 \tabularnewline
14 & -0.002498 & -0.0173 & 0.493132 \tabularnewline
15 & -0.049609 & -0.3437 & 0.366287 \tabularnewline
16 & -0.066864 & -0.4632 & 0.32264 \tabularnewline
17 & -0.047031 & -0.3258 & 0.37298 \tabularnewline
18 & -0.085413 & -0.5918 & 0.278395 \tabularnewline
19 & -0.11287 & -0.782 & 0.219031 \tabularnewline
20 & -0.097856 & -0.678 & 0.250523 \tabularnewline
21 & -0.117768 & -0.8159 & 0.209288 \tabularnewline
22 & -0.203541 & -1.4102 & 0.082468 \tabularnewline
23 & -0.070807 & -0.4906 & 0.312985 \tabularnewline
24 & -0.223499 & -1.5484 & 0.064042 \tabularnewline
25 & -0.174377 & -1.2081 & 0.11646 \tabularnewline
26 & -0.179291 & -1.2422 & 0.110105 \tabularnewline
27 & -0.263529 & -1.8258 & 0.037054 \tabularnewline
28 & -0.197 & -1.3649 & 0.089331 \tabularnewline
29 & -0.234534 & -1.6249 & 0.055367 \tabularnewline
30 & -0.272272 & -1.8864 & 0.032652 \tabularnewline
31 & -0.228158 & -1.5807 & 0.060254 \tabularnewline
32 & -0.292128 & -2.0239 & 0.024282 \tabularnewline
33 & -0.274408 & -1.9012 & 0.031647 \tabularnewline
34 & -0.240263 & -1.6646 & 0.051255 \tabularnewline
35 & -0.297848 & -2.0636 & 0.022245 \tabularnewline
36 & -0.222397 & -1.5408 & 0.064965 \tabularnewline
37 & -0.21797 & -1.5101 & 0.068781 \tabularnewline
38 & -0.197462 & -1.3681 & 0.088833 \tabularnewline
39 & -0.165025 & -1.1433 & 0.129286 \tabularnewline
40 & -0.142201 & -0.9852 & 0.164734 \tabularnewline
41 & -0.111234 & -0.7707 & 0.222345 \tabularnewline
42 & -0.083366 & -0.5776 & 0.283126 \tabularnewline
43 & -0.079101 & -0.548 & 0.293106 \tabularnewline
44 & -0.042237 & -0.2926 & 0.385534 \tabularnewline
45 & -0.033371 & -0.2312 & 0.40907 \tabularnewline
46 & -0.011554 & -0.08 & 0.468265 \tabularnewline
47 & -0.006627 & -0.0459 & 0.481786 \tabularnewline
48 & NA & NA & NA \tabularnewline
\hline
\end{tabular}
%Source: https://freestatistics.org/blog/index.php?pk=112800&T=1

[TABLE]
[ROW][C]Autocorrelation Function[/C][/ROW]
[ROW][C]Time lag k[/C][C]ACF(k)[/C][C]T-STAT[/C][C]P-value[/C][/ROW]
[ROW][C]1[/C][C]0.582876[/C][C]4.0383[/C][C]9.7e-05[/C][/ROW]
[ROW][C]2[/C][C]0.673924[/C][C]4.6691[/C][C]1.2e-05[/C][/ROW]
[ROW][C]3[/C][C]0.733005[/C][C]5.0784[/C][C]3e-06[/C][/ROW]
[ROW][C]4[/C][C]0.481318[/C][C]3.3347[/C][C]0.000826[/C][/ROW]
[ROW][C]5[/C][C]0.535886[/C][C]3.7127[/C][C]0.000267[/C][/ROW]
[ROW][C]6[/C][C]0.449819[/C][C]3.1164[/C][C]0.001544[/C][/ROW]
[ROW][C]7[/C][C]0.285845[/C][C]1.9804[/C][C]0.026703[/C][/ROW]
[ROW][C]8[/C][C]0.338439[/C][C]2.3448[/C][C]0.011611[/C][/ROW]
[ROW][C]9[/C][C]0.165381[/C][C]1.1458[/C][C]0.128781[/C][/ROW]
[ROW][C]10[/C][C]0.140777[/C][C]0.9753[/C][C]0.167144[/C][/ROW]
[ROW][C]11[/C][C]0.13685[/C][C]0.9481[/C][C]0.173908[/C][/ROW]
[ROW][C]12[/C][C]-0.015479[/C][C]-0.1072[/C][C]0.457521[/C][/ROW]
[ROW][C]13[/C][C]0.035468[/C][C]0.2457[/C][C]0.40347[/C][/ROW]
[ROW][C]14[/C][C]-0.002498[/C][C]-0.0173[/C][C]0.493132[/C][/ROW]
[ROW][C]15[/C][C]-0.049609[/C][C]-0.3437[/C][C]0.366287[/C][/ROW]
[ROW][C]16[/C][C]-0.066864[/C][C]-0.4632[/C][C]0.32264[/C][/ROW]
[ROW][C]17[/C][C]-0.047031[/C][C]-0.3258[/C][C]0.37298[/C][/ROW]
[ROW][C]18[/C][C]-0.085413[/C][C]-0.5918[/C][C]0.278395[/C][/ROW]
[ROW][C]19[/C][C]-0.11287[/C][C]-0.782[/C][C]0.219031[/C][/ROW]
[ROW][C]20[/C][C]-0.097856[/C][C]-0.678[/C][C]0.250523[/C][/ROW]
[ROW][C]21[/C][C]-0.117768[/C][C]-0.8159[/C][C]0.209288[/C][/ROW]
[ROW][C]22[/C][C]-0.203541[/C][C]-1.4102[/C][C]0.082468[/C][/ROW]
[ROW][C]23[/C][C]-0.070807[/C][C]-0.4906[/C][C]0.312985[/C][/ROW]
[ROW][C]24[/C][C]-0.223499[/C][C]-1.5484[/C][C]0.064042[/C][/ROW]
[ROW][C]25[/C][C]-0.174377[/C][C]-1.2081[/C][C]0.11646[/C][/ROW]
[ROW][C]26[/C][C]-0.179291[/C][C]-1.2422[/C][C]0.110105[/C][/ROW]
[ROW][C]27[/C][C]-0.263529[/C][C]-1.8258[/C][C]0.037054[/C][/ROW]
[ROW][C]28[/C][C]-0.197[/C][C]-1.3649[/C][C]0.089331[/C][/ROW]
[ROW][C]29[/C][C]-0.234534[/C][C]-1.6249[/C][C]0.055367[/C][/ROW]
[ROW][C]30[/C][C]-0.272272[/C][C]-1.8864[/C][C]0.032652[/C][/ROW]
[ROW][C]31[/C][C]-0.228158[/C][C]-1.5807[/C][C]0.060254[/C][/ROW]
[ROW][C]32[/C][C]-0.292128[/C][C]-2.0239[/C][C]0.024282[/C][/ROW]
[ROW][C]33[/C][C]-0.274408[/C][C]-1.9012[/C][C]0.031647[/C][/ROW]
[ROW][C]34[/C][C]-0.240263[/C][C]-1.6646[/C][C]0.051255[/C][/ROW]
[ROW][C]35[/C][C]-0.297848[/C][C]-2.0636[/C][C]0.022245[/C][/ROW]
[ROW][C]36[/C][C]-0.222397[/C][C]-1.5408[/C][C]0.064965[/C][/ROW]
[ROW][C]37[/C][C]-0.21797[/C][C]-1.5101[/C][C]0.068781[/C][/ROW]
[ROW][C]38[/C][C]-0.197462[/C][C]-1.3681[/C][C]0.088833[/C][/ROW]
[ROW][C]39[/C][C]-0.165025[/C][C]-1.1433[/C][C]0.129286[/C][/ROW]
[ROW][C]40[/C][C]-0.142201[/C][C]-0.9852[/C][C]0.164734[/C][/ROW]
[ROW][C]41[/C][C]-0.111234[/C][C]-0.7707[/C][C]0.222345[/C][/ROW]
[ROW][C]42[/C][C]-0.083366[/C][C]-0.5776[/C][C]0.283126[/C][/ROW]
[ROW][C]43[/C][C]-0.079101[/C][C]-0.548[/C][C]0.293106[/C][/ROW]
[ROW][C]44[/C][C]-0.042237[/C][C]-0.2926[/C][C]0.385534[/C][/ROW]
[ROW][C]45[/C][C]-0.033371[/C][C]-0.2312[/C][C]0.40907[/C][/ROW]
[ROW][C]46[/C][C]-0.011554[/C][C]-0.08[/C][C]0.468265[/C][/ROW]
[ROW][C]47[/C][C]-0.006627[/C][C]-0.0459[/C][C]0.481786[/C][/ROW]
[ROW][C]48[/C][C]NA[/C][C]NA[/C][C]NA[/C][/ROW]
[/TABLE]
Source: https://freestatistics.org/blog/index.php?pk=112800&T=1

Globally Unique Identifier (entire table): ba.freestatistics.org/blog/index.php?pk=112800&T=1

As an alternative you can also use a QR Code:  

The GUIDs for individual cells are displayed in the table below:

Autocorrelation Function
Time lag kACF(k)T-STATP-value
10.5828764.03839.7e-05
20.6739244.66911.2e-05
30.7330055.07843e-06
40.4813183.33470.000826
50.5358863.71270.000267
60.4498193.11640.001544
70.2858451.98040.026703
80.3384392.34480.011611
90.1653811.14580.128781
100.1407770.97530.167144
110.136850.94810.173908
12-0.015479-0.10720.457521
130.0354680.24570.40347
14-0.002498-0.01730.493132
15-0.049609-0.34370.366287
16-0.066864-0.46320.32264
17-0.047031-0.32580.37298
18-0.085413-0.59180.278395
19-0.11287-0.7820.219031
20-0.097856-0.6780.250523
21-0.117768-0.81590.209288
22-0.203541-1.41020.082468
23-0.070807-0.49060.312985
24-0.223499-1.54840.064042
25-0.174377-1.20810.11646
26-0.179291-1.24220.110105
27-0.263529-1.82580.037054
28-0.197-1.36490.089331
29-0.234534-1.62490.055367
30-0.272272-1.88640.032652
31-0.228158-1.58070.060254
32-0.292128-2.02390.024282
33-0.274408-1.90120.031647
34-0.240263-1.66460.051255
35-0.297848-2.06360.022245
36-0.222397-1.54080.064965
37-0.21797-1.51010.068781
38-0.197462-1.36810.088833
39-0.165025-1.14330.129286
40-0.142201-0.98520.164734
41-0.111234-0.77070.222345
42-0.083366-0.57760.283126
43-0.079101-0.5480.293106
44-0.042237-0.29260.385534
45-0.033371-0.23120.40907
46-0.011554-0.080.468265
47-0.006627-0.04590.481786
48NANANA


Partial Autocorrelation Function
Time lag kPACF(k)T-STATP-value
10.5828764.03839.7e-05
20.5061373.50660.000498
30.4968153.4420.000603
4-0.215374-1.49220.071101
5-0.201845-1.39840.084207
6-0.168767-1.16930.124037
7-0.18109-1.25460.107844
80.0458850.31790.37597
9-0.073948-0.51230.305387
100.0558160.38670.350341
110.0867470.6010.275334
12-0.043942-0.30440.381056
130.0071180.04930.480437
140.0412560.28580.38812
150.119970.83120.204996
16-0.175169-1.21360.115417
17-0.013141-0.0910.463919
18-0.020421-0.14150.44404
19-0.100436-0.69580.244942
20-0.062439-0.43260.333625
21-0.006467-0.04480.482224
22-0.166705-1.1550.12691
230.2296871.59130.059052
24-0.072418-0.50170.309076
250.0263590.18260.427933
26-0.166219-1.15160.127595
27-0.040717-0.28210.389542
28-0.041433-0.28710.387653
290.0502250.3480.364692
300.0570310.39510.347252
31-0.141836-0.98270.165348
32-0.109358-0.75770.226181
33-0.050217-0.34790.364713
340.0323180.22390.41189
350.118290.81950.208266
360.0818440.5670.286668
370.0913170.63270.264979
380.0079980.05540.478021
39-0.040324-0.27940.390579
40-0.133205-0.92290.180345
41-0.045198-0.31310.377766
42-0.010411-0.07210.471399
43-0.046721-0.32370.373787
44-0.075319-0.52180.302095
450.1287610.89210.1884
46-0.02535-0.17560.430661
470.0694960.48150.31618
48NANANA

\begin{tabular}{lllllllll}
\hline
Partial Autocorrelation Function \tabularnewline
Time lag k & PACF(k) & T-STAT & P-value \tabularnewline
1 & 0.582876 & 4.0383 & 9.7e-05 \tabularnewline
2 & 0.506137 & 3.5066 & 0.000498 \tabularnewline
3 & 0.496815 & 3.442 & 0.000603 \tabularnewline
4 & -0.215374 & -1.4922 & 0.071101 \tabularnewline
5 & -0.201845 & -1.3984 & 0.084207 \tabularnewline
6 & -0.168767 & -1.1693 & 0.124037 \tabularnewline
7 & -0.18109 & -1.2546 & 0.107844 \tabularnewline
8 & 0.045885 & 0.3179 & 0.37597 \tabularnewline
9 & -0.073948 & -0.5123 & 0.305387 \tabularnewline
10 & 0.055816 & 0.3867 & 0.350341 \tabularnewline
11 & 0.086747 & 0.601 & 0.275334 \tabularnewline
12 & -0.043942 & -0.3044 & 0.381056 \tabularnewline
13 & 0.007118 & 0.0493 & 0.480437 \tabularnewline
14 & 0.041256 & 0.2858 & 0.38812 \tabularnewline
15 & 0.11997 & 0.8312 & 0.204996 \tabularnewline
16 & -0.175169 & -1.2136 & 0.115417 \tabularnewline
17 & -0.013141 & -0.091 & 0.463919 \tabularnewline
18 & -0.020421 & -0.1415 & 0.44404 \tabularnewline
19 & -0.100436 & -0.6958 & 0.244942 \tabularnewline
20 & -0.062439 & -0.4326 & 0.333625 \tabularnewline
21 & -0.006467 & -0.0448 & 0.482224 \tabularnewline
22 & -0.166705 & -1.155 & 0.12691 \tabularnewline
23 & 0.229687 & 1.5913 & 0.059052 \tabularnewline
24 & -0.072418 & -0.5017 & 0.309076 \tabularnewline
25 & 0.026359 & 0.1826 & 0.427933 \tabularnewline
26 & -0.166219 & -1.1516 & 0.127595 \tabularnewline
27 & -0.040717 & -0.2821 & 0.389542 \tabularnewline
28 & -0.041433 & -0.2871 & 0.387653 \tabularnewline
29 & 0.050225 & 0.348 & 0.364692 \tabularnewline
30 & 0.057031 & 0.3951 & 0.347252 \tabularnewline
31 & -0.141836 & -0.9827 & 0.165348 \tabularnewline
32 & -0.109358 & -0.7577 & 0.226181 \tabularnewline
33 & -0.050217 & -0.3479 & 0.364713 \tabularnewline
34 & 0.032318 & 0.2239 & 0.41189 \tabularnewline
35 & 0.11829 & 0.8195 & 0.208266 \tabularnewline
36 & 0.081844 & 0.567 & 0.286668 \tabularnewline
37 & 0.091317 & 0.6327 & 0.264979 \tabularnewline
38 & 0.007998 & 0.0554 & 0.478021 \tabularnewline
39 & -0.040324 & -0.2794 & 0.390579 \tabularnewline
40 & -0.133205 & -0.9229 & 0.180345 \tabularnewline
41 & -0.045198 & -0.3131 & 0.377766 \tabularnewline
42 & -0.010411 & -0.0721 & 0.471399 \tabularnewline
43 & -0.046721 & -0.3237 & 0.373787 \tabularnewline
44 & -0.075319 & -0.5218 & 0.302095 \tabularnewline
45 & 0.128761 & 0.8921 & 0.1884 \tabularnewline
46 & -0.02535 & -0.1756 & 0.430661 \tabularnewline
47 & 0.069496 & 0.4815 & 0.31618 \tabularnewline
48 & NA & NA & NA \tabularnewline
\hline
\end{tabular}
%Source: https://freestatistics.org/blog/index.php?pk=112800&T=2

[TABLE]
[ROW][C]Partial Autocorrelation Function[/C][/ROW]
[ROW][C]Time lag k[/C][C]PACF(k)[/C][C]T-STAT[/C][C]P-value[/C][/ROW]
[ROW][C]1[/C][C]0.582876[/C][C]4.0383[/C][C]9.7e-05[/C][/ROW]
[ROW][C]2[/C][C]0.506137[/C][C]3.5066[/C][C]0.000498[/C][/ROW]
[ROW][C]3[/C][C]0.496815[/C][C]3.442[/C][C]0.000603[/C][/ROW]
[ROW][C]4[/C][C]-0.215374[/C][C]-1.4922[/C][C]0.071101[/C][/ROW]
[ROW][C]5[/C][C]-0.201845[/C][C]-1.3984[/C][C]0.084207[/C][/ROW]
[ROW][C]6[/C][C]-0.168767[/C][C]-1.1693[/C][C]0.124037[/C][/ROW]
[ROW][C]7[/C][C]-0.18109[/C][C]-1.2546[/C][C]0.107844[/C][/ROW]
[ROW][C]8[/C][C]0.045885[/C][C]0.3179[/C][C]0.37597[/C][/ROW]
[ROW][C]9[/C][C]-0.073948[/C][C]-0.5123[/C][C]0.305387[/C][/ROW]
[ROW][C]10[/C][C]0.055816[/C][C]0.3867[/C][C]0.350341[/C][/ROW]
[ROW][C]11[/C][C]0.086747[/C][C]0.601[/C][C]0.275334[/C][/ROW]
[ROW][C]12[/C][C]-0.043942[/C][C]-0.3044[/C][C]0.381056[/C][/ROW]
[ROW][C]13[/C][C]0.007118[/C][C]0.0493[/C][C]0.480437[/C][/ROW]
[ROW][C]14[/C][C]0.041256[/C][C]0.2858[/C][C]0.38812[/C][/ROW]
[ROW][C]15[/C][C]0.11997[/C][C]0.8312[/C][C]0.204996[/C][/ROW]
[ROW][C]16[/C][C]-0.175169[/C][C]-1.2136[/C][C]0.115417[/C][/ROW]
[ROW][C]17[/C][C]-0.013141[/C][C]-0.091[/C][C]0.463919[/C][/ROW]
[ROW][C]18[/C][C]-0.020421[/C][C]-0.1415[/C][C]0.44404[/C][/ROW]
[ROW][C]19[/C][C]-0.100436[/C][C]-0.6958[/C][C]0.244942[/C][/ROW]
[ROW][C]20[/C][C]-0.062439[/C][C]-0.4326[/C][C]0.333625[/C][/ROW]
[ROW][C]21[/C][C]-0.006467[/C][C]-0.0448[/C][C]0.482224[/C][/ROW]
[ROW][C]22[/C][C]-0.166705[/C][C]-1.155[/C][C]0.12691[/C][/ROW]
[ROW][C]23[/C][C]0.229687[/C][C]1.5913[/C][C]0.059052[/C][/ROW]
[ROW][C]24[/C][C]-0.072418[/C][C]-0.5017[/C][C]0.309076[/C][/ROW]
[ROW][C]25[/C][C]0.026359[/C][C]0.1826[/C][C]0.427933[/C][/ROW]
[ROW][C]26[/C][C]-0.166219[/C][C]-1.1516[/C][C]0.127595[/C][/ROW]
[ROW][C]27[/C][C]-0.040717[/C][C]-0.2821[/C][C]0.389542[/C][/ROW]
[ROW][C]28[/C][C]-0.041433[/C][C]-0.2871[/C][C]0.387653[/C][/ROW]
[ROW][C]29[/C][C]0.050225[/C][C]0.348[/C][C]0.364692[/C][/ROW]
[ROW][C]30[/C][C]0.057031[/C][C]0.3951[/C][C]0.347252[/C][/ROW]
[ROW][C]31[/C][C]-0.141836[/C][C]-0.9827[/C][C]0.165348[/C][/ROW]
[ROW][C]32[/C][C]-0.109358[/C][C]-0.7577[/C][C]0.226181[/C][/ROW]
[ROW][C]33[/C][C]-0.050217[/C][C]-0.3479[/C][C]0.364713[/C][/ROW]
[ROW][C]34[/C][C]0.032318[/C][C]0.2239[/C][C]0.41189[/C][/ROW]
[ROW][C]35[/C][C]0.11829[/C][C]0.8195[/C][C]0.208266[/C][/ROW]
[ROW][C]36[/C][C]0.081844[/C][C]0.567[/C][C]0.286668[/C][/ROW]
[ROW][C]37[/C][C]0.091317[/C][C]0.6327[/C][C]0.264979[/C][/ROW]
[ROW][C]38[/C][C]0.007998[/C][C]0.0554[/C][C]0.478021[/C][/ROW]
[ROW][C]39[/C][C]-0.040324[/C][C]-0.2794[/C][C]0.390579[/C][/ROW]
[ROW][C]40[/C][C]-0.133205[/C][C]-0.9229[/C][C]0.180345[/C][/ROW]
[ROW][C]41[/C][C]-0.045198[/C][C]-0.3131[/C][C]0.377766[/C][/ROW]
[ROW][C]42[/C][C]-0.010411[/C][C]-0.0721[/C][C]0.471399[/C][/ROW]
[ROW][C]43[/C][C]-0.046721[/C][C]-0.3237[/C][C]0.373787[/C][/ROW]
[ROW][C]44[/C][C]-0.075319[/C][C]-0.5218[/C][C]0.302095[/C][/ROW]
[ROW][C]45[/C][C]0.128761[/C][C]0.8921[/C][C]0.1884[/C][/ROW]
[ROW][C]46[/C][C]-0.02535[/C][C]-0.1756[/C][C]0.430661[/C][/ROW]
[ROW][C]47[/C][C]0.069496[/C][C]0.4815[/C][C]0.31618[/C][/ROW]
[ROW][C]48[/C][C]NA[/C][C]NA[/C][C]NA[/C][/ROW]
[/TABLE]
Source: https://freestatistics.org/blog/index.php?pk=112800&T=2

Globally Unique Identifier (entire table): ba.freestatistics.org/blog/index.php?pk=112800&T=2

As an alternative you can also use a QR Code:  

The GUIDs for individual cells are displayed in the table below:

Partial Autocorrelation Function
Time lag kPACF(k)T-STATP-value
10.5828764.03839.7e-05
20.5061373.50660.000498
30.4968153.4420.000603
4-0.215374-1.49220.071101
5-0.201845-1.39840.084207
6-0.168767-1.16930.124037
7-0.18109-1.25460.107844
80.0458850.31790.37597
9-0.073948-0.51230.305387
100.0558160.38670.350341
110.0867470.6010.275334
12-0.043942-0.30440.381056
130.0071180.04930.480437
140.0412560.28580.38812
150.119970.83120.204996
16-0.175169-1.21360.115417
17-0.013141-0.0910.463919
18-0.020421-0.14150.44404
19-0.100436-0.69580.244942
20-0.062439-0.43260.333625
21-0.006467-0.04480.482224
22-0.166705-1.1550.12691
230.2296871.59130.059052
24-0.072418-0.50170.309076
250.0263590.18260.427933
26-0.166219-1.15160.127595
27-0.040717-0.28210.389542
28-0.041433-0.28710.387653
290.0502250.3480.364692
300.0570310.39510.347252
31-0.141836-0.98270.165348
32-0.109358-0.75770.226181
33-0.050217-0.34790.364713
340.0323180.22390.41189
350.118290.81950.208266
360.0818440.5670.286668
370.0913170.63270.264979
380.0079980.05540.478021
39-0.040324-0.27940.390579
40-0.133205-0.92290.180345
41-0.045198-0.31310.377766
42-0.010411-0.07210.471399
43-0.046721-0.32370.373787
44-0.075319-0.52180.302095
450.1287610.89210.1884
46-0.02535-0.17560.430661
470.0694960.48150.31618
48NANANA


Parameters (Session):
par1 = 48 ; par2 = 1 ; par3 = 0 ; par4 = 1 ; par5 = 12 ; par6 = White Noise ; par7 = 0.95 ;
Parameters (R input):
par1 = 48 ; par2 = 1 ; par3 = 0 ; par4 = 1 ; par5 = 12 ; par6 = White Noise ; par7 = 0.95 ; par8 = ;
R code (references can be found in the software module):
if (par1 == 'Default') {
par1 = 10*log10(length(x))
} else {
par1 <- as.numeric(par1)
}
par2 <- as.numeric(par2)
par3 <- as.numeric(par3)
par4 <- as.numeric(par4)
par5 <- as.numeric(par5)
if (par6 == 'White Noise') par6 <- 'white' else par6 <- 'ma'
par7 <- as.numeric(par7)
if (par8 != '') par8 <- as.numeric(par8)
ox <- x
if (par8 == '') {
if (par2 == 0) {
x <- log(x)
} else {
x <- (x ^ par2 - 1) / par2
}
} else {
x <- log(x,base=par8)
}
if (par3 > 0) x <- diff(x,lag=1,difference=par3)
if (par4 > 0) x <- diff(x,lag=par5,difference=par4)
bitmap(file='picts.png')
op <- par(mfrow=c(2,1))
plot(ox,type='l',main='Original Time Series',xlab='time',ylab='value')
if (par8=='') {
mytitle <- paste('Working Time Series (lambda=',par2,', d=',par3,', D=',par4,')',sep='')
mysub <- paste('(lambda=',par2,', d=',par3,', D=',par4,', CI=', par7, ', CI type=',par6,')',sep='')
} else {
mytitle <- paste('Working Time Series (base=',par8,', d=',par3,', D=',par4,')',sep='')
mysub <- paste('(base=',par8,', d=',par3,', D=',par4,', CI=', par7, ', CI type=',par6,')',sep='')
}
plot(x,type='l', main=mytitle,xlab='time',ylab='value')
par(op)
dev.off()
bitmap(file='pic1.png')
racf <- acf(x, par1, main='Autocorrelation', xlab='time lag', ylab='ACF', ci.type=par6, ci=par7, sub=mysub)
dev.off()
bitmap(file='pic2.png')
rpacf <- pacf(x,par1,main='Partial Autocorrelation',xlab='lags',ylab='PACF',sub=mysub)
dev.off()
(myacf <- c(racf$acf))
(mypacf <- c(rpacf$acf))
lengthx <- length(x)
sqrtn <- sqrt(lengthx)
load(file='createtable')
a<-table.start()
a<-table.row.start(a)
a<-table.element(a,'Autocorrelation Function',4,TRUE)
a<-table.row.end(a)
a<-table.row.start(a)
a<-table.element(a,'Time lag k',header=TRUE)
a<-table.element(a,hyperlink('basics.htm','ACF(k)','click here for more information about the Autocorrelation Function'),header=TRUE)
a<-table.element(a,'T-STAT',header=TRUE)
a<-table.element(a,'P-value',header=TRUE)
a<-table.row.end(a)
for (i in 2:(par1+1)) {
a<-table.row.start(a)
a<-table.element(a,i-1,header=TRUE)
a<-table.element(a,round(myacf[i],6))
mytstat <- myacf[i]*sqrtn
a<-table.element(a,round(mytstat,4))
a<-table.element(a,round(1-pt(abs(mytstat),lengthx),6))
a<-table.row.end(a)
}
a<-table.end(a)
table.save(a,file='mytable.tab')
a<-table.start()
a<-table.row.start(a)
a<-table.element(a,'Partial Autocorrelation Function',4,TRUE)
a<-table.row.end(a)
a<-table.row.start(a)
a<-table.element(a,'Time lag k',header=TRUE)
a<-table.element(a,hyperlink('basics.htm','PACF(k)','click here for more information about the Partial Autocorrelation Function'),header=TRUE)
a<-table.element(a,'T-STAT',header=TRUE)
a<-table.element(a,'P-value',header=TRUE)
a<-table.row.end(a)
for (i in 1:par1) {
a<-table.row.start(a)
a<-table.element(a,i,header=TRUE)
a<-table.element(a,round(mypacf[i],6))
mytstat <- mypacf[i]*sqrtn
a<-table.element(a,round(mytstat,4))
a<-table.element(a,round(1-pt(abs(mytstat),lengthx),6))
a<-table.row.end(a)
}
a<-table.end(a)
table.save(a,file='mytable1.tab')