Free Statistics

of Irreproducible Research!

Author's title

Author*The author of this computation has been verified*
R Software Modulerwasp_autocorrelation.wasp
Title produced by software(Partial) Autocorrelation Function
Date of computationMon, 20 Dec 2010 08:13:47 +0000
Cite this page as followsStatistical Computations at FreeStatistics.org, Office for Research Development and Education, URL https://freestatistics.org/blog/index.php?v=date/2010/Dec/20/t1292832763l7eckm8h8jul604.htm/, Retrieved Fri, 03 May 2024 21:28:49 +0000
Statistical Computations at FreeStatistics.org, Office for Research Development and Education, URL https://freestatistics.org/blog/index.php?pk=112799, Retrieved Fri, 03 May 2024 21:28:49 +0000
QR Codes:

Original text written by user:
IsPrivate?No (this computation is public)
User-defined keywords
Estimated Impact163
Family? (F = Feedback message, R = changed R code, M = changed R Module, P = changed Parameters, D = changed Data)
-       [(Partial) Autocorrelation Function] [ACF exogene tijdr...] [2010-12-20 08:13:47] [19046f4a6967f3fb6f5f17d42e7d38f2] [Current]
Feedback Forum

Post a new message
Dataseries X:
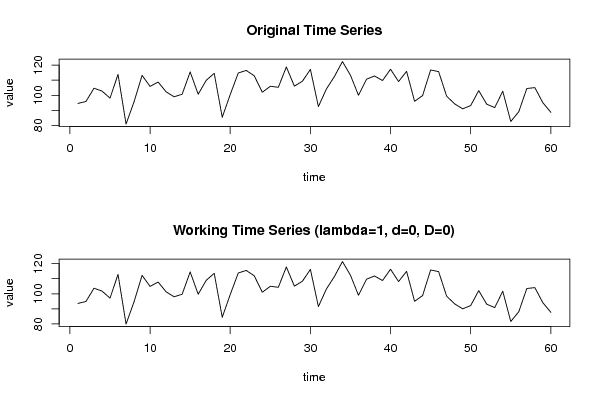
94,6
95,9
104,7
102,8
98,1
113,9
80,9
95,7
113,2
105,9
108,8
102,3
99
100,7
115,5
100,7
109,9
114,6
85,4
100,5
114,8
116,5
112,9
102
106
105,3
118,8
106,1
109,3
117,2
92,5
104,2
112,5
122,4
113,3
100
110,7
112,8
109,8
117,3
109,1
115,9
96
99,8
116,8
115,7
99,4
94,3
91
93,2
103,1
94,1
91,8
102,7
82,6
89,1
104,5
105,1
95,1
88,7


Summary of computational transaction
Raw Inputview raw input (R code)
Raw Outputview raw output of R engine
Computing time2 seconds
R Server'RServer@AstonUniversity' @ vre.aston.ac.uk

\begin{tabular}{lllllllll}
\hline
Summary of computational transaction \tabularnewline
Raw Input & view raw input (R code)  \tabularnewline
Raw Output & view raw output of R engine  \tabularnewline
Computing time & 2 seconds \tabularnewline
R Server & 'RServer@AstonUniversity' @ vre.aston.ac.uk \tabularnewline
\hline
\end{tabular}
%Source: https://freestatistics.org/blog/index.php?pk=112799&T=0

[TABLE]
[ROW][C]Summary of computational transaction[/C][/ROW]
[ROW][C]Raw Input[/C][C]view raw input (R code) [/C][/ROW]
[ROW][C]Raw Output[/C][C]view raw output of R engine [/C][/ROW]
[ROW][C]Computing time[/C][C]2 seconds[/C][/ROW]
[ROW][C]R Server[/C][C]'RServer@AstonUniversity' @ vre.aston.ac.uk[/C][/ROW]
[/TABLE]
Source: https://freestatistics.org/blog/index.php?pk=112799&T=0

Globally Unique Identifier (entire table): ba.freestatistics.org/blog/index.php?pk=112799&T=0

As an alternative you can also use a QR Code:  

The GUIDs for individual cells are displayed in the table below:

Summary of computational transaction
Raw Inputview raw input (R code)
Raw Outputview raw output of R engine
Computing time2 seconds
R Server'RServer@AstonUniversity' @ vre.aston.ac.uk


Autocorrelation Function
Time lag kACF(k)T-STATP-value
10.255841.98170.026048
20.0011020.00850.496608
30.1793071.38890.084997
40.1625421.2590.106445
50.3497492.70910.00439
60.3343552.58990.006016
70.2253181.74530.043025
80.0176930.1370.445726
9-0.049977-0.38710.35002
10-0.169631-1.3140.096931
110.0657710.50950.306151
120.445873.45370.00051
13-0.053699-0.41590.339465
14-0.302295-2.34160.011271
15-0.208486-1.61490.055787
16-0.081698-0.63280.264625
170.0516410.40.345284
18-0.031003-0.24020.405516
19-0.028202-0.21850.413908
20-0.203235-1.57430.060344
21-0.220663-1.70920.046287
22-0.235976-1.82790.036271
23-0.073682-0.57070.285154
240.2024381.56810.061061
25-0.133147-1.03140.153258
26-0.337798-2.61660.005611
27-0.201465-1.56050.061946
28-0.084203-0.65220.25837
29-0.022691-0.17580.430535
30-0.066927-0.51840.303038
31-0.040949-0.31720.3761
32-0.196487-1.5220.066634
33-0.205594-1.59250.058261
34-0.108753-0.84240.201455
35-0.085879-0.66520.25423
360.1325341.02660.154364
37-0.075571-0.58540.280247
38-0.239776-1.85730.034089
39-0.087199-0.67540.250996
400.0083330.06450.474375
410.0204160.15810.437438
420.0488750.37860.353166
430.0116960.09060.464058
44-0.069647-0.53950.295775
450.0059370.0460.481738
460.0325510.25210.400897
470.0503790.39020.348872
480.1553381.20320.116804

\begin{tabular}{lllllllll}
\hline
Autocorrelation Function \tabularnewline
Time lag k & ACF(k) & T-STAT & P-value \tabularnewline
1 & 0.25584 & 1.9817 & 0.026048 \tabularnewline
2 & 0.001102 & 0.0085 & 0.496608 \tabularnewline
3 & 0.179307 & 1.3889 & 0.084997 \tabularnewline
4 & 0.162542 & 1.259 & 0.106445 \tabularnewline
5 & 0.349749 & 2.7091 & 0.00439 \tabularnewline
6 & 0.334355 & 2.5899 & 0.006016 \tabularnewline
7 & 0.225318 & 1.7453 & 0.043025 \tabularnewline
8 & 0.017693 & 0.137 & 0.445726 \tabularnewline
9 & -0.049977 & -0.3871 & 0.35002 \tabularnewline
10 & -0.169631 & -1.314 & 0.096931 \tabularnewline
11 & 0.065771 & 0.5095 & 0.306151 \tabularnewline
12 & 0.44587 & 3.4537 & 0.00051 \tabularnewline
13 & -0.053699 & -0.4159 & 0.339465 \tabularnewline
14 & -0.302295 & -2.3416 & 0.011271 \tabularnewline
15 & -0.208486 & -1.6149 & 0.055787 \tabularnewline
16 & -0.081698 & -0.6328 & 0.264625 \tabularnewline
17 & 0.051641 & 0.4 & 0.345284 \tabularnewline
18 & -0.031003 & -0.2402 & 0.405516 \tabularnewline
19 & -0.028202 & -0.2185 & 0.413908 \tabularnewline
20 & -0.203235 & -1.5743 & 0.060344 \tabularnewline
21 & -0.220663 & -1.7092 & 0.046287 \tabularnewline
22 & -0.235976 & -1.8279 & 0.036271 \tabularnewline
23 & -0.073682 & -0.5707 & 0.285154 \tabularnewline
24 & 0.202438 & 1.5681 & 0.061061 \tabularnewline
25 & -0.133147 & -1.0314 & 0.153258 \tabularnewline
26 & -0.337798 & -2.6166 & 0.005611 \tabularnewline
27 & -0.201465 & -1.5605 & 0.061946 \tabularnewline
28 & -0.084203 & -0.6522 & 0.25837 \tabularnewline
29 & -0.022691 & -0.1758 & 0.430535 \tabularnewline
30 & -0.066927 & -0.5184 & 0.303038 \tabularnewline
31 & -0.040949 & -0.3172 & 0.3761 \tabularnewline
32 & -0.196487 & -1.522 & 0.066634 \tabularnewline
33 & -0.205594 & -1.5925 & 0.058261 \tabularnewline
34 & -0.108753 & -0.8424 & 0.201455 \tabularnewline
35 & -0.085879 & -0.6652 & 0.25423 \tabularnewline
36 & 0.132534 & 1.0266 & 0.154364 \tabularnewline
37 & -0.075571 & -0.5854 & 0.280247 \tabularnewline
38 & -0.239776 & -1.8573 & 0.034089 \tabularnewline
39 & -0.087199 & -0.6754 & 0.250996 \tabularnewline
40 & 0.008333 & 0.0645 & 0.474375 \tabularnewline
41 & 0.020416 & 0.1581 & 0.437438 \tabularnewline
42 & 0.048875 & 0.3786 & 0.353166 \tabularnewline
43 & 0.011696 & 0.0906 & 0.464058 \tabularnewline
44 & -0.069647 & -0.5395 & 0.295775 \tabularnewline
45 & 0.005937 & 0.046 & 0.481738 \tabularnewline
46 & 0.032551 & 0.2521 & 0.400897 \tabularnewline
47 & 0.050379 & 0.3902 & 0.348872 \tabularnewline
48 & 0.155338 & 1.2032 & 0.116804 \tabularnewline
\hline
\end{tabular}
%Source: https://freestatistics.org/blog/index.php?pk=112799&T=1

[TABLE]
[ROW][C]Autocorrelation Function[/C][/ROW]
[ROW][C]Time lag k[/C][C]ACF(k)[/C][C]T-STAT[/C][C]P-value[/C][/ROW]
[ROW][C]1[/C][C]0.25584[/C][C]1.9817[/C][C]0.026048[/C][/ROW]
[ROW][C]2[/C][C]0.001102[/C][C]0.0085[/C][C]0.496608[/C][/ROW]
[ROW][C]3[/C][C]0.179307[/C][C]1.3889[/C][C]0.084997[/C][/ROW]
[ROW][C]4[/C][C]0.162542[/C][C]1.259[/C][C]0.106445[/C][/ROW]
[ROW][C]5[/C][C]0.349749[/C][C]2.7091[/C][C]0.00439[/C][/ROW]
[ROW][C]6[/C][C]0.334355[/C][C]2.5899[/C][C]0.006016[/C][/ROW]
[ROW][C]7[/C][C]0.225318[/C][C]1.7453[/C][C]0.043025[/C][/ROW]
[ROW][C]8[/C][C]0.017693[/C][C]0.137[/C][C]0.445726[/C][/ROW]
[ROW][C]9[/C][C]-0.049977[/C][C]-0.3871[/C][C]0.35002[/C][/ROW]
[ROW][C]10[/C][C]-0.169631[/C][C]-1.314[/C][C]0.096931[/C][/ROW]
[ROW][C]11[/C][C]0.065771[/C][C]0.5095[/C][C]0.306151[/C][/ROW]
[ROW][C]12[/C][C]0.44587[/C][C]3.4537[/C][C]0.00051[/C][/ROW]
[ROW][C]13[/C][C]-0.053699[/C][C]-0.4159[/C][C]0.339465[/C][/ROW]
[ROW][C]14[/C][C]-0.302295[/C][C]-2.3416[/C][C]0.011271[/C][/ROW]
[ROW][C]15[/C][C]-0.208486[/C][C]-1.6149[/C][C]0.055787[/C][/ROW]
[ROW][C]16[/C][C]-0.081698[/C][C]-0.6328[/C][C]0.264625[/C][/ROW]
[ROW][C]17[/C][C]0.051641[/C][C]0.4[/C][C]0.345284[/C][/ROW]
[ROW][C]18[/C][C]-0.031003[/C][C]-0.2402[/C][C]0.405516[/C][/ROW]
[ROW][C]19[/C][C]-0.028202[/C][C]-0.2185[/C][C]0.413908[/C][/ROW]
[ROW][C]20[/C][C]-0.203235[/C][C]-1.5743[/C][C]0.060344[/C][/ROW]
[ROW][C]21[/C][C]-0.220663[/C][C]-1.7092[/C][C]0.046287[/C][/ROW]
[ROW][C]22[/C][C]-0.235976[/C][C]-1.8279[/C][C]0.036271[/C][/ROW]
[ROW][C]23[/C][C]-0.073682[/C][C]-0.5707[/C][C]0.285154[/C][/ROW]
[ROW][C]24[/C][C]0.202438[/C][C]1.5681[/C][C]0.061061[/C][/ROW]
[ROW][C]25[/C][C]-0.133147[/C][C]-1.0314[/C][C]0.153258[/C][/ROW]
[ROW][C]26[/C][C]-0.337798[/C][C]-2.6166[/C][C]0.005611[/C][/ROW]
[ROW][C]27[/C][C]-0.201465[/C][C]-1.5605[/C][C]0.061946[/C][/ROW]
[ROW][C]28[/C][C]-0.084203[/C][C]-0.6522[/C][C]0.25837[/C][/ROW]
[ROW][C]29[/C][C]-0.022691[/C][C]-0.1758[/C][C]0.430535[/C][/ROW]
[ROW][C]30[/C][C]-0.066927[/C][C]-0.5184[/C][C]0.303038[/C][/ROW]
[ROW][C]31[/C][C]-0.040949[/C][C]-0.3172[/C][C]0.3761[/C][/ROW]
[ROW][C]32[/C][C]-0.196487[/C][C]-1.522[/C][C]0.066634[/C][/ROW]
[ROW][C]33[/C][C]-0.205594[/C][C]-1.5925[/C][C]0.058261[/C][/ROW]
[ROW][C]34[/C][C]-0.108753[/C][C]-0.8424[/C][C]0.201455[/C][/ROW]
[ROW][C]35[/C][C]-0.085879[/C][C]-0.6652[/C][C]0.25423[/C][/ROW]
[ROW][C]36[/C][C]0.132534[/C][C]1.0266[/C][C]0.154364[/C][/ROW]
[ROW][C]37[/C][C]-0.075571[/C][C]-0.5854[/C][C]0.280247[/C][/ROW]
[ROW][C]38[/C][C]-0.239776[/C][C]-1.8573[/C][C]0.034089[/C][/ROW]
[ROW][C]39[/C][C]-0.087199[/C][C]-0.6754[/C][C]0.250996[/C][/ROW]
[ROW][C]40[/C][C]0.008333[/C][C]0.0645[/C][C]0.474375[/C][/ROW]
[ROW][C]41[/C][C]0.020416[/C][C]0.1581[/C][C]0.437438[/C][/ROW]
[ROW][C]42[/C][C]0.048875[/C][C]0.3786[/C][C]0.353166[/C][/ROW]
[ROW][C]43[/C][C]0.011696[/C][C]0.0906[/C][C]0.464058[/C][/ROW]
[ROW][C]44[/C][C]-0.069647[/C][C]-0.5395[/C][C]0.295775[/C][/ROW]
[ROW][C]45[/C][C]0.005937[/C][C]0.046[/C][C]0.481738[/C][/ROW]
[ROW][C]46[/C][C]0.032551[/C][C]0.2521[/C][C]0.400897[/C][/ROW]
[ROW][C]47[/C][C]0.050379[/C][C]0.3902[/C][C]0.348872[/C][/ROW]
[ROW][C]48[/C][C]0.155338[/C][C]1.2032[/C][C]0.116804[/C][/ROW]
[/TABLE]
Source: https://freestatistics.org/blog/index.php?pk=112799&T=1

Globally Unique Identifier (entire table): ba.freestatistics.org/blog/index.php?pk=112799&T=1

As an alternative you can also use a QR Code:  

The GUIDs for individual cells are displayed in the table below:

Autocorrelation Function
Time lag kACF(k)T-STATP-value
10.255841.98170.026048
20.0011020.00850.496608
30.1793071.38890.084997
40.1625421.2590.106445
50.3497492.70910.00439
60.3343552.58990.006016
70.2253181.74530.043025
80.0176930.1370.445726
9-0.049977-0.38710.35002
10-0.169631-1.3140.096931
110.0657710.50950.306151
120.445873.45370.00051
13-0.053699-0.41590.339465
14-0.302295-2.34160.011271
15-0.208486-1.61490.055787
16-0.081698-0.63280.264625
170.0516410.40.345284
18-0.031003-0.24020.405516
19-0.028202-0.21850.413908
20-0.203235-1.57430.060344
21-0.220663-1.70920.046287
22-0.235976-1.82790.036271
23-0.073682-0.57070.285154
240.2024381.56810.061061
25-0.133147-1.03140.153258
26-0.337798-2.61660.005611
27-0.201465-1.56050.061946
28-0.084203-0.65220.25837
29-0.022691-0.17580.430535
30-0.066927-0.51840.303038
31-0.040949-0.31720.3761
32-0.196487-1.5220.066634
33-0.205594-1.59250.058261
34-0.108753-0.84240.201455
35-0.085879-0.66520.25423
360.1325341.02660.154364
37-0.075571-0.58540.280247
38-0.239776-1.85730.034089
39-0.087199-0.67540.250996
400.0083330.06450.474375
410.0204160.15810.437438
420.0488750.37860.353166
430.0116960.09060.464058
44-0.069647-0.53950.295775
450.0059370.0460.481738
460.0325510.25210.400897
470.0503790.39020.348872
480.1553381.20320.116804


Partial Autocorrelation Function
Time lag kPACF(k)T-STATP-value
10.255841.98170.026048
2-0.068859-0.53340.297872
30.2113961.63750.053384
40.0640990.49650.310675
50.3500762.71170.00436
60.186611.44550.076764
70.195261.51250.067831
8-0.149574-1.15860.125606
9-0.160344-1.2420.109531
10-0.532987-4.12855.7e-05
11-0.167004-1.29360.10038
120.3610942.7970.003461
130.0342230.26510.395924
14-0.035057-0.27160.393449
15-0.129128-1.00020.160611
160.0646240.50060.309251
17-0.035822-0.27750.391186
18-0.147856-1.14530.128319
190.0398880.3090.379205
20-0.02097-0.16240.435756
210.1166120.90330.184998
22-0.035502-0.2750.392133
23-0.103575-0.80230.212775
24-0.101032-0.78260.218472
25-0.105285-0.81550.208996
26-0.082097-0.63590.263624
270.0741230.57420.284006
28-0.01725-0.13360.447075
29-0.014546-0.11270.455333
30-0.03643-0.28220.389388
310.0460190.35650.361373
32-0.105662-0.81850.208169
33-0.132439-1.02590.154536
340.0915780.70940.240424
35-0.086748-0.67190.252099
360.0223680.17330.431513
37-0.03983-0.30850.379376
380.0328870.25470.399897
390.0234280.18150.428304
400.004730.03660.485448
41-0.029145-0.22580.41108
420.1038180.80420.212236
43-0.156142-1.20950.115612
440.0084180.06520.474115
450.0462770.35850.360628
460.0108170.08380.466752
47-0.005871-0.04550.481938
48-0.153951-1.19250.11888

\begin{tabular}{lllllllll}
\hline
Partial Autocorrelation Function \tabularnewline
Time lag k & PACF(k) & T-STAT & P-value \tabularnewline
1 & 0.25584 & 1.9817 & 0.026048 \tabularnewline
2 & -0.068859 & -0.5334 & 0.297872 \tabularnewline
3 & 0.211396 & 1.6375 & 0.053384 \tabularnewline
4 & 0.064099 & 0.4965 & 0.310675 \tabularnewline
5 & 0.350076 & 2.7117 & 0.00436 \tabularnewline
6 & 0.18661 & 1.4455 & 0.076764 \tabularnewline
7 & 0.19526 & 1.5125 & 0.067831 \tabularnewline
8 & -0.149574 & -1.1586 & 0.125606 \tabularnewline
9 & -0.160344 & -1.242 & 0.109531 \tabularnewline
10 & -0.532987 & -4.1285 & 5.7e-05 \tabularnewline
11 & -0.167004 & -1.2936 & 0.10038 \tabularnewline
12 & 0.361094 & 2.797 & 0.003461 \tabularnewline
13 & 0.034223 & 0.2651 & 0.395924 \tabularnewline
14 & -0.035057 & -0.2716 & 0.393449 \tabularnewline
15 & -0.129128 & -1.0002 & 0.160611 \tabularnewline
16 & 0.064624 & 0.5006 & 0.309251 \tabularnewline
17 & -0.035822 & -0.2775 & 0.391186 \tabularnewline
18 & -0.147856 & -1.1453 & 0.128319 \tabularnewline
19 & 0.039888 & 0.309 & 0.379205 \tabularnewline
20 & -0.02097 & -0.1624 & 0.435756 \tabularnewline
21 & 0.116612 & 0.9033 & 0.184998 \tabularnewline
22 & -0.035502 & -0.275 & 0.392133 \tabularnewline
23 & -0.103575 & -0.8023 & 0.212775 \tabularnewline
24 & -0.101032 & -0.7826 & 0.218472 \tabularnewline
25 & -0.105285 & -0.8155 & 0.208996 \tabularnewline
26 & -0.082097 & -0.6359 & 0.263624 \tabularnewline
27 & 0.074123 & 0.5742 & 0.284006 \tabularnewline
28 & -0.01725 & -0.1336 & 0.447075 \tabularnewline
29 & -0.014546 & -0.1127 & 0.455333 \tabularnewline
30 & -0.03643 & -0.2822 & 0.389388 \tabularnewline
31 & 0.046019 & 0.3565 & 0.361373 \tabularnewline
32 & -0.105662 & -0.8185 & 0.208169 \tabularnewline
33 & -0.132439 & -1.0259 & 0.154536 \tabularnewline
34 & 0.091578 & 0.7094 & 0.240424 \tabularnewline
35 & -0.086748 & -0.6719 & 0.252099 \tabularnewline
36 & 0.022368 & 0.1733 & 0.431513 \tabularnewline
37 & -0.03983 & -0.3085 & 0.379376 \tabularnewline
38 & 0.032887 & 0.2547 & 0.399897 \tabularnewline
39 & 0.023428 & 0.1815 & 0.428304 \tabularnewline
40 & 0.00473 & 0.0366 & 0.485448 \tabularnewline
41 & -0.029145 & -0.2258 & 0.41108 \tabularnewline
42 & 0.103818 & 0.8042 & 0.212236 \tabularnewline
43 & -0.156142 & -1.2095 & 0.115612 \tabularnewline
44 & 0.008418 & 0.0652 & 0.474115 \tabularnewline
45 & 0.046277 & 0.3585 & 0.360628 \tabularnewline
46 & 0.010817 & 0.0838 & 0.466752 \tabularnewline
47 & -0.005871 & -0.0455 & 0.481938 \tabularnewline
48 & -0.153951 & -1.1925 & 0.11888 \tabularnewline
\hline
\end{tabular}
%Source: https://freestatistics.org/blog/index.php?pk=112799&T=2

[TABLE]
[ROW][C]Partial Autocorrelation Function[/C][/ROW]
[ROW][C]Time lag k[/C][C]PACF(k)[/C][C]T-STAT[/C][C]P-value[/C][/ROW]
[ROW][C]1[/C][C]0.25584[/C][C]1.9817[/C][C]0.026048[/C][/ROW]
[ROW][C]2[/C][C]-0.068859[/C][C]-0.5334[/C][C]0.297872[/C][/ROW]
[ROW][C]3[/C][C]0.211396[/C][C]1.6375[/C][C]0.053384[/C][/ROW]
[ROW][C]4[/C][C]0.064099[/C][C]0.4965[/C][C]0.310675[/C][/ROW]
[ROW][C]5[/C][C]0.350076[/C][C]2.7117[/C][C]0.00436[/C][/ROW]
[ROW][C]6[/C][C]0.18661[/C][C]1.4455[/C][C]0.076764[/C][/ROW]
[ROW][C]7[/C][C]0.19526[/C][C]1.5125[/C][C]0.067831[/C][/ROW]
[ROW][C]8[/C][C]-0.149574[/C][C]-1.1586[/C][C]0.125606[/C][/ROW]
[ROW][C]9[/C][C]-0.160344[/C][C]-1.242[/C][C]0.109531[/C][/ROW]
[ROW][C]10[/C][C]-0.532987[/C][C]-4.1285[/C][C]5.7e-05[/C][/ROW]
[ROW][C]11[/C][C]-0.167004[/C][C]-1.2936[/C][C]0.10038[/C][/ROW]
[ROW][C]12[/C][C]0.361094[/C][C]2.797[/C][C]0.003461[/C][/ROW]
[ROW][C]13[/C][C]0.034223[/C][C]0.2651[/C][C]0.395924[/C][/ROW]
[ROW][C]14[/C][C]-0.035057[/C][C]-0.2716[/C][C]0.393449[/C][/ROW]
[ROW][C]15[/C][C]-0.129128[/C][C]-1.0002[/C][C]0.160611[/C][/ROW]
[ROW][C]16[/C][C]0.064624[/C][C]0.5006[/C][C]0.309251[/C][/ROW]
[ROW][C]17[/C][C]-0.035822[/C][C]-0.2775[/C][C]0.391186[/C][/ROW]
[ROW][C]18[/C][C]-0.147856[/C][C]-1.1453[/C][C]0.128319[/C][/ROW]
[ROW][C]19[/C][C]0.039888[/C][C]0.309[/C][C]0.379205[/C][/ROW]
[ROW][C]20[/C][C]-0.02097[/C][C]-0.1624[/C][C]0.435756[/C][/ROW]
[ROW][C]21[/C][C]0.116612[/C][C]0.9033[/C][C]0.184998[/C][/ROW]
[ROW][C]22[/C][C]-0.035502[/C][C]-0.275[/C][C]0.392133[/C][/ROW]
[ROW][C]23[/C][C]-0.103575[/C][C]-0.8023[/C][C]0.212775[/C][/ROW]
[ROW][C]24[/C][C]-0.101032[/C][C]-0.7826[/C][C]0.218472[/C][/ROW]
[ROW][C]25[/C][C]-0.105285[/C][C]-0.8155[/C][C]0.208996[/C][/ROW]
[ROW][C]26[/C][C]-0.082097[/C][C]-0.6359[/C][C]0.263624[/C][/ROW]
[ROW][C]27[/C][C]0.074123[/C][C]0.5742[/C][C]0.284006[/C][/ROW]
[ROW][C]28[/C][C]-0.01725[/C][C]-0.1336[/C][C]0.447075[/C][/ROW]
[ROW][C]29[/C][C]-0.014546[/C][C]-0.1127[/C][C]0.455333[/C][/ROW]
[ROW][C]30[/C][C]-0.03643[/C][C]-0.2822[/C][C]0.389388[/C][/ROW]
[ROW][C]31[/C][C]0.046019[/C][C]0.3565[/C][C]0.361373[/C][/ROW]
[ROW][C]32[/C][C]-0.105662[/C][C]-0.8185[/C][C]0.208169[/C][/ROW]
[ROW][C]33[/C][C]-0.132439[/C][C]-1.0259[/C][C]0.154536[/C][/ROW]
[ROW][C]34[/C][C]0.091578[/C][C]0.7094[/C][C]0.240424[/C][/ROW]
[ROW][C]35[/C][C]-0.086748[/C][C]-0.6719[/C][C]0.252099[/C][/ROW]
[ROW][C]36[/C][C]0.022368[/C][C]0.1733[/C][C]0.431513[/C][/ROW]
[ROW][C]37[/C][C]-0.03983[/C][C]-0.3085[/C][C]0.379376[/C][/ROW]
[ROW][C]38[/C][C]0.032887[/C][C]0.2547[/C][C]0.399897[/C][/ROW]
[ROW][C]39[/C][C]0.023428[/C][C]0.1815[/C][C]0.428304[/C][/ROW]
[ROW][C]40[/C][C]0.00473[/C][C]0.0366[/C][C]0.485448[/C][/ROW]
[ROW][C]41[/C][C]-0.029145[/C][C]-0.2258[/C][C]0.41108[/C][/ROW]
[ROW][C]42[/C][C]0.103818[/C][C]0.8042[/C][C]0.212236[/C][/ROW]
[ROW][C]43[/C][C]-0.156142[/C][C]-1.2095[/C][C]0.115612[/C][/ROW]
[ROW][C]44[/C][C]0.008418[/C][C]0.0652[/C][C]0.474115[/C][/ROW]
[ROW][C]45[/C][C]0.046277[/C][C]0.3585[/C][C]0.360628[/C][/ROW]
[ROW][C]46[/C][C]0.010817[/C][C]0.0838[/C][C]0.466752[/C][/ROW]
[ROW][C]47[/C][C]-0.005871[/C][C]-0.0455[/C][C]0.481938[/C][/ROW]
[ROW][C]48[/C][C]-0.153951[/C][C]-1.1925[/C][C]0.11888[/C][/ROW]
[/TABLE]
Source: https://freestatistics.org/blog/index.php?pk=112799&T=2

Globally Unique Identifier (entire table): ba.freestatistics.org/blog/index.php?pk=112799&T=2

As an alternative you can also use a QR Code:  

The GUIDs for individual cells are displayed in the table below:

Partial Autocorrelation Function
Time lag kPACF(k)T-STATP-value
10.255841.98170.026048
2-0.068859-0.53340.297872
30.2113961.63750.053384
40.0640990.49650.310675
50.3500762.71170.00436
60.186611.44550.076764
70.195261.51250.067831
8-0.149574-1.15860.125606
9-0.160344-1.2420.109531
10-0.532987-4.12855.7e-05
11-0.167004-1.29360.10038
120.3610942.7970.003461
130.0342230.26510.395924
14-0.035057-0.27160.393449
15-0.129128-1.00020.160611
160.0646240.50060.309251
17-0.035822-0.27750.391186
18-0.147856-1.14530.128319
190.0398880.3090.379205
20-0.02097-0.16240.435756
210.1166120.90330.184998
22-0.035502-0.2750.392133
23-0.103575-0.80230.212775
24-0.101032-0.78260.218472
25-0.105285-0.81550.208996
26-0.082097-0.63590.263624
270.0741230.57420.284006
28-0.01725-0.13360.447075
29-0.014546-0.11270.455333
30-0.03643-0.28220.389388
310.0460190.35650.361373
32-0.105662-0.81850.208169
33-0.132439-1.02590.154536
340.0915780.70940.240424
35-0.086748-0.67190.252099
360.0223680.17330.431513
37-0.03983-0.30850.379376
380.0328870.25470.399897
390.0234280.18150.428304
400.004730.03660.485448
41-0.029145-0.22580.41108
420.1038180.80420.212236
43-0.156142-1.20950.115612
440.0084180.06520.474115
450.0462770.35850.360628
460.0108170.08380.466752
47-0.005871-0.04550.481938
48-0.153951-1.19250.11888


Parameters (Session):
par1 = 48 ; par2 = 1 ; par3 = 0 ; par4 = 0 ; par5 = 12 ; par6 = White Noise ; par7 = 0.95 ;
Parameters (R input):
par1 = 48 ; par2 = 1 ; par3 = 0 ; par4 = 0 ; par5 = 12 ; par6 = White Noise ; par7 = 0.95 ; par8 = ;
R code (references can be found in the software module):
if (par1 == 'Default') {
par1 = 10*log10(length(x))
} else {
par1 <- as.numeric(par1)
}
par2 <- as.numeric(par2)
par3 <- as.numeric(par3)
par4 <- as.numeric(par4)
par5 <- as.numeric(par5)
if (par6 == 'White Noise') par6 <- 'white' else par6 <- 'ma'
par7 <- as.numeric(par7)
if (par8 != '') par8 <- as.numeric(par8)
ox <- x
if (par8 == '') {
if (par2 == 0) {
x <- log(x)
} else {
x <- (x ^ par2 - 1) / par2
}
} else {
x <- log(x,base=par8)
}
if (par3 > 0) x <- diff(x,lag=1,difference=par3)
if (par4 > 0) x <- diff(x,lag=par5,difference=par4)
bitmap(file='picts.png')
op <- par(mfrow=c(2,1))
plot(ox,type='l',main='Original Time Series',xlab='time',ylab='value')
if (par8=='') {
mytitle <- paste('Working Time Series (lambda=',par2,', d=',par3,', D=',par4,')',sep='')
mysub <- paste('(lambda=',par2,', d=',par3,', D=',par4,', CI=', par7, ', CI type=',par6,')',sep='')
} else {
mytitle <- paste('Working Time Series (base=',par8,', d=',par3,', D=',par4,')',sep='')
mysub <- paste('(base=',par8,', d=',par3,', D=',par4,', CI=', par7, ', CI type=',par6,')',sep='')
}
plot(x,type='l', main=mytitle,xlab='time',ylab='value')
par(op)
dev.off()
bitmap(file='pic1.png')
racf <- acf(x, par1, main='Autocorrelation', xlab='time lag', ylab='ACF', ci.type=par6, ci=par7, sub=mysub)
dev.off()
bitmap(file='pic2.png')
rpacf <- pacf(x,par1,main='Partial Autocorrelation',xlab='lags',ylab='PACF',sub=mysub)
dev.off()
(myacf <- c(racf$acf))
(mypacf <- c(rpacf$acf))
lengthx <- length(x)
sqrtn <- sqrt(lengthx)
load(file='createtable')
a<-table.start()
a<-table.row.start(a)
a<-table.element(a,'Autocorrelation Function',4,TRUE)
a<-table.row.end(a)
a<-table.row.start(a)
a<-table.element(a,'Time lag k',header=TRUE)
a<-table.element(a,hyperlink('basics.htm','ACF(k)','click here for more information about the Autocorrelation Function'),header=TRUE)
a<-table.element(a,'T-STAT',header=TRUE)
a<-table.element(a,'P-value',header=TRUE)
a<-table.row.end(a)
for (i in 2:(par1+1)) {
a<-table.row.start(a)
a<-table.element(a,i-1,header=TRUE)
a<-table.element(a,round(myacf[i],6))
mytstat <- myacf[i]*sqrtn
a<-table.element(a,round(mytstat,4))
a<-table.element(a,round(1-pt(abs(mytstat),lengthx),6))
a<-table.row.end(a)
}
a<-table.end(a)
table.save(a,file='mytable.tab')
a<-table.start()
a<-table.row.start(a)
a<-table.element(a,'Partial Autocorrelation Function',4,TRUE)
a<-table.row.end(a)
a<-table.row.start(a)
a<-table.element(a,'Time lag k',header=TRUE)
a<-table.element(a,hyperlink('basics.htm','PACF(k)','click here for more information about the Partial Autocorrelation Function'),header=TRUE)
a<-table.element(a,'T-STAT',header=TRUE)
a<-table.element(a,'P-value',header=TRUE)
a<-table.row.end(a)
for (i in 1:par1) {
a<-table.row.start(a)
a<-table.element(a,i,header=TRUE)
a<-table.element(a,round(mypacf[i],6))
mytstat <- mypacf[i]*sqrtn
a<-table.element(a,round(mytstat,4))
a<-table.element(a,round(1-pt(abs(mytstat),lengthx),6))
a<-table.row.end(a)
}
a<-table.end(a)
table.save(a,file='mytable1.tab')