| Multiple Linear Regression - Estimated Regression Equation |
| gemiddeldeprijzenbadpakken[t] = + 41.53925 + 0.121458333333354M1[t] + 0.112766666666666M2[t] + 0.156075000000000M3[t] + 0.189383333333332M4[t] + 0.132691666666666M5[t] + 0.169999999999999M6[t] + 0.139308333333333M7[t] + 0.0546166666666649M8[t] + 0.0700749999999968M9[t] + 0.0708833333333315M10[t] + 0.00919166666666658M11[t] -0.0433083333333335t + e[t] |
| Multiple Linear Regression - Ordinary Least Squares | |||||
| Variable | Parameter | S.D. | T-STAT H0: parameter = 0 | 2-tail p-value | 1-tail p-value |
| (Intercept) | 41.53925 | 0.191341 | 217.0959 | 0 | 0 |
| M1 | 0.121458333333354 | 0.230051 | 0.528 | 0.60024 | 0.30012 |
| M2 | 0.112766666666666 | 0.229892 | 0.4905 | 0.62626 | 0.31313 |
| M3 | 0.156075000000000 | 0.229768 | 0.6793 | 0.500606 | 0.250303 |
| M4 | 0.189383333333332 | 0.229679 | 0.8246 | 0.414175 | 0.207088 |
| M5 | 0.132691666666666 | 0.229626 | 0.5779 | 0.566373 | 0.283187 |
| M6 | 0.169999999999999 | 0.229609 | 0.7404 | 0.463087 | 0.231544 |
| M7 | 0.139308333333333 | 0.229626 | 0.6067 | 0.547257 | 0.273629 |
| M8 | 0.0546166666666649 | 0.229679 | 0.2378 | 0.813169 | 0.406585 |
| M9 | 0.0700749999999968 | 0.24218 | 0.2894 | 0.773703 | 0.386852 |
| M10 | 0.0708833333333315 | 0.242096 | 0.2928 | 0.771091 | 0.385545 |
| M11 | 0.00919166666666658 | 0.242046 | 0.038 | 0.969883 | 0.484942 |
| t | -0.0433083333333335 | 0.002852 | -15.1835 | 0 | 0 |
| Multiple Linear Regression - Regression Statistics | |
| Multiple R | 0.919967633767587 |
| R-squared | 0.846340447179933 |
| Adjusted R-squared | 0.803458711509217 |
| F-TEST (value) | 19.7366182581526 |
| F-TEST (DF numerator) | 12 |
| F-TEST (DF denominator) | 43 |
| p-value | 1.07025499573865e-13 |
| Multiple Linear Regression - Residual Statistics | |
| Residual Standard Deviation | 0.342280348850622 |
| Sum Squared Residuals | 5.03770100000004 |
| Multiple Linear Regression - Actuals, Interpolation, and Residuals | |||
| Time or Index | Actuals | Interpolation Forecast | Residuals Prediction Error |
| 1 | 41.85 | 41.6173999999999 | 0.232600000000088 |
| 2 | 41.75 | 41.5654 | 0.184599999999994 |
| 3 | 41.75 | 41.5654 | 0.184599999999995 |
| 4 | 41.75 | 41.5554 | 0.194599999999995 |
| 5 | 41.58 | 41.4554 | 0.124599999999994 |
| 6 | 41.61 | 41.4494 | 0.160599999999995 |
| 7 | 41.42 | 41.3754 | 0.0445999999999968 |
| 8 | 41.37 | 41.2474 | 0.122599999999994 |
| 9 | 41.37 | 41.21955 | 0.150449999999996 |
| 10 | 41.33 | 41.17705 | 0.152949999999996 |
| 11 | 41.37 | 41.07205 | 0.297949999999994 |
| 12 | 41.34 | 41.01955 | 0.320449999999999 |
| 13 | 41.33 | 41.0977 | 0.232299999999975 |
| 14 | 41.29 | 41.0457 | 0.244299999999996 |
| 15 | 41.29 | 41.0457 | 0.244299999999996 |
| 16 | 41.27 | 41.0357 | 0.234300000000001 |
| 17 | 41.04 | 40.9357 | 0.104299999999997 |
| 18 | 40.9 | 40.9297 | -0.0297000000000033 |
| 19 | 40.89 | 40.8557 | 0.0342999999999982 |
| 20 | 40.72 | 40.7277 | -0.00770000000000201 |
| 21 | 40.72 | 40.69985 | 0.0201499999999998 |
| 22 | 40.58 | 40.65735 | -0.077350000000002 |
| 23 | 40.24 | 40.55235 | -0.31235 |
| 24 | 40.07 | 40.49985 | -0.429850000000001 |
| 25 | 40.12 | 40.578 | -0.458000000000024 |
| 26 | 40.1 | 40.526 | -0.425999999999999 |
| 27 | 40.1 | 40.526 | -0.425999999999999 |
| 28 | 40.08 | 40.516 | -0.436000000000001 |
| 29 | 40.06 | 40.416 | -0.355999999999997 |
| 30 | 39.99 | 40.41 | -0.419999999999997 |
| 31 | 40.05 | 40.336 | -0.286000000000003 |
| 32 | 39.66 | 40.208 | -0.548000000000001 |
| 33 | 39.66 | 40.18015 | -0.52015 |
| 34 | 39.67 | 40.13765 | -0.467649999999996 |
| 35 | 39.56 | 40.03265 | -0.472649999999997 |
| 36 | 39.64 | 39.98015 | -0.340149999999999 |
| 37 | 39.73 | 40.0583 | -0.328300000000022 |
| 38 | 39.7 | 40.0063 | -0.306299999999995 |
| 39 | 39.7 | 40.0063 | -0.306299999999995 |
| 40 | 39.68 | 39.9963 | -0.316299999999997 |
| 41 | 39.76 | 39.8963 | -0.136299999999999 |
| 42 | 40 | 39.8903 | 0.109700000000003 |
| 43 | 39.96 | 39.8163 | 0.143700000000003 |
| 44 | 40.01 | 39.6883 | 0.321700000000002 |
| 45 | 40.01 | 39.66045 | 0.349550000000004 |
| 46 | 40.01 | 39.61795 | 0.392050000000002 |
| 47 | 40 | 39.51295 | 0.487050000000003 |
| 48 | 39.91 | 39.46045 | 0.44955 |
| 49 | 39.86 | 39.5386 | 0.321399999999983 |
| 50 | 39.79 | 39.4866 | 0.303400000000004 |
| 51 | 39.79 | 39.4866 | 0.303400000000004 |
| 52 | 39.8 | 39.4766 | 0.323400000000003 |
| 53 | 39.64 | 39.3766 | 0.263400000000006 |
| 54 | 39.55 | 39.3706 | 0.179400000000002 |
| 55 | 39.36 | 39.2966 | 0.0634000000000042 |
| 56 | 39.28 | 39.1686 | 0.111400000000007 |
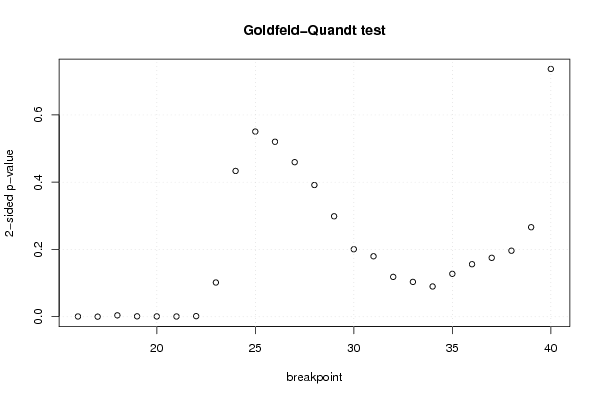
| Goldfeld-Quandt test for Heteroskedasticity | |||
| p-values | Alternative Hypothesis | ||
| breakpoint index | greater | 2-sided | less |
| 16 | 0.00039342827010935 | 0.0007868565402187 | 0.99960657172989 |
| 17 | 0.000123362266319973 | 0.000246724532639946 | 0.99987663773368 |
| 18 | 0.0020884940083054 | 0.0041769880166108 | 0.997911505991695 |
| 19 | 0.000609167816193236 | 0.00121833563238647 | 0.999390832183807 |
| 20 | 0.000496753609987868 | 0.000993507219975735 | 0.999503246390012 |
| 21 | 0.000384018564594441 | 0.000768037129188882 | 0.999615981435406 |
| 22 | 0.000856861729174772 | 0.00171372345834954 | 0.999143138270825 |
| 23 | 0.0508731567264582 | 0.101746313452916 | 0.949126843273542 |
| 24 | 0.216694591111066 | 0.433389182222133 | 0.783305408888934 |
| 25 | 0.275211443203321 | 0.550422886406643 | 0.724788556796679 |
| 26 | 0.260045374756192 | 0.520090749512385 | 0.739954625243808 |
| 27 | 0.229737248209992 | 0.459474496419985 | 0.770262751790008 |
| 28 | 0.195763356674383 | 0.391526713348766 | 0.804236643325617 |
| 29 | 0.149311955010410 | 0.298623910020819 | 0.85068804498959 |
| 30 | 0.100336825164653 | 0.200673650329307 | 0.899663174835347 |
| 31 | 0.089872918252011 | 0.179745836504022 | 0.91012708174799 |
| 32 | 0.0592491553809919 | 0.118498310761984 | 0.940750844619008 |
| 33 | 0.0517857704510463 | 0.103571540902093 | 0.948214229548954 |
| 34 | 0.0449860909185432 | 0.0899721818370864 | 0.955013909081457 |
| 35 | 0.0637863438649914 | 0.127572687729983 | 0.936213656135009 |
| 36 | 0.0780815044045799 | 0.156163008809160 | 0.92191849559542 |
| 37 | 0.0875534091886235 | 0.175106818377247 | 0.912446590811376 |
| 38 | 0.098130715220206 | 0.196261430440412 | 0.901869284779794 |
| 39 | 0.133039187653022 | 0.266078375306044 | 0.866960812346978 |
| 40 | 0.368288093832719 | 0.736576187665438 | 0.631711906167281 |
| Meta Analysis of Goldfeld-Quandt test for Heteroskedasticity | |||
| Description | # significant tests | % significant tests | OK/NOK |
| 1% type I error level | 7 | 0.28 | NOK |
| 5% type I error level | 7 | 0.28 | NOK |
| 10% type I error level | 8 | 0.32 | NOK |