Free Statistics

of Irreproducible Research!

Author's title

Author*The author of this computation has been verified*
R Software Modulerwasp_univariatedataseries.wasp
Title produced by softwareUnivariate Data Series
Date of computationSun, 19 Dec 2010 17:24:30 +0000
Cite this page as followsStatistical Computations at FreeStatistics.org, Office for Research Development and Education, URL https://freestatistics.org/blog/index.php?v=date/2010/Dec/19/t1292779406f3mezuvugrzxove.htm/, Retrieved Sun, 05 May 2024 01:47:55 +0000
Statistical Computations at FreeStatistics.org, Office for Research Development and Education, URL https://freestatistics.org/blog/index.php?pk=112651, Retrieved Sun, 05 May 2024 01:47:55 +0000
QR Codes:

Original text written by user:
IsPrivate?No (this computation is public)
User-defined keywords
Estimated Impact110
Family? (F = Feedback message, R = changed R code, M = changed R Module, P = changed Parameters, D = changed Data)
-       [Univariate Data Series] [Geboren Kinderen] [2010-12-19 17:24:30] [3f56c8f677e988de577e4e00a8180a48] [Current]
Feedback Forum

Post a new message
Dataseries X:
17153
15579
16755
16585
16572
16325
17913
17572
17338
17087
15864
15554
16229
15180
16215
15801
15751
16477
17324
16919
16438
16239
15613
15821
15678
14671
15876
15563
15711
15583
16405
16701
16194
16024
14728
14776
15399
14286
15646
14543
15673
15171
15999
16260
16123
16144
15005
14806
15019
13909
15211
14385
15144
14659
15989
16262
16021
15662
14531
14544
15071
14236
14771
14804
15597
15418
16903
16350
16393
15685
14556
14850
15391
13704
15409
15098
15254
15522
16669
16238
16246
15424
14952
15008


Summary of computational transaction
Raw Inputview raw input (R code)
Raw Outputview raw output of R engine
Computing time1 seconds
R Server'Gwilym Jenkins' @ 72.249.127.135

\begin{tabular}{lllllllll}
\hline
Summary of computational transaction \tabularnewline
Raw Input & view raw input (R code)  \tabularnewline
Raw Output & view raw output of R engine  \tabularnewline
Computing time & 1 seconds \tabularnewline
R Server & 'Gwilym Jenkins' @ 72.249.127.135 \tabularnewline
\hline
\end{tabular}
%Source: https://freestatistics.org/blog/index.php?pk=112651&T=0

[TABLE]
[ROW][C]Summary of computational transaction[/C][/ROW]
[ROW][C]Raw Input[/C][C]view raw input (R code) [/C][/ROW]
[ROW][C]Raw Output[/C][C]view raw output of R engine [/C][/ROW]
[ROW][C]Computing time[/C][C]1 seconds[/C][/ROW]
[ROW][C]R Server[/C][C]'Gwilym Jenkins' @ 72.249.127.135[/C][/ROW]
[/TABLE]
Source: https://freestatistics.org/blog/index.php?pk=112651&T=0

Globally Unique Identifier (entire table): ba.freestatistics.org/blog/index.php?pk=112651&T=0

As an alternative you can also use a QR Code:  

The GUIDs for individual cells are displayed in the table below:

Summary of computational transaction
Raw Inputview raw input (R code)
Raw Outputview raw output of R engine
Computing time1 seconds
R Server'Gwilym Jenkins' @ 72.249.127.135


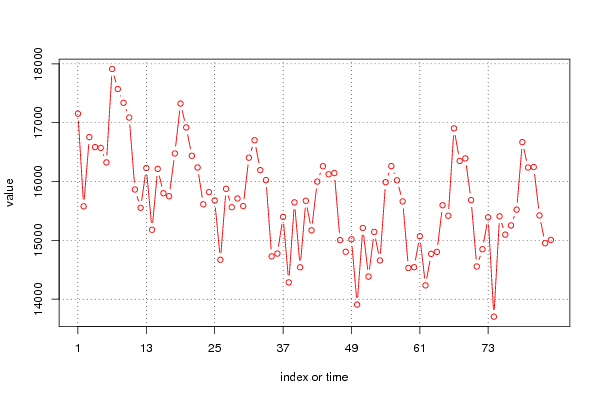
Univariate Dataseries
Name of dataseriesGeboren kinderen
Source
Description
Number of observations84

\begin{tabular}{lllllllll}
\hline
Univariate Dataseries \tabularnewline
Name of dataseries & Geboren kinderen \tabularnewline
Source &  \tabularnewline
Description &  \tabularnewline
Number of observations & 84 \tabularnewline
\hline
\end{tabular}
%Source: https://freestatistics.org/blog/index.php?pk=112651&T=1

[TABLE]
[ROW][C]Univariate Dataseries[/C][/ROW]
[ROW][C]Name of dataseries[/C][C]Geboren kinderen[/C][/ROW]
[ROW][C]Source[/C][C][/C][/ROW]
[ROW][C]Description[/C][C][/C][/ROW]
[ROW][C]Number of observations[/C][C]84[/C][/ROW]
[/TABLE]
Source: https://freestatistics.org/blog/index.php?pk=112651&T=1

Globally Unique Identifier (entire table): ba.freestatistics.org/blog/index.php?pk=112651&T=1

As an alternative you can also use a QR Code:  

The GUIDs for individual cells are displayed in the table below:

Univariate Dataseries
Name of dataseriesGeboren kinderen
Source
Description
Number of observations84


Parameters (Session):
par1 = Geboren kinderen ; par4 = 12 ;
Parameters (R input):
par1 = Geboren kinderen ; par2 = ; par3 = ; par4 = 12 ;
R code (references can be found in the software module):
if (par4 != 'No season') {
par4 <- as.numeric(par4)
if (par4 < 4) par4 <- 12
}
summary(x)
n <- length(x)
bitmap(file='test1.png')
if (par4=='No season') {
plot(x,col=2,type='b',main=main,xlab=xlab,ylab=ylab,xaxt='n')
axis(1,at=seq(1,n,10))
}
if (par4!='No season') {
plot(x,col=2,type='b',main=main,xlab=xlab,ylab=ylab,xaxt='n')
axis(1,at=seq(1,n,par4))
grid(nx=0,ny=NULL,col='black')
abline(v=seq(1,n,par4),col='black',lty='dotted')
}
dev.off()
load(file='createtable')
a<-table.start()
a<-table.row.start(a)
a<-table.element(a,'Univariate Dataseries',2,TRUE)
a<-table.row.end(a)
a<-table.row.start(a)
a<-table.element(a,'Name of dataseries',header=TRUE)
a<-table.element(a,par1)
a<-table.row.end(a)
a<-table.row.start(a)
a<-table.element(a,'Source',header=TRUE)
a<-table.element(a,par2)
a<-table.row.end(a)
a<-table.row.start(a)
a<-table.element(a,'Description',header=TRUE)
a<-table.element(a,par3)
a<-table.row.end(a)
a<-table.row.start(a)
a<-table.element(a,'Number of observations',header=TRUE)
a<-table.element(a,length(x))
a<-table.row.end(a)
a<-table.end(a)
table.save(a,file='mytable.tab')