Free Statistics

of Irreproducible Research!

Author's title

Author*The author of this computation has been verified*
R Software Modulerwasp_correlation.wasp
Title produced by softwarePearson Correlation
Date of computationSun, 19 Dec 2010 16:41:44 +0000
Cite this page as followsStatistical Computations at FreeStatistics.org, Office for Research Development and Education, URL https://freestatistics.org/blog/index.php?v=date/2010/Dec/19/t1292776783osftf9j629zqel1.htm/, Retrieved Sat, 04 May 2024 22:23:05 +0000
Statistical Computations at FreeStatistics.org, Office for Research Development and Education, URL https://freestatistics.org/blog/index.php?pk=112603, Retrieved Sat, 04 May 2024 22:23:05 +0000
QR Codes:

Original text written by user:
IsPrivate?No (this computation is public)
User-defined keywords
Estimated Impact102
Family? (F = Feedback message, R = changed R code, M = changed R Module, P = changed Parameters, D = changed Data)
-       [Pearson Correlation] [] [2010-12-19 16:41:44] [c1585b71a1b15294a02e0a160577aa4f] [Current]
Feedback Forum

Post a new message
Dataseries X:
144.328
140.449
138.198
125.253
138.765
120.267
119.424
110.221
116.166
96.329
127.473
105.827
133.359
134.376
158.139
136.565
159.957
146.358
Dataseries Y:
177.217
161.628
162.385
169.226
154.420
155.950
146.036
151.158
143.706
135.291
160.492
145.987
174.048
147.193
158.791
173.778
176.659
163.882


Summary of computational transaction
Raw Inputview raw input (R code)
Raw Outputview raw output of R engine
Computing time1 seconds
R Server'George Udny Yule' @ 72.249.76.132

\begin{tabular}{lllllllll}
\hline
Summary of computational transaction \tabularnewline
Raw Input & view raw input (R code)  \tabularnewline
Raw Output & view raw output of R engine  \tabularnewline
Computing time & 1 seconds \tabularnewline
R Server & 'George Udny Yule' @ 72.249.76.132 \tabularnewline
\hline
\end{tabular}
%Source: https://freestatistics.org/blog/index.php?pk=112603&T=0

[TABLE]
[ROW][C]Summary of computational transaction[/C][/ROW]
[ROW][C]Raw Input[/C][C]view raw input (R code) [/C][/ROW]
[ROW][C]Raw Output[/C][C]view raw output of R engine [/C][/ROW]
[ROW][C]Computing time[/C][C]1 seconds[/C][/ROW]
[ROW][C]R Server[/C][C]'George Udny Yule' @ 72.249.76.132[/C][/ROW]
[/TABLE]
Source: https://freestatistics.org/blog/index.php?pk=112603&T=0

Globally Unique Identifier (entire table): ba.freestatistics.org/blog/index.php?pk=112603&T=0

As an alternative you can also use a QR Code:  

The GUIDs for individual cells are displayed in the table below:

Summary of computational transaction
Raw Inputview raw input (R code)
Raw Outputview raw output of R engine
Computing time1 seconds
R Server'George Udny Yule' @ 72.249.76.132


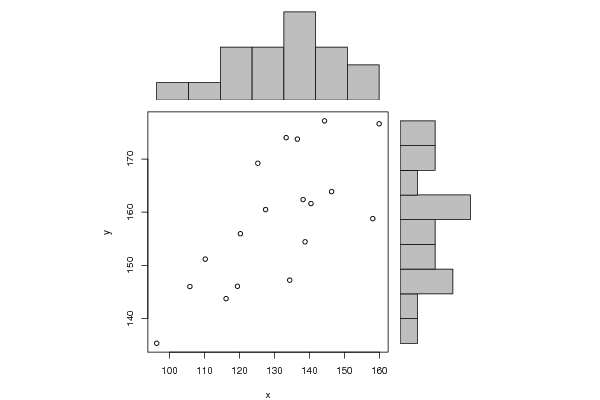
Pearson Product Moment Correlation - Ungrouped Data
StatisticVariable XVariable Y
Mean130.636333333333158.769277777778
Biased Variance278.762179888889144.512212089506
Biased Standard Deviation16.696172611975712.0213232253985
Covariance151.273001078431
Correlation0.711817463558768
Determination0.506684101427238
T-Test4.05383505569819
p-value (2 sided)0.000921651444141469
p-value (1 sided)0.000460825722070735
Degrees of Freedom16
Number of Observations18

\begin{tabular}{lllllllll}
\hline
Pearson Product Moment Correlation - Ungrouped Data \tabularnewline
Statistic & Variable X & Variable Y \tabularnewline
Mean & 130.636333333333 & 158.769277777778 \tabularnewline
Biased Variance & 278.762179888889 & 144.512212089506 \tabularnewline
Biased Standard Deviation & 16.6961726119757 & 12.0213232253985 \tabularnewline
Covariance & 151.273001078431 \tabularnewline
Correlation & 0.711817463558768 \tabularnewline
Determination & 0.506684101427238 \tabularnewline
T-Test & 4.05383505569819 \tabularnewline
p-value (2 sided) & 0.000921651444141469 \tabularnewline
p-value (1 sided) & 0.000460825722070735 \tabularnewline
Degrees of Freedom & 16 \tabularnewline
Number of Observations & 18 \tabularnewline
\hline
\end{tabular}
%Source: https://freestatistics.org/blog/index.php?pk=112603&T=1

[TABLE]
[ROW][C]Pearson Product Moment Correlation - Ungrouped Data[/C][/ROW]
[ROW][C]Statistic[/C][C]Variable X[/C][C]Variable Y[/C][/ROW]
[ROW][C]Mean[/C][C]130.636333333333[/C][C]158.769277777778[/C][/ROW]
[ROW][C]Biased Variance[/C][C]278.762179888889[/C][C]144.512212089506[/C][/ROW]
[ROW][C]Biased Standard Deviation[/C][C]16.6961726119757[/C][C]12.0213232253985[/C][/ROW]
[ROW][C]Covariance[/C][C]151.273001078431[/C][/ROW]
[ROW][C]Correlation[/C][C]0.711817463558768[/C][/ROW]
[ROW][C]Determination[/C][C]0.506684101427238[/C][/ROW]
[ROW][C]T-Test[/C][C]4.05383505569819[/C][/ROW]
[ROW][C]p-value (2 sided)[/C][C]0.000921651444141469[/C][/ROW]
[ROW][C]p-value (1 sided)[/C][C]0.000460825722070735[/C][/ROW]
[ROW][C]Degrees of Freedom[/C][C]16[/C][/ROW]
[ROW][C]Number of Observations[/C][C]18[/C][/ROW]
[/TABLE]
Source: https://freestatistics.org/blog/index.php?pk=112603&T=1

Globally Unique Identifier (entire table): ba.freestatistics.org/blog/index.php?pk=112603&T=1

As an alternative you can also use a QR Code:  

The GUIDs for individual cells are displayed in the table below:

Pearson Product Moment Correlation - Ungrouped Data
StatisticVariable XVariable Y
Mean130.636333333333158.769277777778
Biased Variance278.762179888889144.512212089506
Biased Standard Deviation16.696172611975712.0213232253985
Covariance151.273001078431
Correlation0.711817463558768
Determination0.506684101427238
T-Test4.05383505569819
p-value (2 sided)0.000921651444141469
p-value (1 sided)0.000460825722070735
Degrees of Freedom16
Number of Observations18


Parameters (Session):
Parameters (R input):
R code (references can be found in the software module):
bitmap(file='test1.png')
histx <- hist(x, plot=FALSE)
histy <- hist(y, plot=FALSE)
maxcounts <- max(c(histx$counts, histx$counts))
xrange <- c(min(x),max(x))
yrange <- c(min(y),max(y))
nf <- layout(matrix(c(2,0,1,3),2,2,byrow=TRUE), c(3,1), c(1,3), TRUE)
par(mar=c(4,4,1,1))
plot(x, y, xlim=xrange, ylim=yrange, xlab=xlab, ylab=ylab)
par(mar=c(0,4,1,1))
barplot(histx$counts, axes=FALSE, ylim=c(0, maxcounts), space=0)
par(mar=c(4,0,1,1))
barplot(histy$counts, axes=FALSE, xlim=c(0, maxcounts), space=0, horiz=TRUE)
dev.off()
lx = length(x)
makebiased = (lx-1)/lx
varx = var(x)*makebiased
vary = var(y)*makebiased
corxy <- cor.test(x,y,method='pearson')
cxy <- as.matrix(corxy$estimate)[1,1]
load(file='createtable')
a<-table.start()
a<-table.row.start(a)
a<-table.element(a,'Pearson Product Moment Correlation - Ungrouped Data',3,TRUE)
a<-table.row.end(a)
a<-table.row.start(a)
a<-table.element(a,'Statistic',1,TRUE)
a<-table.element(a,'Variable X',1,TRUE)
a<-table.element(a,'Variable Y',1,TRUE)
a<-table.row.end(a)
a<-table.row.start(a)
a<-table.element(a,hyperlink('arithmetic_mean.htm','Mean',''),header=TRUE)
a<-table.element(a,mean(x))
a<-table.element(a,mean(y))
a<-table.row.end(a)
a<-table.row.start(a)
a<-table.element(a,hyperlink('biased.htm','Biased Variance',''),header=TRUE)
a<-table.element(a,varx)
a<-table.element(a,vary)
a<-table.row.end(a)
a<-table.row.start(a)
a<-table.element(a,hyperlink('biased1.htm','Biased Standard Deviation',''),header=TRUE)
a<-table.element(a,sqrt(varx))
a<-table.element(a,sqrt(vary))
a<-table.row.end(a)
a<-table.row.start(a)
a<-table.element(a,hyperlink('covariance.htm','Covariance',''),header=TRUE)
a<-table.element(a,cov(x,y),2)
a<-table.row.end(a)
a<-table.row.start(a)
a<-table.element(a,hyperlink('pearson_correlation.htm','Correlation',''),header=TRUE)
a<-table.element(a,cxy,2)
a<-table.row.end(a)
a<-table.row.start(a)
a<-table.element(a,hyperlink('coeff_of_determination.htm','Determination',''),header=TRUE)
a<-table.element(a,cxy*cxy,2)
a<-table.row.end(a)
a<-table.row.start(a)
a<-table.element(a,hyperlink('ttest_statistic.htm','T-Test',''),header=TRUE)
a<-table.element(a,as.matrix(corxy$statistic)[1,1],2)
a<-table.row.end(a)
a<-table.row.start(a)
a<-table.element(a,'p-value (2 sided)',header=TRUE)
a<-table.element(a,(p2 <- as.matrix(corxy$p.value)[1,1]),2)
a<-table.row.end(a)
a<-table.row.start(a)
a<-table.element(a,'p-value (1 sided)',header=TRUE)
a<-table.element(a,p2/2,2)
a<-table.row.end(a)
a<-table.row.start(a)
a<-table.element(a,'Degrees of Freedom',header=TRUE)
a<-table.element(a,lx-2,2)
a<-table.row.end(a)
a<-table.row.start(a)
a<-table.element(a,'Number of Observations',header=TRUE)
a<-table.element(a,lx,2)
a<-table.row.end(a)
a<-table.end(a)
table.save(a,file='mytable.tab')