Free Statistics

of Irreproducible Research!

Author's title

Author*The author of this computation has been verified*
R Software Modulerwasp_autocorrelation.wasp
Title produced by software(Partial) Autocorrelation Function
Date of computationSun, 19 Dec 2010 16:25:45 +0000
Cite this page as followsStatistical Computations at FreeStatistics.org, Office for Research Development and Education, URL https://freestatistics.org/blog/index.php?v=date/2010/Dec/19/t129277588075bux1koen2yqce.htm/, Retrieved Sun, 05 May 2024 08:32:44 +0000
Statistical Computations at FreeStatistics.org, Office for Research Development and Education, URL https://freestatistics.org/blog/index.php?pk=112580, Retrieved Sun, 05 May 2024 08:32:44 +0000
QR Codes:

Original text written by user:
IsPrivate?No (this computation is public)
User-defined keywords
Estimated Impact176
Family? (F = Feedback message, R = changed R code, M = changed R Module, P = changed Parameters, D = changed Data)
-     [(Partial) Autocorrelation Function] [] [2010-12-19 15:36:55] [1ad9dd03b6c5806e9fe90049663fcef1]
-   P     [(Partial) Autocorrelation Function] [] [2010-12-19 16:25:45] [020d6ac062bd52f65e15713212085515] [Current]
Feedback Forum

Post a new message
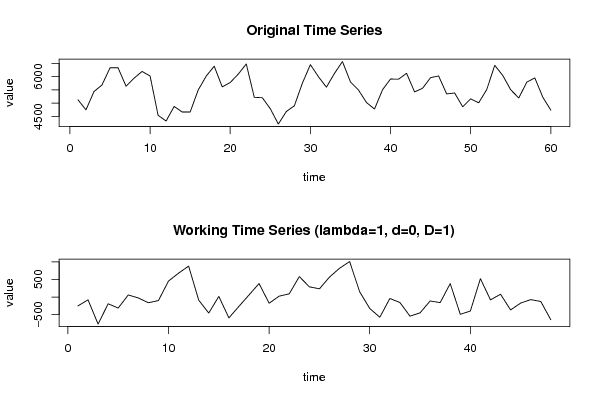
Dataseries X:
5124
4742
5434
5684
6332
6334
5636
5940
6195
6022
4535
4320
4872
4662
4663
5491
6018
6393
5610
5777
6094
6478
5216
5201
4784
4205
4681
4896
5752
6452
5995
5601
6119
6569
5798
5492
5018
4773
5502
5908
5902
6125
5419
5559
5962
6023
5346
5379
4859
5156
5010
5508
6426
6043
5499
5191
5790
5949
5219
4729


Summary of computational transaction
Raw Inputview raw input (R code)
Raw Outputview raw output of R engine
Computing time2 seconds
R Server'RServer@AstonUniversity' @ vre.aston.ac.uk

\begin{tabular}{lllllllll}
\hline
Summary of computational transaction \tabularnewline
Raw Input & view raw input (R code)  \tabularnewline
Raw Output & view raw output of R engine  \tabularnewline
Computing time & 2 seconds \tabularnewline
R Server & 'RServer@AstonUniversity' @ vre.aston.ac.uk \tabularnewline
\hline
\end{tabular}
%Source: https://freestatistics.org/blog/index.php?pk=112580&T=0

[TABLE]
[ROW][C]Summary of computational transaction[/C][/ROW]
[ROW][C]Raw Input[/C][C]view raw input (R code) [/C][/ROW]
[ROW][C]Raw Output[/C][C]view raw output of R engine [/C][/ROW]
[ROW][C]Computing time[/C][C]2 seconds[/C][/ROW]
[ROW][C]R Server[/C][C]'RServer@AstonUniversity' @ vre.aston.ac.uk[/C][/ROW]
[/TABLE]
Source: https://freestatistics.org/blog/index.php?pk=112580&T=0

Globally Unique Identifier (entire table): ba.freestatistics.org/blog/index.php?pk=112580&T=0

As an alternative you can also use a QR Code:  

The GUIDs for individual cells are displayed in the table below:

Summary of computational transaction
Raw Inputview raw input (R code)
Raw Outputview raw output of R engine
Computing time2 seconds
R Server'RServer@AstonUniversity' @ vre.aston.ac.uk


Autocorrelation Function
Time lag kACF(k)T-STATP-value
10.4290572.97260.002303
20.1623061.12450.133198
30.0194950.13510.446564
40.0522720.36220.359413
50.0199190.1380.445408
6-0.157589-1.09180.140183
7-0.325169-2.25280.014439
8-0.158602-1.09880.138662
9-0.070511-0.48850.313704
10-0.130098-0.90130.185952
11-0.084472-0.58520.280565
12-0.109552-0.7590.225782
130.1566771.08550.141564
140.1620281.12260.133604
150.2122371.47040.073986
160.1202570.83320.20444
170.1936971.3420.092959
180.0332240.23020.409465
19-0.115929-0.80320.212915
20-0.23611-1.63580.05421
21-0.22117-1.53230.066006
22-0.185893-1.28790.101977
23-0.187414-1.29840.100169
24-0.232902-1.61360.056586
25-0.236995-1.64190.053569
260.0295330.20460.41937
27-0.036285-0.25140.401294
280.0284840.19730.422195
290.0049280.03410.486453
300.0891770.61780.269803
310.1495951.03640.152598
320.0757060.52450.301169
33-0.0358-0.2480.402584
340.0260110.18020.428874
35-0.022904-0.15870.437293
36-0.042422-0.29390.385046
37-0.03847-0.26650.395487
38-0.074608-0.51690.3038
390.030220.20940.417522
40-0.000529-0.00370.498547
410.0383210.26550.395881
420.0130130.09020.46427
430.0416650.28870.387042
440.0284380.1970.422322
450.0611150.42340.33694
460.0078620.05450.478393
470.0181860.1260.450129
48NANANA
49NANANA
50NANANA
51NANANA
52NANANA
53NANANA
54NANANA
55NANANA
56NANANA
57NANANA
58NANANA
59NANANA
60NANANA

\begin{tabular}{lllllllll}
\hline
Autocorrelation Function \tabularnewline
Time lag k & ACF(k) & T-STAT & P-value \tabularnewline
1 & 0.429057 & 2.9726 & 0.002303 \tabularnewline
2 & 0.162306 & 1.1245 & 0.133198 \tabularnewline
3 & 0.019495 & 0.1351 & 0.446564 \tabularnewline
4 & 0.052272 & 0.3622 & 0.359413 \tabularnewline
5 & 0.019919 & 0.138 & 0.445408 \tabularnewline
6 & -0.157589 & -1.0918 & 0.140183 \tabularnewline
7 & -0.325169 & -2.2528 & 0.014439 \tabularnewline
8 & -0.158602 & -1.0988 & 0.138662 \tabularnewline
9 & -0.070511 & -0.4885 & 0.313704 \tabularnewline
10 & -0.130098 & -0.9013 & 0.185952 \tabularnewline
11 & -0.084472 & -0.5852 & 0.280565 \tabularnewline
12 & -0.109552 & -0.759 & 0.225782 \tabularnewline
13 & 0.156677 & 1.0855 & 0.141564 \tabularnewline
14 & 0.162028 & 1.1226 & 0.133604 \tabularnewline
15 & 0.212237 & 1.4704 & 0.073986 \tabularnewline
16 & 0.120257 & 0.8332 & 0.20444 \tabularnewline
17 & 0.193697 & 1.342 & 0.092959 \tabularnewline
18 & 0.033224 & 0.2302 & 0.409465 \tabularnewline
19 & -0.115929 & -0.8032 & 0.212915 \tabularnewline
20 & -0.23611 & -1.6358 & 0.05421 \tabularnewline
21 & -0.22117 & -1.5323 & 0.066006 \tabularnewline
22 & -0.185893 & -1.2879 & 0.101977 \tabularnewline
23 & -0.187414 & -1.2984 & 0.100169 \tabularnewline
24 & -0.232902 & -1.6136 & 0.056586 \tabularnewline
25 & -0.236995 & -1.6419 & 0.053569 \tabularnewline
26 & 0.029533 & 0.2046 & 0.41937 \tabularnewline
27 & -0.036285 & -0.2514 & 0.401294 \tabularnewline
28 & 0.028484 & 0.1973 & 0.422195 \tabularnewline
29 & 0.004928 & 0.0341 & 0.486453 \tabularnewline
30 & 0.089177 & 0.6178 & 0.269803 \tabularnewline
31 & 0.149595 & 1.0364 & 0.152598 \tabularnewline
32 & 0.075706 & 0.5245 & 0.301169 \tabularnewline
33 & -0.0358 & -0.248 & 0.402584 \tabularnewline
34 & 0.026011 & 0.1802 & 0.428874 \tabularnewline
35 & -0.022904 & -0.1587 & 0.437293 \tabularnewline
36 & -0.042422 & -0.2939 & 0.385046 \tabularnewline
37 & -0.03847 & -0.2665 & 0.395487 \tabularnewline
38 & -0.074608 & -0.5169 & 0.3038 \tabularnewline
39 & 0.03022 & 0.2094 & 0.417522 \tabularnewline
40 & -0.000529 & -0.0037 & 0.498547 \tabularnewline
41 & 0.038321 & 0.2655 & 0.395881 \tabularnewline
42 & 0.013013 & 0.0902 & 0.46427 \tabularnewline
43 & 0.041665 & 0.2887 & 0.387042 \tabularnewline
44 & 0.028438 & 0.197 & 0.422322 \tabularnewline
45 & 0.061115 & 0.4234 & 0.33694 \tabularnewline
46 & 0.007862 & 0.0545 & 0.478393 \tabularnewline
47 & 0.018186 & 0.126 & 0.450129 \tabularnewline
48 & NA & NA & NA \tabularnewline
49 & NA & NA & NA \tabularnewline
50 & NA & NA & NA \tabularnewline
51 & NA & NA & NA \tabularnewline
52 & NA & NA & NA \tabularnewline
53 & NA & NA & NA \tabularnewline
54 & NA & NA & NA \tabularnewline
55 & NA & NA & NA \tabularnewline
56 & NA & NA & NA \tabularnewline
57 & NA & NA & NA \tabularnewline
58 & NA & NA & NA \tabularnewline
59 & NA & NA & NA \tabularnewline
60 & NA & NA & NA \tabularnewline
\hline
\end{tabular}
%Source: https://freestatistics.org/blog/index.php?pk=112580&T=1

[TABLE]
[ROW][C]Autocorrelation Function[/C][/ROW]
[ROW][C]Time lag k[/C][C]ACF(k)[/C][C]T-STAT[/C][C]P-value[/C][/ROW]
[ROW][C]1[/C][C]0.429057[/C][C]2.9726[/C][C]0.002303[/C][/ROW]
[ROW][C]2[/C][C]0.162306[/C][C]1.1245[/C][C]0.133198[/C][/ROW]
[ROW][C]3[/C][C]0.019495[/C][C]0.1351[/C][C]0.446564[/C][/ROW]
[ROW][C]4[/C][C]0.052272[/C][C]0.3622[/C][C]0.359413[/C][/ROW]
[ROW][C]5[/C][C]0.019919[/C][C]0.138[/C][C]0.445408[/C][/ROW]
[ROW][C]6[/C][C]-0.157589[/C][C]-1.0918[/C][C]0.140183[/C][/ROW]
[ROW][C]7[/C][C]-0.325169[/C][C]-2.2528[/C][C]0.014439[/C][/ROW]
[ROW][C]8[/C][C]-0.158602[/C][C]-1.0988[/C][C]0.138662[/C][/ROW]
[ROW][C]9[/C][C]-0.070511[/C][C]-0.4885[/C][C]0.313704[/C][/ROW]
[ROW][C]10[/C][C]-0.130098[/C][C]-0.9013[/C][C]0.185952[/C][/ROW]
[ROW][C]11[/C][C]-0.084472[/C][C]-0.5852[/C][C]0.280565[/C][/ROW]
[ROW][C]12[/C][C]-0.109552[/C][C]-0.759[/C][C]0.225782[/C][/ROW]
[ROW][C]13[/C][C]0.156677[/C][C]1.0855[/C][C]0.141564[/C][/ROW]
[ROW][C]14[/C][C]0.162028[/C][C]1.1226[/C][C]0.133604[/C][/ROW]
[ROW][C]15[/C][C]0.212237[/C][C]1.4704[/C][C]0.073986[/C][/ROW]
[ROW][C]16[/C][C]0.120257[/C][C]0.8332[/C][C]0.20444[/C][/ROW]
[ROW][C]17[/C][C]0.193697[/C][C]1.342[/C][C]0.092959[/C][/ROW]
[ROW][C]18[/C][C]0.033224[/C][C]0.2302[/C][C]0.409465[/C][/ROW]
[ROW][C]19[/C][C]-0.115929[/C][C]-0.8032[/C][C]0.212915[/C][/ROW]
[ROW][C]20[/C][C]-0.23611[/C][C]-1.6358[/C][C]0.05421[/C][/ROW]
[ROW][C]21[/C][C]-0.22117[/C][C]-1.5323[/C][C]0.066006[/C][/ROW]
[ROW][C]22[/C][C]-0.185893[/C][C]-1.2879[/C][C]0.101977[/C][/ROW]
[ROW][C]23[/C][C]-0.187414[/C][C]-1.2984[/C][C]0.100169[/C][/ROW]
[ROW][C]24[/C][C]-0.232902[/C][C]-1.6136[/C][C]0.056586[/C][/ROW]
[ROW][C]25[/C][C]-0.236995[/C][C]-1.6419[/C][C]0.053569[/C][/ROW]
[ROW][C]26[/C][C]0.029533[/C][C]0.2046[/C][C]0.41937[/C][/ROW]
[ROW][C]27[/C][C]-0.036285[/C][C]-0.2514[/C][C]0.401294[/C][/ROW]
[ROW][C]28[/C][C]0.028484[/C][C]0.1973[/C][C]0.422195[/C][/ROW]
[ROW][C]29[/C][C]0.004928[/C][C]0.0341[/C][C]0.486453[/C][/ROW]
[ROW][C]30[/C][C]0.089177[/C][C]0.6178[/C][C]0.269803[/C][/ROW]
[ROW][C]31[/C][C]0.149595[/C][C]1.0364[/C][C]0.152598[/C][/ROW]
[ROW][C]32[/C][C]0.075706[/C][C]0.5245[/C][C]0.301169[/C][/ROW]
[ROW][C]33[/C][C]-0.0358[/C][C]-0.248[/C][C]0.402584[/C][/ROW]
[ROW][C]34[/C][C]0.026011[/C][C]0.1802[/C][C]0.428874[/C][/ROW]
[ROW][C]35[/C][C]-0.022904[/C][C]-0.1587[/C][C]0.437293[/C][/ROW]
[ROW][C]36[/C][C]-0.042422[/C][C]-0.2939[/C][C]0.385046[/C][/ROW]
[ROW][C]37[/C][C]-0.03847[/C][C]-0.2665[/C][C]0.395487[/C][/ROW]
[ROW][C]38[/C][C]-0.074608[/C][C]-0.5169[/C][C]0.3038[/C][/ROW]
[ROW][C]39[/C][C]0.03022[/C][C]0.2094[/C][C]0.417522[/C][/ROW]
[ROW][C]40[/C][C]-0.000529[/C][C]-0.0037[/C][C]0.498547[/C][/ROW]
[ROW][C]41[/C][C]0.038321[/C][C]0.2655[/C][C]0.395881[/C][/ROW]
[ROW][C]42[/C][C]0.013013[/C][C]0.0902[/C][C]0.46427[/C][/ROW]
[ROW][C]43[/C][C]0.041665[/C][C]0.2887[/C][C]0.387042[/C][/ROW]
[ROW][C]44[/C][C]0.028438[/C][C]0.197[/C][C]0.422322[/C][/ROW]
[ROW][C]45[/C][C]0.061115[/C][C]0.4234[/C][C]0.33694[/C][/ROW]
[ROW][C]46[/C][C]0.007862[/C][C]0.0545[/C][C]0.478393[/C][/ROW]
[ROW][C]47[/C][C]0.018186[/C][C]0.126[/C][C]0.450129[/C][/ROW]
[ROW][C]48[/C][C]NA[/C][C]NA[/C][C]NA[/C][/ROW]
[ROW][C]49[/C][C]NA[/C][C]NA[/C][C]NA[/C][/ROW]
[ROW][C]50[/C][C]NA[/C][C]NA[/C][C]NA[/C][/ROW]
[ROW][C]51[/C][C]NA[/C][C]NA[/C][C]NA[/C][/ROW]
[ROW][C]52[/C][C]NA[/C][C]NA[/C][C]NA[/C][/ROW]
[ROW][C]53[/C][C]NA[/C][C]NA[/C][C]NA[/C][/ROW]
[ROW][C]54[/C][C]NA[/C][C]NA[/C][C]NA[/C][/ROW]
[ROW][C]55[/C][C]NA[/C][C]NA[/C][C]NA[/C][/ROW]
[ROW][C]56[/C][C]NA[/C][C]NA[/C][C]NA[/C][/ROW]
[ROW][C]57[/C][C]NA[/C][C]NA[/C][C]NA[/C][/ROW]
[ROW][C]58[/C][C]NA[/C][C]NA[/C][C]NA[/C][/ROW]
[ROW][C]59[/C][C]NA[/C][C]NA[/C][C]NA[/C][/ROW]
[ROW][C]60[/C][C]NA[/C][C]NA[/C][C]NA[/C][/ROW]
[/TABLE]
Source: https://freestatistics.org/blog/index.php?pk=112580&T=1

Globally Unique Identifier (entire table): ba.freestatistics.org/blog/index.php?pk=112580&T=1

As an alternative you can also use a QR Code:  

The GUIDs for individual cells are displayed in the table below:

Autocorrelation Function
Time lag kACF(k)T-STATP-value
10.4290572.97260.002303
20.1623061.12450.133198
30.0194950.13510.446564
40.0522720.36220.359413
50.0199190.1380.445408
6-0.157589-1.09180.140183
7-0.325169-2.25280.014439
8-0.158602-1.09880.138662
9-0.070511-0.48850.313704
10-0.130098-0.90130.185952
11-0.084472-0.58520.280565
12-0.109552-0.7590.225782
130.1566771.08550.141564
140.1620281.12260.133604
150.2122371.47040.073986
160.1202570.83320.20444
170.1936971.3420.092959
180.0332240.23020.409465
19-0.115929-0.80320.212915
20-0.23611-1.63580.05421
21-0.22117-1.53230.066006
22-0.185893-1.28790.101977
23-0.187414-1.29840.100169
24-0.232902-1.61360.056586
25-0.236995-1.64190.053569
260.0295330.20460.41937
27-0.036285-0.25140.401294
280.0284840.19730.422195
290.0049280.03410.486453
300.0891770.61780.269803
310.1495951.03640.152598
320.0757060.52450.301169
33-0.0358-0.2480.402584
340.0260110.18020.428874
35-0.022904-0.15870.437293
36-0.042422-0.29390.385046
37-0.03847-0.26650.395487
38-0.074608-0.51690.3038
390.030220.20940.417522
40-0.000529-0.00370.498547
410.0383210.26550.395881
420.0130130.09020.46427
430.0416650.28870.387042
440.0284380.1970.422322
450.0611150.42340.33694
460.0078620.05450.478393
470.0181860.1260.450129
48NANANA
49NANANA
50NANANA
51NANANA
52NANANA
53NANANA
54NANANA
55NANANA
56NANANA
57NANANA
58NANANA
59NANANA
60NANANA


Partial Autocorrelation Function
Time lag kPACF(k)T-STATP-value
10.4290572.97260.002303
2-0.026699-0.1850.427015
3-0.049732-0.34460.365967
40.0809360.56070.288791
5-0.029763-0.20620.418752
6-0.206803-1.43280.079202
7-0.225145-1.55980.062683
80.1147610.79510.215239
9-0.019215-0.13310.447326
10-0.16176-1.12070.133994
110.0801660.55540.290598
12-0.081853-0.56710.286646
130.1997561.3840.086388
14-0.043608-0.30210.381931
150.1790011.24020.110474
16-0.036632-0.25380.400368
170.1040920.72120.237151
18-0.178917-1.23960.110579
19-0.184199-1.27620.104019
20-0.048915-0.33890.368084
21-0.077599-0.53760.296661
22-0.051512-0.35690.36137
23-0.0278-0.19260.424041
24-0.093078-0.64490.261043
25-0.101546-0.70350.242563
260.1266740.87760.19226
27-0.162366-1.12490.133112
28-0.030659-0.21240.416344
29-0.000683-0.00470.498121
30-0.087694-0.60760.273171
31-0.019471-0.13490.446628
32-0.141661-0.98150.165644
330.065620.45460.325712
34-4.5e-05-3e-040.499877
35-0.033822-0.23430.407863
360.0447180.30980.379021
370.019480.1350.446604
380.0758040.52520.300936
39-0.06824-0.47280.319257
400.0129360.08960.464481
410.0259190.17960.429121
42-0.042551-0.29480.384708
43-0.109216-0.75670.226472
44-0.040663-0.28170.389683
450.0209770.14530.442528
46-0.086306-0.59790.276343
47-0.021482-0.14880.441154
48NANANA
49NANANA
50NANANA
51NANANA
52NANANA
53NANANA
54NANANA
55NANANA
56NANANA
57NANANA
58NANANA
59NANANA
60NANANA

\begin{tabular}{lllllllll}
\hline
Partial Autocorrelation Function \tabularnewline
Time lag k & PACF(k) & T-STAT & P-value \tabularnewline
1 & 0.429057 & 2.9726 & 0.002303 \tabularnewline
2 & -0.026699 & -0.185 & 0.427015 \tabularnewline
3 & -0.049732 & -0.3446 & 0.365967 \tabularnewline
4 & 0.080936 & 0.5607 & 0.288791 \tabularnewline
5 & -0.029763 & -0.2062 & 0.418752 \tabularnewline
6 & -0.206803 & -1.4328 & 0.079202 \tabularnewline
7 & -0.225145 & -1.5598 & 0.062683 \tabularnewline
8 & 0.114761 & 0.7951 & 0.215239 \tabularnewline
9 & -0.019215 & -0.1331 & 0.447326 \tabularnewline
10 & -0.16176 & -1.1207 & 0.133994 \tabularnewline
11 & 0.080166 & 0.5554 & 0.290598 \tabularnewline
12 & -0.081853 & -0.5671 & 0.286646 \tabularnewline
13 & 0.199756 & 1.384 & 0.086388 \tabularnewline
14 & -0.043608 & -0.3021 & 0.381931 \tabularnewline
15 & 0.179001 & 1.2402 & 0.110474 \tabularnewline
16 & -0.036632 & -0.2538 & 0.400368 \tabularnewline
17 & 0.104092 & 0.7212 & 0.237151 \tabularnewline
18 & -0.178917 & -1.2396 & 0.110579 \tabularnewline
19 & -0.184199 & -1.2762 & 0.104019 \tabularnewline
20 & -0.048915 & -0.3389 & 0.368084 \tabularnewline
21 & -0.077599 & -0.5376 & 0.296661 \tabularnewline
22 & -0.051512 & -0.3569 & 0.36137 \tabularnewline
23 & -0.0278 & -0.1926 & 0.424041 \tabularnewline
24 & -0.093078 & -0.6449 & 0.261043 \tabularnewline
25 & -0.101546 & -0.7035 & 0.242563 \tabularnewline
26 & 0.126674 & 0.8776 & 0.19226 \tabularnewline
27 & -0.162366 & -1.1249 & 0.133112 \tabularnewline
28 & -0.030659 & -0.2124 & 0.416344 \tabularnewline
29 & -0.000683 & -0.0047 & 0.498121 \tabularnewline
30 & -0.087694 & -0.6076 & 0.273171 \tabularnewline
31 & -0.019471 & -0.1349 & 0.446628 \tabularnewline
32 & -0.141661 & -0.9815 & 0.165644 \tabularnewline
33 & 0.06562 & 0.4546 & 0.325712 \tabularnewline
34 & -4.5e-05 & -3e-04 & 0.499877 \tabularnewline
35 & -0.033822 & -0.2343 & 0.407863 \tabularnewline
36 & 0.044718 & 0.3098 & 0.379021 \tabularnewline
37 & 0.01948 & 0.135 & 0.446604 \tabularnewline
38 & 0.075804 & 0.5252 & 0.300936 \tabularnewline
39 & -0.06824 & -0.4728 & 0.319257 \tabularnewline
40 & 0.012936 & 0.0896 & 0.464481 \tabularnewline
41 & 0.025919 & 0.1796 & 0.429121 \tabularnewline
42 & -0.042551 & -0.2948 & 0.384708 \tabularnewline
43 & -0.109216 & -0.7567 & 0.226472 \tabularnewline
44 & -0.040663 & -0.2817 & 0.389683 \tabularnewline
45 & 0.020977 & 0.1453 & 0.442528 \tabularnewline
46 & -0.086306 & -0.5979 & 0.276343 \tabularnewline
47 & -0.021482 & -0.1488 & 0.441154 \tabularnewline
48 & NA & NA & NA \tabularnewline
49 & NA & NA & NA \tabularnewline
50 & NA & NA & NA \tabularnewline
51 & NA & NA & NA \tabularnewline
52 & NA & NA & NA \tabularnewline
53 & NA & NA & NA \tabularnewline
54 & NA & NA & NA \tabularnewline
55 & NA & NA & NA \tabularnewline
56 & NA & NA & NA \tabularnewline
57 & NA & NA & NA \tabularnewline
58 & NA & NA & NA \tabularnewline
59 & NA & NA & NA \tabularnewline
60 & NA & NA & NA \tabularnewline
\hline
\end{tabular}
%Source: https://freestatistics.org/blog/index.php?pk=112580&T=2

[TABLE]
[ROW][C]Partial Autocorrelation Function[/C][/ROW]
[ROW][C]Time lag k[/C][C]PACF(k)[/C][C]T-STAT[/C][C]P-value[/C][/ROW]
[ROW][C]1[/C][C]0.429057[/C][C]2.9726[/C][C]0.002303[/C][/ROW]
[ROW][C]2[/C][C]-0.026699[/C][C]-0.185[/C][C]0.427015[/C][/ROW]
[ROW][C]3[/C][C]-0.049732[/C][C]-0.3446[/C][C]0.365967[/C][/ROW]
[ROW][C]4[/C][C]0.080936[/C][C]0.5607[/C][C]0.288791[/C][/ROW]
[ROW][C]5[/C][C]-0.029763[/C][C]-0.2062[/C][C]0.418752[/C][/ROW]
[ROW][C]6[/C][C]-0.206803[/C][C]-1.4328[/C][C]0.079202[/C][/ROW]
[ROW][C]7[/C][C]-0.225145[/C][C]-1.5598[/C][C]0.062683[/C][/ROW]
[ROW][C]8[/C][C]0.114761[/C][C]0.7951[/C][C]0.215239[/C][/ROW]
[ROW][C]9[/C][C]-0.019215[/C][C]-0.1331[/C][C]0.447326[/C][/ROW]
[ROW][C]10[/C][C]-0.16176[/C][C]-1.1207[/C][C]0.133994[/C][/ROW]
[ROW][C]11[/C][C]0.080166[/C][C]0.5554[/C][C]0.290598[/C][/ROW]
[ROW][C]12[/C][C]-0.081853[/C][C]-0.5671[/C][C]0.286646[/C][/ROW]
[ROW][C]13[/C][C]0.199756[/C][C]1.384[/C][C]0.086388[/C][/ROW]
[ROW][C]14[/C][C]-0.043608[/C][C]-0.3021[/C][C]0.381931[/C][/ROW]
[ROW][C]15[/C][C]0.179001[/C][C]1.2402[/C][C]0.110474[/C][/ROW]
[ROW][C]16[/C][C]-0.036632[/C][C]-0.2538[/C][C]0.400368[/C][/ROW]
[ROW][C]17[/C][C]0.104092[/C][C]0.7212[/C][C]0.237151[/C][/ROW]
[ROW][C]18[/C][C]-0.178917[/C][C]-1.2396[/C][C]0.110579[/C][/ROW]
[ROW][C]19[/C][C]-0.184199[/C][C]-1.2762[/C][C]0.104019[/C][/ROW]
[ROW][C]20[/C][C]-0.048915[/C][C]-0.3389[/C][C]0.368084[/C][/ROW]
[ROW][C]21[/C][C]-0.077599[/C][C]-0.5376[/C][C]0.296661[/C][/ROW]
[ROW][C]22[/C][C]-0.051512[/C][C]-0.3569[/C][C]0.36137[/C][/ROW]
[ROW][C]23[/C][C]-0.0278[/C][C]-0.1926[/C][C]0.424041[/C][/ROW]
[ROW][C]24[/C][C]-0.093078[/C][C]-0.6449[/C][C]0.261043[/C][/ROW]
[ROW][C]25[/C][C]-0.101546[/C][C]-0.7035[/C][C]0.242563[/C][/ROW]
[ROW][C]26[/C][C]0.126674[/C][C]0.8776[/C][C]0.19226[/C][/ROW]
[ROW][C]27[/C][C]-0.162366[/C][C]-1.1249[/C][C]0.133112[/C][/ROW]
[ROW][C]28[/C][C]-0.030659[/C][C]-0.2124[/C][C]0.416344[/C][/ROW]
[ROW][C]29[/C][C]-0.000683[/C][C]-0.0047[/C][C]0.498121[/C][/ROW]
[ROW][C]30[/C][C]-0.087694[/C][C]-0.6076[/C][C]0.273171[/C][/ROW]
[ROW][C]31[/C][C]-0.019471[/C][C]-0.1349[/C][C]0.446628[/C][/ROW]
[ROW][C]32[/C][C]-0.141661[/C][C]-0.9815[/C][C]0.165644[/C][/ROW]
[ROW][C]33[/C][C]0.06562[/C][C]0.4546[/C][C]0.325712[/C][/ROW]
[ROW][C]34[/C][C]-4.5e-05[/C][C]-3e-04[/C][C]0.499877[/C][/ROW]
[ROW][C]35[/C][C]-0.033822[/C][C]-0.2343[/C][C]0.407863[/C][/ROW]
[ROW][C]36[/C][C]0.044718[/C][C]0.3098[/C][C]0.379021[/C][/ROW]
[ROW][C]37[/C][C]0.01948[/C][C]0.135[/C][C]0.446604[/C][/ROW]
[ROW][C]38[/C][C]0.075804[/C][C]0.5252[/C][C]0.300936[/C][/ROW]
[ROW][C]39[/C][C]-0.06824[/C][C]-0.4728[/C][C]0.319257[/C][/ROW]
[ROW][C]40[/C][C]0.012936[/C][C]0.0896[/C][C]0.464481[/C][/ROW]
[ROW][C]41[/C][C]0.025919[/C][C]0.1796[/C][C]0.429121[/C][/ROW]
[ROW][C]42[/C][C]-0.042551[/C][C]-0.2948[/C][C]0.384708[/C][/ROW]
[ROW][C]43[/C][C]-0.109216[/C][C]-0.7567[/C][C]0.226472[/C][/ROW]
[ROW][C]44[/C][C]-0.040663[/C][C]-0.2817[/C][C]0.389683[/C][/ROW]
[ROW][C]45[/C][C]0.020977[/C][C]0.1453[/C][C]0.442528[/C][/ROW]
[ROW][C]46[/C][C]-0.086306[/C][C]-0.5979[/C][C]0.276343[/C][/ROW]
[ROW][C]47[/C][C]-0.021482[/C][C]-0.1488[/C][C]0.441154[/C][/ROW]
[ROW][C]48[/C][C]NA[/C][C]NA[/C][C]NA[/C][/ROW]
[ROW][C]49[/C][C]NA[/C][C]NA[/C][C]NA[/C][/ROW]
[ROW][C]50[/C][C]NA[/C][C]NA[/C][C]NA[/C][/ROW]
[ROW][C]51[/C][C]NA[/C][C]NA[/C][C]NA[/C][/ROW]
[ROW][C]52[/C][C]NA[/C][C]NA[/C][C]NA[/C][/ROW]
[ROW][C]53[/C][C]NA[/C][C]NA[/C][C]NA[/C][/ROW]
[ROW][C]54[/C][C]NA[/C][C]NA[/C][C]NA[/C][/ROW]
[ROW][C]55[/C][C]NA[/C][C]NA[/C][C]NA[/C][/ROW]
[ROW][C]56[/C][C]NA[/C][C]NA[/C][C]NA[/C][/ROW]
[ROW][C]57[/C][C]NA[/C][C]NA[/C][C]NA[/C][/ROW]
[ROW][C]58[/C][C]NA[/C][C]NA[/C][C]NA[/C][/ROW]
[ROW][C]59[/C][C]NA[/C][C]NA[/C][C]NA[/C][/ROW]
[ROW][C]60[/C][C]NA[/C][C]NA[/C][C]NA[/C][/ROW]
[/TABLE]
Source: https://freestatistics.org/blog/index.php?pk=112580&T=2

Globally Unique Identifier (entire table): ba.freestatistics.org/blog/index.php?pk=112580&T=2

As an alternative you can also use a QR Code:  

The GUIDs for individual cells are displayed in the table below:

Partial Autocorrelation Function
Time lag kPACF(k)T-STATP-value
10.4290572.97260.002303
2-0.026699-0.1850.427015
3-0.049732-0.34460.365967
40.0809360.56070.288791
5-0.029763-0.20620.418752
6-0.206803-1.43280.079202
7-0.225145-1.55980.062683
80.1147610.79510.215239
9-0.019215-0.13310.447326
10-0.16176-1.12070.133994
110.0801660.55540.290598
12-0.081853-0.56710.286646
130.1997561.3840.086388
14-0.043608-0.30210.381931
150.1790011.24020.110474
16-0.036632-0.25380.400368
170.1040920.72120.237151
18-0.178917-1.23960.110579
19-0.184199-1.27620.104019
20-0.048915-0.33890.368084
21-0.077599-0.53760.296661
22-0.051512-0.35690.36137
23-0.0278-0.19260.424041
24-0.093078-0.64490.261043
25-0.101546-0.70350.242563
260.1266740.87760.19226
27-0.162366-1.12490.133112
28-0.030659-0.21240.416344
29-0.000683-0.00470.498121
30-0.087694-0.60760.273171
31-0.019471-0.13490.446628
32-0.141661-0.98150.165644
330.065620.45460.325712
34-4.5e-05-3e-040.499877
35-0.033822-0.23430.407863
360.0447180.30980.379021
370.019480.1350.446604
380.0758040.52520.300936
39-0.06824-0.47280.319257
400.0129360.08960.464481
410.0259190.17960.429121
42-0.042551-0.29480.384708
43-0.109216-0.75670.226472
44-0.040663-0.28170.389683
450.0209770.14530.442528
46-0.086306-0.59790.276343
47-0.021482-0.14880.441154
48NANANA
49NANANA
50NANANA
51NANANA
52NANANA
53NANANA
54NANANA
55NANANA
56NANANA
57NANANA
58NANANA
59NANANA
60NANANA


Parameters (Session):
par1 = 60 ; par2 = 1 ; par3 = 0 ; par4 = 1 ; par5 = 12 ; par6 = White Noise ; par7 = 0.95 ;
Parameters (R input):
par1 = 60 ; par2 = 1 ; par3 = 0 ; par4 = 1 ; par5 = 12 ; par6 = White Noise ; par7 = 0.95 ; par8 = ;
R code (references can be found in the software module):
if (par1 == 'Default') {
par1 = 10*log10(length(x))
} else {
par1 <- as.numeric(par1)
}
par2 <- as.numeric(par2)
par3 <- as.numeric(par3)
par4 <- as.numeric(par4)
par5 <- as.numeric(par5)
if (par6 == 'White Noise') par6 <- 'white' else par6 <- 'ma'
par7 <- as.numeric(par7)
if (par8 != '') par8 <- as.numeric(par8)
ox <- x
if (par8 == '') {
if (par2 == 0) {
x <- log(x)
} else {
x <- (x ^ par2 - 1) / par2
}
} else {
x <- log(x,base=par8)
}
if (par3 > 0) x <- diff(x,lag=1,difference=par3)
if (par4 > 0) x <- diff(x,lag=par5,difference=par4)
bitmap(file='picts.png')
op <- par(mfrow=c(2,1))
plot(ox,type='l',main='Original Time Series',xlab='time',ylab='value')
if (par8=='') {
mytitle <- paste('Working Time Series (lambda=',par2,', d=',par3,', D=',par4,')',sep='')
mysub <- paste('(lambda=',par2,', d=',par3,', D=',par4,', CI=', par7, ', CI type=',par6,')',sep='')
} else {
mytitle <- paste('Working Time Series (base=',par8,', d=',par3,', D=',par4,')',sep='')
mysub <- paste('(base=',par8,', d=',par3,', D=',par4,', CI=', par7, ', CI type=',par6,')',sep='')
}
plot(x,type='l', main=mytitle,xlab='time',ylab='value')
par(op)
dev.off()
bitmap(file='pic1.png')
racf <- acf(x, par1, main='Autocorrelation', xlab='time lag', ylab='ACF', ci.type=par6, ci=par7, sub=mysub)
dev.off()
bitmap(file='pic2.png')
rpacf <- pacf(x,par1,main='Partial Autocorrelation',xlab='lags',ylab='PACF',sub=mysub)
dev.off()
(myacf <- c(racf$acf))
(mypacf <- c(rpacf$acf))
lengthx <- length(x)
sqrtn <- sqrt(lengthx)
load(file='createtable')
a<-table.start()
a<-table.row.start(a)
a<-table.element(a,'Autocorrelation Function',4,TRUE)
a<-table.row.end(a)
a<-table.row.start(a)
a<-table.element(a,'Time lag k',header=TRUE)
a<-table.element(a,hyperlink('basics.htm','ACF(k)','click here for more information about the Autocorrelation Function'),header=TRUE)
a<-table.element(a,'T-STAT',header=TRUE)
a<-table.element(a,'P-value',header=TRUE)
a<-table.row.end(a)
for (i in 2:(par1+1)) {
a<-table.row.start(a)
a<-table.element(a,i-1,header=TRUE)
a<-table.element(a,round(myacf[i],6))
mytstat <- myacf[i]*sqrtn
a<-table.element(a,round(mytstat,4))
a<-table.element(a,round(1-pt(abs(mytstat),lengthx),6))
a<-table.row.end(a)
}
a<-table.end(a)
table.save(a,file='mytable.tab')
a<-table.start()
a<-table.row.start(a)
a<-table.element(a,'Partial Autocorrelation Function',4,TRUE)
a<-table.row.end(a)
a<-table.row.start(a)
a<-table.element(a,'Time lag k',header=TRUE)
a<-table.element(a,hyperlink('basics.htm','PACF(k)','click here for more information about the Partial Autocorrelation Function'),header=TRUE)
a<-table.element(a,'T-STAT',header=TRUE)
a<-table.element(a,'P-value',header=TRUE)
a<-table.row.end(a)
for (i in 1:par1) {
a<-table.row.start(a)
a<-table.element(a,i,header=TRUE)
a<-table.element(a,round(mypacf[i],6))
mytstat <- mypacf[i]*sqrtn
a<-table.element(a,round(mytstat,4))
a<-table.element(a,round(1-pt(abs(mytstat),lengthx),6))
a<-table.row.end(a)
}
a<-table.end(a)
table.save(a,file='mytable1.tab')