| Multiple Linear Regression - Estimated Regression Equation |
| Brood[t] = + 86.2737357314676 + 0.0469329787978492Maand[t] + 0.140300419345309Trend[t] + 0.0119520172881480Tarwe[t] + 0.136581920664192Meel[t] + 0.0278949529470116Water[t] + e[t] |
| Multiple Linear Regression - Ordinary Least Squares | |||||
| Variable | Parameter | S.D. | T-STAT H0: parameter = 0 | 2-tail p-value | 1-tail p-value |
| (Intercept) | 86.2737357314676 | 13.330912 | 6.4717 | 0 | 0 |
| Maand | 0.0469329787978492 | 0.033617 | 1.3961 | 0.168728 | 0.084364 |
| Trend | 0.140300419345309 | 0.024151 | 5.8093 | 0 | 0 |
| Tarwe | 0.0119520172881480 | 0.002367 | 5.0487 | 6e-06 | 3e-06 |
| Meel | 0.136581920664192 | 0.016335 | 8.3611 | 0 | 0 |
| Water | 0.0278949529470116 | 0.139972 | 0.1993 | 0.842828 | 0.421414 |
| Multiple Linear Regression - Regression Statistics | |
| Multiple R | 0.990026897365883 |
| R-squared | 0.980153257507916 |
| Adjusted R-squared | 0.978207498440064 |
| F-TEST (value) | 503.738244730502 |
| F-TEST (DF numerator) | 5 |
| F-TEST (DF denominator) | 51 |
| p-value | 0 |
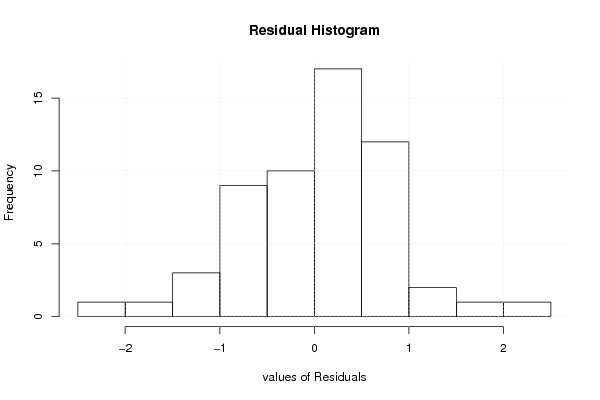
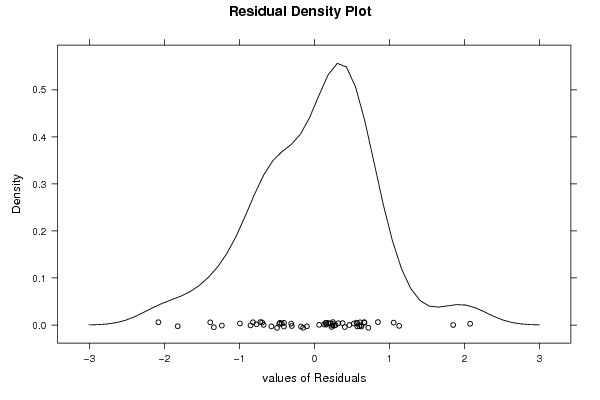
| Multiple Linear Regression - Residual Statistics | |
| Residual Standard Deviation | 0.831791597301993 |
| Sum Squared Residuals | 35.2857403284523 |
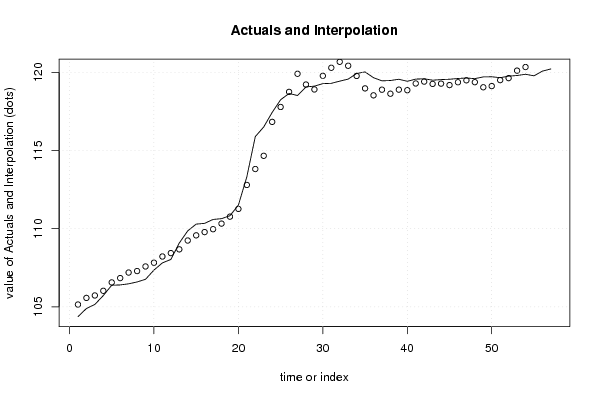
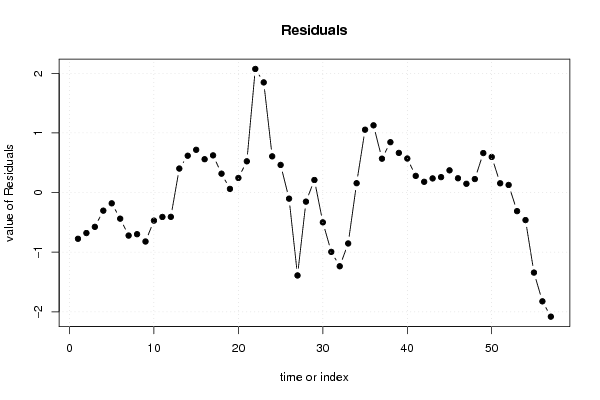
| Multiple Linear Regression - Actuals, Interpolation, and Residuals | |||
| Time or Index | Actuals | Interpolation Forecast | Residuals Prediction Error |
| 1 | 104.37 | 105.145565803095 | -0.775565803094795 |
| 2 | 104.89 | 105.569176213467 | -0.679176213466997 |
| 3 | 105.15 | 105.725427370921 | -0.575427370920542 |
| 4 | 105.72 | 106.023937037217 | -0.303937037217179 |
| 5 | 106.38 | 106.561044334310 | -0.181044334310126 |
| 6 | 106.4 | 106.838198061398 | -0.438198061397531 |
| 7 | 106.47 | 107.191684781414 | -0.721684781414306 |
| 8 | 106.59 | 107.288674503132 | -0.698674503131749 |
| 9 | 106.76 | 107.581409877818 | -0.82140987781762 |
| 10 | 107.35 | 107.821229954822 | -0.471229954822171 |
| 11 | 107.81 | 108.219208039872 | -0.409208039872416 |
| 12 | 108.03 | 108.437759353967 | -0.407759353966970 |
| 13 | 109.08 | 108.677299022744 | 0.402700977255563 |
| 14 | 109.86 | 109.242408812432 | 0.617591187568045 |
| 15 | 110.29 | 109.572753281956 | 0.717246718043745 |
| 16 | 110.34 | 109.781092651165 | 0.558907348834577 |
| 17 | 110.59 | 109.966323218716 | 0.623676781284248 |
| 18 | 110.64 | 110.323603347907 | 0.316396652093056 |
| 19 | 110.83 | 110.769120002638 | 0.0608799973616042 |
| 20 | 111.51 | 111.265063449242 | 0.244936550758131 |
| 21 | 113.32 | 112.796283362911 | 0.523716637088532 |
| 22 | 115.89 | 113.816568671522 | 2.07343132847756 |
| 23 | 116.51 | 114.662188244536 | 1.84781175546449 |
| 24 | 117.44 | 116.832841659594 | 0.6071583404062 |
| 25 | 118.25 | 117.786690802427 | 0.463309197573323 |
| 26 | 118.65 | 118.752455757907 | -0.102455757907064 |
| 27 | 118.52 | 119.910864359016 | -1.39086435901611 |
| 28 | 119.07 | 119.222444395898 | -0.152444395897871 |
| 29 | 119.12 | 118.909410002704 | 0.210589997296388 |
| 30 | 119.28 | 119.780067394395 | -0.500067394395126 |
| 31 | 119.3 | 120.295395313136 | -0.995395313136102 |
| 32 | 119.44 | 120.676531165521 | -1.23653116552148 |
| 33 | 119.57 | 120.424318149681 | -0.854318149680924 |
| 34 | 119.93 | 119.773342129457 | 0.156657870543317 |
| 35 | 120.03 | 118.975996574307 | 1.05400342569291 |
| 36 | 119.66 | 118.532674987929 | 1.12732501207087 |
| 37 | 119.46 | 118.891890974311 | 0.568109025688831 |
| 38 | 119.48 | 118.635211602429 | 0.84478839757137 |
| 39 | 119.56 | 118.894717980257 | 0.665282019743291 |
| 40 | 119.43 | 118.859380413315 | 0.570619586685042 |
| 41 | 119.57 | 119.290661257077 | 0.279338742922919 |
| 42 | 119.59 | 119.409574178347 | 0.180425821652910 |
| 43 | 119.5 | 119.262856169685 | 0.237143830315206 |
| 44 | 119.54 | 119.281437074797 | 0.258562925203140 |
| 45 | 119.56 | 119.187278753438 | 0.372721246562096 |
| 46 | 119.61 | 119.370429208077 | 0.239570791923080 |
| 47 | 119.64 | 119.492666139166 | 0.147333860834233 |
| 48 | 119.6 | 119.373615682524 | 0.226384317475989 |
| 49 | 119.71 | 119.047646323778 | 0.66235367622155 |
| 50 | 119.72 | 119.122860238803 | 0.597139761196748 |
| 51 | 119.66 | 119.504576605493 | 0.155423394507061 |
| 52 | 119.76 | 119.632573259386 | 0.127426740613803 |
| 53 | 119.8 | 120.111823314196 | -0.311823314196292 |
| 54 | 119.88 | 120.342021731695 | -0.462021731695 |
| 55 | 119.78 | 121.122715611642 | -1.34271561164224 |
| 56 | 120.08 | 121.904962255848 | -1.82496225584834 |
| 57 | 120.22 | 122.302049136561 | -2.08204913656087 |
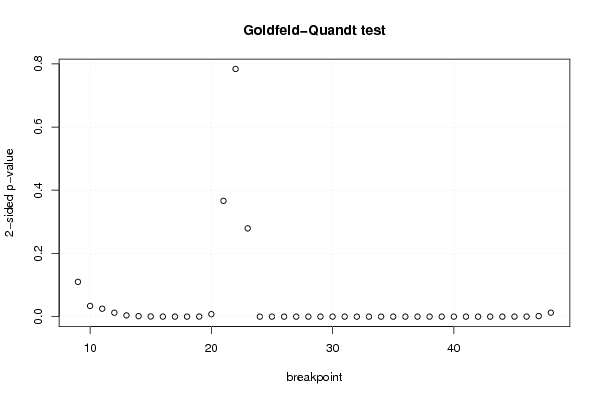
| Goldfeld-Quandt test for Heteroskedasticity | |||
| p-values | Alternative Hypothesis | ||
| breakpoint index | greater | 2-sided | less |
| 9 | 0.0550575586782799 | 0.110115117356560 | 0.94494244132172 |
| 10 | 0.0169701677790844 | 0.0339403355581687 | 0.983029832220916 |
| 11 | 0.0125536731703830 | 0.0251073463407661 | 0.987446326829617 |
| 12 | 0.00625798421548152 | 0.0125159684309630 | 0.993742015784518 |
| 13 | 0.0020334853641235 | 0.004066970728247 | 0.997966514635876 |
| 14 | 0.000755968930355649 | 0.00151193786071130 | 0.999244031069644 |
| 15 | 0.000284385173187904 | 0.000568770346375807 | 0.999715614826812 |
| 16 | 9.8821501049854e-05 | 0.000197643002099708 | 0.99990117849895 |
| 17 | 3.78605267089099e-05 | 7.57210534178198e-05 | 0.999962139473291 |
| 18 | 3.25076415995319e-05 | 6.50152831990637e-05 | 0.9999674923584 |
| 19 | 0.000182038534042769 | 0.000364077068085537 | 0.999817961465957 |
| 20 | 0.00390034974431261 | 0.00780069948862521 | 0.996099650255687 |
| 21 | 0.183193624662647 | 0.366387249325294 | 0.816806375337353 |
| 22 | 0.39187059460027 | 0.78374118920054 | 0.60812940539973 |
| 23 | 0.86036129998349 | 0.279277400033021 | 0.139638700016511 |
| 24 | 0.999988421601017 | 2.31567979667903e-05 | 1.15783989833952e-05 |
| 25 | 0.999999756588795 | 4.86822409450413e-07 | 2.43411204725206e-07 |
| 26 | 0.999999823014463 | 3.53971074895282e-07 | 1.76985537447641e-07 |
| 27 | 0.999999999182296 | 1.63540728488650e-09 | 8.17703642443248e-10 |
| 28 | 0.999999996708831 | 6.58233727334197e-09 | 3.29116863667099e-09 |
| 29 | 0.99999998873639 | 2.25272199547836e-08 | 1.12636099773918e-08 |
| 30 | 0.999999964430545 | 7.11389105865679e-08 | 3.55694552932840e-08 |
| 31 | 0.99999996419112 | 7.16177603627023e-08 | 3.58088801813511e-08 |
| 32 | 0.999999974426828 | 5.11463434041318e-08 | 2.55731717020659e-08 |
| 33 | 0.999999984582514 | 3.08349728975206e-08 | 1.54174864487603e-08 |
| 34 | 0.99999996766251 | 6.46749810209135e-08 | 3.23374905104567e-08 |
| 35 | 0.999999999988272 | 2.34553392907448e-11 | 1.17276696453724e-11 |
| 36 | 0.999999999998836 | 2.32867266970921e-12 | 1.16433633485460e-12 |
| 37 | 0.99999999998986 | 2.02790167012056e-11 | 1.01395083506028e-11 |
| 38 | 0.999999999915955 | 1.68089901524581e-10 | 8.40449507622904e-11 |
| 39 | 0.999999999802853 | 3.94294645621236e-10 | 1.97147322810618e-10 |
| 40 | 0.999999998946143 | 2.10771356126984e-09 | 1.05385678063492e-09 |
| 41 | 0.999999994702195 | 1.05956107182679e-08 | 5.29780535913394e-09 |
| 42 | 0.999999963598168 | 7.28036631610388e-08 | 3.64018315805194e-08 |
| 43 | 0.999999769829284 | 4.60341432793175e-07 | 2.30170716396587e-07 |
| 44 | 0.99999817330792 | 3.65338415838868e-06 | 1.82669207919434e-06 |
| 45 | 0.999984197639338 | 3.16047213247703e-05 | 1.58023606623851e-05 |
| 46 | 0.999877167920207 | 0.000245664159586575 | 0.000122832079793288 |
| 47 | 0.999113176950657 | 0.00177364609868612 | 0.000886823049343058 |
| 48 | 0.993649568149025 | 0.0127008637019498 | 0.00635043185097492 |
| Meta Analysis of Goldfeld-Quandt test for Heteroskedasticity | |||
| Description | # significant tests | % significant tests | OK/NOK |
| 1% type I error level | 32 | 0.8 | NOK |
| 5% type I error level | 36 | 0.9 | NOK |
| 10% type I error level | 36 | 0.9 | NOK |