Free Statistics
of Irreproducible Research!
Description of Statistical Computation | |||||||||||||||||||||||||||||||||||||||||||||||||||||||||||||||||||||||||||||||||||||||||||||||||||
|---|---|---|---|---|---|---|---|---|---|---|---|---|---|---|---|---|---|---|---|---|---|---|---|---|---|---|---|---|---|---|---|---|---|---|---|---|---|---|---|---|---|---|---|---|---|---|---|---|---|---|---|---|---|---|---|---|---|---|---|---|---|---|---|---|---|---|---|---|---|---|---|---|---|---|---|---|---|---|---|---|---|---|---|---|---|---|---|---|---|---|---|---|---|---|---|---|---|---|---|
| Author's title | |||||||||||||||||||||||||||||||||||||||||||||||||||||||||||||||||||||||||||||||||||||||||||||||||||
| Author | *The author of this computation has been verified* | ||||||||||||||||||||||||||||||||||||||||||||||||||||||||||||||||||||||||||||||||||||||||||||||||||
| R Software Module | rwasp_correlation.wasp | ||||||||||||||||||||||||||||||||||||||||||||||||||||||||||||||||||||||||||||||||||||||||||||||||||
| Title produced by software | Pearson Correlation | ||||||||||||||||||||||||||||||||||||||||||||||||||||||||||||||||||||||||||||||||||||||||||||||||||
| Date of computation | Sun, 19 Dec 2010 16:13:53 +0000 | ||||||||||||||||||||||||||||||||||||||||||||||||||||||||||||||||||||||||||||||||||||||||||||||||||
| Cite this page as follows | Statistical Computations at FreeStatistics.org, Office for Research Development and Education, URL https://freestatistics.org/blog/index.php?v=date/2010/Dec/19/t1292775117ro43qv8qgaaegqm.htm/, Retrieved Sat, 12 Jul 2025 10:45:34 +0000 | ||||||||||||||||||||||||||||||||||||||||||||||||||||||||||||||||||||||||||||||||||||||||||||||||||
| Statistical Computations at FreeStatistics.org, Office for Research Development and Education, URL https://freestatistics.org/blog/index.php?pk=112552, Retrieved Sat, 12 Jul 2025 10:45:34 +0000 | |||||||||||||||||||||||||||||||||||||||||||||||||||||||||||||||||||||||||||||||||||||||||||||||||||
| QR Codes: | |||||||||||||||||||||||||||||||||||||||||||||||||||||||||||||||||||||||||||||||||||||||||||||||||||
|
| |||||||||||||||||||||||||||||||||||||||||||||||||||||||||||||||||||||||||||||||||||||||||||||||||||
| Original text written by user: | |||||||||||||||||||||||||||||||||||||||||||||||||||||||||||||||||||||||||||||||||||||||||||||||||||
| IsPrivate? | No (this computation is public) | ||||||||||||||||||||||||||||||||||||||||||||||||||||||||||||||||||||||||||||||||||||||||||||||||||
| User-defined keywords | |||||||||||||||||||||||||||||||||||||||||||||||||||||||||||||||||||||||||||||||||||||||||||||||||||
| Estimated Impact | 250 | ||||||||||||||||||||||||||||||||||||||||||||||||||||||||||||||||||||||||||||||||||||||||||||||||||
Tree of Dependent Computations | |||||||||||||||||||||||||||||||||||||||||||||||||||||||||||||||||||||||||||||||||||||||||||||||||||
| Family? (F = Feedback message, R = changed R code, M = changed R Module, P = changed Parameters, D = changed Data) | |||||||||||||||||||||||||||||||||||||||||||||||||||||||||||||||||||||||||||||||||||||||||||||||||||
| - [Multiple Regression] [Competence to learn] [2010-11-17 07:43:53] [b98453cac15ba1066b407e146608df68] - PD [Multiple Regression] [] [2010-12-01 13:36:35] [8d263c682820d5327cb5f02a8c3630cf] - RMPD [Pearson Correlation] [] [2010-12-19 16:13:53] [64cdeb58b12a5b72c79150d12c763b6f] [Current] | |||||||||||||||||||||||||||||||||||||||||||||||||||||||||||||||||||||||||||||||||||||||||||||||||||
| Feedback Forum | |||||||||||||||||||||||||||||||||||||||||||||||||||||||||||||||||||||||||||||||||||||||||||||||||||
Post a new message | |||||||||||||||||||||||||||||||||||||||||||||||||||||||||||||||||||||||||||||||||||||||||||||||||||
Dataset | |||||||||||||||||||||||||||||||||||||||||||||||||||||||||||||||||||||||||||||||||||||||||||||||||||
| Dataseries X: | |||||||||||||||||||||||||||||||||||||||||||||||||||||||||||||||||||||||||||||||||||||||||||||||||||
162556 29790 87550 84738 54660 42634 40949 45187 37704 16275 25830 12679 18014 43556 24811 6575 7123 21950 37597 17821 12988 22330 13326 16189 7146 15824 27664 11920 8568 14416 3369 11819 6984 4519 2220 18562 10327 5336 2365 4069 8636 13718 4525 6869 4628 3689 4891 7489 4901 2284 3160 4150 7285 1134 4658 2384 3748 5371 1285 9327 5565 1528 3122 7561 2675 13253 880 2053 1424 4036 3045 5119 1431 554 1975 1765 1012 810 1280 666 1380 4677 876 814 514 5692 3642 540 2099 567 2001 2949 2253 6533 1889 3055 272 1414 2564 1383 1261 975 3366 576 1686 746 3192 2045 5702 1932 936 3437 5131 2397 1389 1503 402 2239 2234 837 10579 875 1585 1659 2647 3294 0 94 422 0 34 1558 0 43 645 316 115 5 897 0 389 0 1002 36 460 309 0 9 271 14 520 1766 0 458 20 0 0 98 405 0 0 0 0 483 454 47 0 757 4655 0 0 36 0 203 0 126 400 71 0 0 972 531 2461 378 23 638 2300 149 226 0 275 0 141 0 28 0 4980 0 0 472 0 0 0 203 496 10 63 0 1136 265 0 0 267 474 534 0 15 397 0 1866 288 0 3 468 20 278 61 0 192 0 317 738 0 368 0 2 0 53 0 0 0 94 0 24 2332 0 0 131 0 0 206 0 167 622 2328 0 365 364 0 0 0 0 226 307 0 0 0 188 0 138 0 0 0 125 0 282 335 0 1324 176 0 0 249 0 333 0 601 30 0 249 0 165 453 0 53 382 0 0 0 0 30 290 0 0 366 2 0 209 384 0 0 365 0 49 3 133 32 368 1 0 0 0 0 0 0 22 0 0 0 0 0 0 0 96 1 314 844 0 26 125 304 0 0 0 621 0 119 0 0 1595 312 60 587 135 0 0 514 0 0 0 1 0 0 1763 180 0 0 0 0 218 0 448 227 174 0 0 121 607 2212 0 0 530 571 0 78 2489 131 923 72 572 397 450 622 694 3425 562 4917 1442 529 2126 1061 776 611 1526 592 1182 621 989 438 726 1303 7419 1164 3310 1920 965 3256 1135 1270 661 1013 2844 11528 6526 2264 5109 3999 35624 9252 15236 18073 | |||||||||||||||||||||||||||||||||||||||||||||||||||||||||||||||||||||||||||||||||||||||||||||||||||
| Dataseries Y: | |||||||||||||||||||||||||||||||||||||||||||||||||||||||||||||||||||||||||||||||||||||||||||||||||||
213118 81767 153198 -26007 126942 157214 129352 234817 60448 47818 245546 48020 -1710 32648 95350 151352 288170 114337 37884 122844 82340 79801 165548 116384 134028 63838 74996 31080 32168 49857 87161 106113 80570 102129 301670 102313 88577 112477 191778 79804 128294 96448 93811 117520 69159 101792 210568 136996 121920 76403 108094 134759 188873 146216 156608 61348 50350 87720 99489 87419 94355 60326 94670 82425 59017 90829 80791 100423 131116 100269 27330 39039 106885 79285 118881 77623 114768 74015 69465 117869 60982 90131 138971 39625 102725 64239 90262 103960 106611 103345 95551 82903 63593 126910 37527 60247 112995 70184 130140 73221 76114 90534 108479 113761 68696 71561 59831 97890 101481 72954 67939 48022 86111 74020 57530 56364 84990 88590 77200 61262 110309 67000 93099 107577 62920 75832 60720 60793 57935 60720 60630 55637 60720 60887 60720 60505 60945 60720 60720 60720 58990 60720 56750 60894 63346 56535 60720 60835 60720 61016 58650 60438 60720 58625 60938 60720 60720 61490 60845 60720 60720 60720 60720 60830 63261 60720 60720 45689 60720 60720 60720 61564 60720 61938 60720 60951 60720 60745 60720 60720 71642 71641 55792 71873 62555 60370 64873 62041 65745 60720 59500 60720 61630 60720 60890 60720 113521 60720 60720 80045 60720 60720 60720 50804 87390 61656 65688 60720 48522 60720 60720 60720 57640 61977 62620 60720 60831 60646 60720 56225 60510 60720 60698 60720 60805 61404 60720 60720 65276 60720 63915 60720 60720 61686 60720 60743 60720 60349 60720 60720 60720 61360 60720 59818 72680 60720 60720 61808 60720 60720 53110 60720 64245 73007 82732 60720 54820 47705 60720 60720 60720 60720 72835 58856 60720 60720 60720 77655 60720 69817 60720 60720 60720 60798 60720 62452 64175 60720 67440 68136 60720 60720 56726 60720 70811 60720 60720 62045 60720 54323 60720 62841 81125 60720 59506 59365 60720 60720 60720 60720 60798 58790 60720 60720 61808 60735 60720 64016 54683 60720 60720 87192 60720 64107 60761 65990 59988 61167 60719 60720 60720 60720 60720 60720 60720 60722 60720 60720 60720 60720 60720 60720 60720 60379 60727 60720 60925 60720 60896 59734 62969 60720 60720 60720 60720 60720 59118 60720 60720 60720 58598 61124 59595 62065 60720 60720 78780 60720 60720 60720 60722 60720 60720 61600 59635 60720 60720 60720 60720 60720 60720 59781 76644 64820 60720 60720 56178 60436 60720 60720 60720 73433 41477 60720 62700 67804 59661 58620 60398 58580 62710 59325 60950 68060 83620 58456 52811 121173 63870 21001 70415 64230 59190 69351 64270 70694 68005 58930 58320 69980 69863 63255 57320 75230 79420 73490 35250 62285 69206 65920 69770 72683 -14545 55830 55174 67038 51252 157278 79510 77440 27284 | |||||||||||||||||||||||||||||||||||||||||||||||||||||||||||||||||||||||||||||||||||||||||||||||||||
Tables (Output of Computation) | |||||||||||||||||||||||||||||||||||||||||||||||||||||||||||||||||||||||||||||||||||||||||||||||||||
| |||||||||||||||||||||||||||||||||||||||||||||||||||||||||||||||||||||||||||||||||||||||||||||||||||
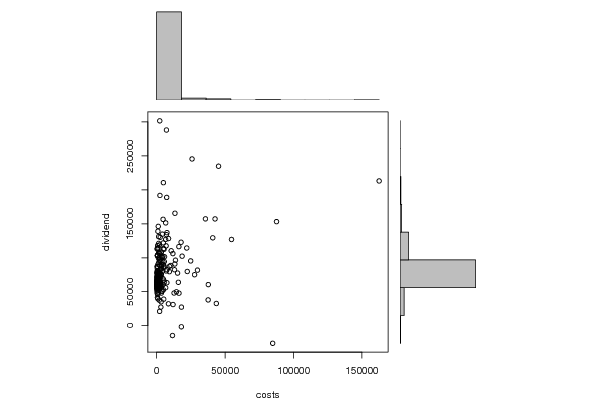
Figures (Output of Computation) | |||||||||||||||||||||||||||||||||||||||||||||||||||||||||||||||||||||||||||||||||||||||||||||||||||
Input Parameters & R Code | |||||||||||||||||||||||||||||||||||||||||||||||||||||||||||||||||||||||||||||||||||||||||||||||||||
| Parameters (Session): | |||||||||||||||||||||||||||||||||||||||||||||||||||||||||||||||||||||||||||||||||||||||||||||||||||
| Parameters (R input): | |||||||||||||||||||||||||||||||||||||||||||||||||||||||||||||||||||||||||||||||||||||||||||||||||||
| R code (references can be found in the software module): | |||||||||||||||||||||||||||||||||||||||||||||||||||||||||||||||||||||||||||||||||||||||||||||||||||
bitmap(file='test1.png') | |||||||||||||||||||||||||||||||||||||||||||||||||||||||||||||||||||||||||||||||||||||||||||||||||||