| Multiple Linear Regression - Estimated Regression Equation |
| [t] = + 112634.479166667 -81208.117361111M1[t] -61707.7430555555M2[t] -49744.11875M3[t] + 25847.0055555555M4[t] -18644.1201388889M5[t] -20577.9958333333M6[t] + 336792.128472222M7[t] + 259367.502777778M8[t] -33582.8729166667M9[t] -27590.4986111111M10[t] -75421.1243055556M11[t] + 151.875694444444t + e[t] |
| Multiple Linear Regression - Ordinary Least Squares | |||||
| Variable | Parameter | S.D. | T-STAT H0: parameter = 0 | 2-tail p-value | 1-tail p-value |
| (Intercept) | 112634.479166667 | 21955.108675 | 5.1302 | 1.1e-05 | 5e-06 |
| M1 | -81208.117361111 | 26449.365889 | -3.0703 | 0.004117 | 0.002059 |
| M2 | -61707.7430555555 | 26386.756695 | -2.3386 | 0.025196 | 0.012598 |
| M3 | -49744.11875 | 26329.981999 | -1.8893 | 0.067165 | 0.033582 |
| M4 | 25847.0055555555 | 26279.079615 | 0.9836 | 0.332083 | 0.166042 |
| M5 | -18644.1201388889 | 26234.083726 | -0.7107 | 0.48199 | 0.240995 |
| M6 | -20577.9958333333 | 26195.02477 | -0.7856 | 0.437406 | 0.218703 |
| M7 | 336792.128472222 | 26161.929337 | 12.8734 | 0 | 0 |
| M8 | 259367.502777778 | 26134.820083 | 9.9242 | 0 | 0 |
| M9 | -33582.8729166667 | 26113.71565 | -1.286 | 0.206878 | 0.103439 |
| M10 | -27590.4986111111 | 26098.630607 | -1.0572 | 0.29768 | 0.14884 |
| M11 | -75421.1243055556 | 26089.575395 | -2.8909 | 0.006559 | 0.00328 |
| t | 151.875694444444 | 396.894315 | 0.3827 | 0.704286 | 0.352143 |
| Multiple Linear Regression - Regression Statistics | |
| Multiple R | 0.97115862700606 |
| R-squared | 0.943149078808296 |
| Adjusted R-squared | 0.923657334399712 |
| F-TEST (value) | 48.3871047679515 |
| F-TEST (DF numerator) | 12 |
| F-TEST (DF denominator) | 35 |
| p-value | 0 |
| Multiple Linear Regression - Residual Statistics | |
| Residual Standard Deviation | 36891.9617043163 |
| Sum Squared Residuals | 47635589343.7458 |
| Multiple Linear Regression - Actuals, Interpolation, and Residuals | |||
| Time or Index | Actuals | Interpolation Forecast | Residuals Prediction Error |
| 1 | 19876 | 31578.2374999999 | -11702.2374999999 |
| 2 | 45335 | 51230.4875 | -5895.48749999999 |
| 3 | 48674 | 63345.9875 | -14671.9875 |
| 4 | 156392 | 139088.9875 | 17303.0125 |
| 5 | 100837 | 94749.7375 | 6087.26250000003 |
| 6 | 101605 | 92967.7375 | 8637.26250000001 |
| 7 | 532850 | 450489.7375 | 82360.2625 |
| 8 | 294189 | 373216.9875 | -79027.9875000001 |
| 9 | 80763 | 80418.4875 | 344.51249999997 |
| 10 | 105995 | 86562.7375 | 19432.2625 |
| 11 | 25045 | 38883.9875 | -13838.9875 |
| 12 | 90474 | 114456.9875 | -23982.9875 |
| 13 | 48481 | 33400.7458333334 | 15080.2541666666 |
| 14 | 50730 | 53052.9958333333 | -2322.99583333334 |
| 15 | 68694 | 65168.4958333333 | 3525.50416666667 |
| 16 | 207716 | 140911.495833333 | 66804.5041666666 |
| 17 | 99132 | 96572.2458333333 | 2559.75416666665 |
| 18 | 104012 | 94790.2458333334 | 9221.75416666663 |
| 19 | 422632 | 452312.245833333 | -29680.2458333333 |
| 20 | 364974 | 375039.495833333 | -10065.4958333333 |
| 21 | 82687 | 82240.9958333333 | 446.004166666684 |
| 22 | 66834 | 88385.2458333333 | -21551.2458333333 |
| 23 | 28408 | 40706.4958333333 | -12298.4958333333 |
| 24 | 97073 | 116279.495833333 | -19206.4958333334 |
| 25 | 40284 | 35223.2541666667 | 5060.7458333333 |
| 26 | 24421 | 54875.5041666667 | -30454.5041666667 |
| 27 | 116346 | 66991.0041666667 | 49354.9958333333 |
| 28 | 72120 | 142734.004166667 | -70614.0041666667 |
| 29 | 108751 | 98394.7541666667 | 10356.2458333333 |
| 30 | 91738 | 96612.7541666667 | -4874.75416666667 |
| 31 | 402216 | 454134.754166667 | -51918.7541666666 |
| 32 | 390070 | 376862.004166667 | 13207.9958333334 |
| 33 | 106045 | 84063.5041666667 | 21981.4958333333 |
| 34 | 110070 | 90207.7541666667 | 19862.2458333333 |
| 35 | 70668 | 42529.0041666667 | 28138.9958333333 |
| 36 | 167841 | 118102.004166667 | 49738.9958333333 |
| 37 | 28607 | 37045.7625 | -8438.76250000004 |
| 38 | 95371 | 56698.0125 | 38672.9875 |
| 39 | 30605 | 68813.5125 | -38208.5125 |
| 40 | 131063 | 144556.5125 | -13493.5125 |
| 41 | 81214 | 100217.2625 | -19003.2625 |
| 42 | 85451 | 98435.2625 | -12984.2625 |
| 43 | 455196 | 455957.2625 | -761.262499999988 |
| 44 | 454570 | 378684.5125 | 75885.4875 |
| 45 | 63114 | 85886.0125 | -22772.0125 |
| 46 | 74287 | 92030.2625 | -17743.2625 |
| 47 | 42350 | 44351.5125 | -2001.51249999999 |
| 48 | 113375 | 119924.5125 | -6549.5125 |
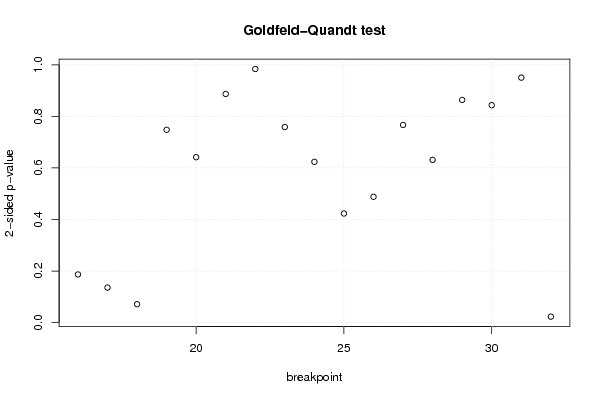
| Goldfeld-Quandt test for Heteroskedasticity | |||
| p-values | Alternative Hypothesis | ||
| breakpoint index | greater | 2-sided | less |
| 16 | 0.093626830117266 | 0.187253660234532 | 0.906373169882734 |
| 17 | 0.0681599463113746 | 0.136319892622749 | 0.931840053688625 |
| 18 | 0.035899974431275 | 0.07179994886255 | 0.964100025568725 |
| 19 | 0.625970907382382 | 0.748058185235235 | 0.374029092617618 |
| 20 | 0.679115207462517 | 0.641769585074965 | 0.320884792537483 |
| 21 | 0.556535759982818 | 0.886928480034365 | 0.443464240017182 |
| 22 | 0.491991721778378 | 0.983983443556756 | 0.508008278221622 |
| 23 | 0.379350059582104 | 0.758700119164207 | 0.620649940417896 |
| 24 | 0.311946472270551 | 0.623892944541103 | 0.688053527729449 |
| 25 | 0.211764277877063 | 0.423528555754125 | 0.788235722122937 |
| 26 | 0.244142075102718 | 0.488284150205436 | 0.755857924897282 |
| 27 | 0.383366435073327 | 0.766732870146654 | 0.616633564926673 |
| 28 | 0.684317118434705 | 0.63136576313059 | 0.315682881565295 |
| 29 | 0.568068504448708 | 0.863862991102583 | 0.431931495551292 |
| 30 | 0.421750007060267 | 0.843500014120535 | 0.578249992939732 |
| 31 | 0.524849490265092 | 0.950301019469817 | 0.475150509734908 |
| 32 | 0.988229113123852 | 0.0235417737522966 | 0.0117708868761483 |
| Meta Analysis of Goldfeld-Quandt test for Heteroskedasticity | |||
| Description | # significant tests | % significant tests | OK/NOK |
| 1% type I error level | 0 | 0 | OK |
| 5% type I error level | 1 | 0.0588235294117647 | NOK |
| 10% type I error level | 2 | 0.117647058823529 | NOK |