Free Statistics

of Irreproducible Research!

Author's title

Author*The author of this computation has been verified*
R Software Modulerwasp_multipleregression.wasp
Title produced by softwareMultiple Regression
Date of computationSun, 19 Dec 2010 14:12:06 +0000
Cite this page as followsStatistical Computations at FreeStatistics.org, Office for Research Development and Education, URL https://freestatistics.org/blog/index.php?v=date/2010/Dec/19/t12927678906js68n4v63x9jjw.htm/, Retrieved Sun, 05 May 2024 03:42:10 +0000
Statistical Computations at FreeStatistics.org, Office for Research Development and Education, URL https://freestatistics.org/blog/index.php?pk=112405, Retrieved Sun, 05 May 2024 03:42:10 +0000
QR Codes:

Original text written by user:
IsPrivate?No (this computation is public)
User-defined keywords
Estimated Impact137
Family? (F = Feedback message, R = changed R code, M = changed R Module, P = changed Parameters, D = changed Data)
-     [Univariate Data Series] [] [2008-12-08 19:22:39] [d2d412c7f4d35ffbf5ee5ee89db327d4]
- RMPD  [ARIMA Backward Selection] [] [2010-12-14 13:44:15] [42a441ca3193af442aa2201743dfb347]
- RMP     [Classical Decomposition] [] [2010-12-19 12:38:53] [07fa8844ca5618cd0482008937d9acea]
- RMP         [Multiple Regression] [] [2010-12-19 14:12:06] [ef8aba939446289dd59b403ac33ef077] [Current]
Feedback Forum

Post a new message
Dataseries X:
19876
45335
48674
156392
100837
101605
532850
294189
80763
105995
25045
90474
48481
50730
68694
207716
99132
104012
422632
364974
82687
66834
28408
97073
40284
24421
116346
72120
108751
91738
402216
390070
106045
110070
70668
167841
28607
95371
30605
131063
81214
85451
455196
454570
63114
74287
42350
113375


Summary of computational transaction
Raw Inputview raw input (R code)
Raw Outputview raw output of R engine
Computing time6 seconds
R Server'RServer@AstonUniversity' @ vre.aston.ac.uk

\begin{tabular}{lllllllll}
\hline
Summary of computational transaction \tabularnewline
Raw Input & view raw input (R code)  \tabularnewline
Raw Output & view raw output of R engine  \tabularnewline
Computing time & 6 seconds \tabularnewline
R Server & 'RServer@AstonUniversity' @ vre.aston.ac.uk \tabularnewline
\hline
\end{tabular}
%Source: https://freestatistics.org/blog/index.php?pk=112405&T=0

[TABLE]
[ROW][C]Summary of computational transaction[/C][/ROW]
[ROW][C]Raw Input[/C][C]view raw input (R code) [/C][/ROW]
[ROW][C]Raw Output[/C][C]view raw output of R engine [/C][/ROW]
[ROW][C]Computing time[/C][C]6 seconds[/C][/ROW]
[ROW][C]R Server[/C][C]'RServer@AstonUniversity' @ vre.aston.ac.uk[/C][/ROW]
[/TABLE]
Source: https://freestatistics.org/blog/index.php?pk=112405&T=0

Globally Unique Identifier (entire table): ba.freestatistics.org/blog/index.php?pk=112405&T=0

As an alternative you can also use a QR Code:  

The GUIDs for individual cells are displayed in the table below:

Summary of computational transaction
Raw Inputview raw input (R code)
Raw Outputview raw output of R engine
Computing time6 seconds
R Server'RServer@AstonUniversity' @ vre.aston.ac.uk


Multiple Linear Regression - Estimated Regression Equation
[t] = + 112634.479166667 -81208.117361111M1[t] -61707.7430555555M2[t] -49744.11875M3[t] + 25847.0055555555M4[t] -18644.1201388889M5[t] -20577.9958333333M6[t] + 336792.128472222M7[t] + 259367.502777778M8[t] -33582.8729166667M9[t] -27590.4986111111M10[t] -75421.1243055556M11[t] + 151.875694444444t + e[t]

\begin{tabular}{lllllllll}
\hline
Multiple Linear Regression - Estimated Regression Equation \tabularnewline
[t] =  +  112634.479166667 -81208.117361111M1[t] -61707.7430555555M2[t] -49744.11875M3[t] +  25847.0055555555M4[t] -18644.1201388889M5[t] -20577.9958333333M6[t] +  336792.128472222M7[t] +  259367.502777778M8[t] -33582.8729166667M9[t] -27590.4986111111M10[t] -75421.1243055556M11[t] +  151.875694444444t  + e[t] \tabularnewline
\hline
\end{tabular}
%Source: https://freestatistics.org/blog/index.php?pk=112405&T=1

[TABLE]
[ROW][C]Multiple Linear Regression - Estimated Regression Equation[/C][/ROW]
[ROW][C][t] =  +  112634.479166667 -81208.117361111M1[t] -61707.7430555555M2[t] -49744.11875M3[t] +  25847.0055555555M4[t] -18644.1201388889M5[t] -20577.9958333333M6[t] +  336792.128472222M7[t] +  259367.502777778M8[t] -33582.8729166667M9[t] -27590.4986111111M10[t] -75421.1243055556M11[t] +  151.875694444444t  + e[t][/C][/ROW]
[/TABLE]
Source: https://freestatistics.org/blog/index.php?pk=112405&T=1

Globally Unique Identifier (entire table): ba.freestatistics.org/blog/index.php?pk=112405&T=1

As an alternative you can also use a QR Code:  

The GUIDs for individual cells are displayed in the table below:

Multiple Linear Regression - Estimated Regression Equation
[t] = + 112634.479166667 -81208.117361111M1[t] -61707.7430555555M2[t] -49744.11875M3[t] + 25847.0055555555M4[t] -18644.1201388889M5[t] -20577.9958333333M6[t] + 336792.128472222M7[t] + 259367.502777778M8[t] -33582.8729166667M9[t] -27590.4986111111M10[t] -75421.1243055556M11[t] + 151.875694444444t + e[t]


Multiple Linear Regression - Ordinary Least Squares
VariableParameterS.D.T-STATH0: parameter = 02-tail p-value1-tail p-value
(Intercept)112634.47916666721955.1086755.13021.1e-055e-06
M1-81208.11736111126449.365889-3.07030.0041170.002059
M2-61707.743055555526386.756695-2.33860.0251960.012598
M3-49744.1187526329.981999-1.88930.0671650.033582
M425847.005555555526279.0796150.98360.3320830.166042
M5-18644.120138888926234.083726-0.71070.481990.240995
M6-20577.995833333326195.02477-0.78560.4374060.218703
M7336792.12847222226161.92933712.873400
M8259367.50277777826134.8200839.924200
M9-33582.872916666726113.71565-1.2860.2068780.103439
M10-27590.498611111126098.630607-1.05720.297680.14884
M11-75421.124305555626089.575395-2.89090.0065590.00328
t151.875694444444396.8943150.38270.7042860.352143

\begin{tabular}{lllllllll}
\hline
Multiple Linear Regression - Ordinary Least Squares \tabularnewline
Variable & Parameter & S.D. & T-STATH0: parameter = 0 & 2-tail p-value & 1-tail p-value \tabularnewline
(Intercept) & 112634.479166667 & 21955.108675 & 5.1302 & 1.1e-05 & 5e-06 \tabularnewline
M1 & -81208.117361111 & 26449.365889 & -3.0703 & 0.004117 & 0.002059 \tabularnewline
M2 & -61707.7430555555 & 26386.756695 & -2.3386 & 0.025196 & 0.012598 \tabularnewline
M3 & -49744.11875 & 26329.981999 & -1.8893 & 0.067165 & 0.033582 \tabularnewline
M4 & 25847.0055555555 & 26279.079615 & 0.9836 & 0.332083 & 0.166042 \tabularnewline
M5 & -18644.1201388889 & 26234.083726 & -0.7107 & 0.48199 & 0.240995 \tabularnewline
M6 & -20577.9958333333 & 26195.02477 & -0.7856 & 0.437406 & 0.218703 \tabularnewline
M7 & 336792.128472222 & 26161.929337 & 12.8734 & 0 & 0 \tabularnewline
M8 & 259367.502777778 & 26134.820083 & 9.9242 & 0 & 0 \tabularnewline
M9 & -33582.8729166667 & 26113.71565 & -1.286 & 0.206878 & 0.103439 \tabularnewline
M10 & -27590.4986111111 & 26098.630607 & -1.0572 & 0.29768 & 0.14884 \tabularnewline
M11 & -75421.1243055556 & 26089.575395 & -2.8909 & 0.006559 & 0.00328 \tabularnewline
t & 151.875694444444 & 396.894315 & 0.3827 & 0.704286 & 0.352143 \tabularnewline
\hline
\end{tabular}
%Source: https://freestatistics.org/blog/index.php?pk=112405&T=2

[TABLE]
[ROW][C]Multiple Linear Regression - Ordinary Least Squares[/C][/ROW]
[ROW][C]Variable[/C][C]Parameter[/C][C]S.D.[/C][C]T-STATH0: parameter = 0[/C][C]2-tail p-value[/C][C]1-tail p-value[/C][/ROW]
[ROW][C](Intercept)[/C][C]112634.479166667[/C][C]21955.108675[/C][C]5.1302[/C][C]1.1e-05[/C][C]5e-06[/C][/ROW]
[ROW][C]M1[/C][C]-81208.117361111[/C][C]26449.365889[/C][C]-3.0703[/C][C]0.004117[/C][C]0.002059[/C][/ROW]
[ROW][C]M2[/C][C]-61707.7430555555[/C][C]26386.756695[/C][C]-2.3386[/C][C]0.025196[/C][C]0.012598[/C][/ROW]
[ROW][C]M3[/C][C]-49744.11875[/C][C]26329.981999[/C][C]-1.8893[/C][C]0.067165[/C][C]0.033582[/C][/ROW]
[ROW][C]M4[/C][C]25847.0055555555[/C][C]26279.079615[/C][C]0.9836[/C][C]0.332083[/C][C]0.166042[/C][/ROW]
[ROW][C]M5[/C][C]-18644.1201388889[/C][C]26234.083726[/C][C]-0.7107[/C][C]0.48199[/C][C]0.240995[/C][/ROW]
[ROW][C]M6[/C][C]-20577.9958333333[/C][C]26195.02477[/C][C]-0.7856[/C][C]0.437406[/C][C]0.218703[/C][/ROW]
[ROW][C]M7[/C][C]336792.128472222[/C][C]26161.929337[/C][C]12.8734[/C][C]0[/C][C]0[/C][/ROW]
[ROW][C]M8[/C][C]259367.502777778[/C][C]26134.820083[/C][C]9.9242[/C][C]0[/C][C]0[/C][/ROW]
[ROW][C]M9[/C][C]-33582.8729166667[/C][C]26113.71565[/C][C]-1.286[/C][C]0.206878[/C][C]0.103439[/C][/ROW]
[ROW][C]M10[/C][C]-27590.4986111111[/C][C]26098.630607[/C][C]-1.0572[/C][C]0.29768[/C][C]0.14884[/C][/ROW]
[ROW][C]M11[/C][C]-75421.1243055556[/C][C]26089.575395[/C][C]-2.8909[/C][C]0.006559[/C][C]0.00328[/C][/ROW]
[ROW][C]t[/C][C]151.875694444444[/C][C]396.894315[/C][C]0.3827[/C][C]0.704286[/C][C]0.352143[/C][/ROW]
[/TABLE]
Source: https://freestatistics.org/blog/index.php?pk=112405&T=2

Globally Unique Identifier (entire table): ba.freestatistics.org/blog/index.php?pk=112405&T=2

As an alternative you can also use a QR Code:  

The GUIDs for individual cells are displayed in the table below:

Multiple Linear Regression - Ordinary Least Squares
VariableParameterS.D.T-STATH0: parameter = 02-tail p-value1-tail p-value
(Intercept)112634.47916666721955.1086755.13021.1e-055e-06
M1-81208.11736111126449.365889-3.07030.0041170.002059
M2-61707.743055555526386.756695-2.33860.0251960.012598
M3-49744.1187526329.981999-1.88930.0671650.033582
M425847.005555555526279.0796150.98360.3320830.166042
M5-18644.120138888926234.083726-0.71070.481990.240995
M6-20577.995833333326195.02477-0.78560.4374060.218703
M7336792.12847222226161.92933712.873400
M8259367.50277777826134.8200839.924200
M9-33582.872916666726113.71565-1.2860.2068780.103439
M10-27590.498611111126098.630607-1.05720.297680.14884
M11-75421.124305555626089.575395-2.89090.0065590.00328
t151.875694444444396.8943150.38270.7042860.352143


Multiple Linear Regression - Regression Statistics
Multiple R0.97115862700606
R-squared0.943149078808296
Adjusted R-squared0.923657334399712
F-TEST (value)48.3871047679515
F-TEST (DF numerator)12
F-TEST (DF denominator)35
p-value0
Multiple Linear Regression - Residual Statistics
Residual Standard Deviation36891.9617043163
Sum Squared Residuals47635589343.7458

\begin{tabular}{lllllllll}
\hline
Multiple Linear Regression - Regression Statistics \tabularnewline
Multiple R & 0.97115862700606 \tabularnewline
R-squared & 0.943149078808296 \tabularnewline
Adjusted R-squared & 0.923657334399712 \tabularnewline
F-TEST (value) & 48.3871047679515 \tabularnewline
F-TEST (DF numerator) & 12 \tabularnewline
F-TEST (DF denominator) & 35 \tabularnewline
p-value & 0 \tabularnewline
Multiple Linear Regression - Residual Statistics \tabularnewline
Residual Standard Deviation & 36891.9617043163 \tabularnewline
Sum Squared Residuals & 47635589343.7458 \tabularnewline
\hline
\end{tabular}
%Source: https://freestatistics.org/blog/index.php?pk=112405&T=3

[TABLE]
[ROW][C]Multiple Linear Regression - Regression Statistics[/C][/ROW]
[ROW][C]Multiple R[/C][C]0.97115862700606[/C][/ROW]
[ROW][C]R-squared[/C][C]0.943149078808296[/C][/ROW]
[ROW][C]Adjusted R-squared[/C][C]0.923657334399712[/C][/ROW]
[ROW][C]F-TEST (value)[/C][C]48.3871047679515[/C][/ROW]
[ROW][C]F-TEST (DF numerator)[/C][C]12[/C][/ROW]
[ROW][C]F-TEST (DF denominator)[/C][C]35[/C][/ROW]
[ROW][C]p-value[/C][C]0[/C][/ROW]
[ROW][C]Multiple Linear Regression - Residual Statistics[/C][/ROW]
[ROW][C]Residual Standard Deviation[/C][C]36891.9617043163[/C][/ROW]
[ROW][C]Sum Squared Residuals[/C][C]47635589343.7458[/C][/ROW]
[/TABLE]
Source: https://freestatistics.org/blog/index.php?pk=112405&T=3

Globally Unique Identifier (entire table): ba.freestatistics.org/blog/index.php?pk=112405&T=3

As an alternative you can also use a QR Code:  

The GUIDs for individual cells are displayed in the table below:

Multiple Linear Regression - Regression Statistics
Multiple R0.97115862700606
R-squared0.943149078808296
Adjusted R-squared0.923657334399712
F-TEST (value)48.3871047679515
F-TEST (DF numerator)12
F-TEST (DF denominator)35
p-value0
Multiple Linear Regression - Residual Statistics
Residual Standard Deviation36891.9617043163
Sum Squared Residuals47635589343.7458


Multiple Linear Regression - Actuals, Interpolation, and Residuals
Time or IndexActualsInterpolationForecastResidualsPrediction Error
11987631578.2374999999-11702.2374999999
24533551230.4875-5895.48749999999
34867463345.9875-14671.9875
4156392139088.987517303.0125
510083794749.73756087.26250000003
610160592967.73758637.26250000001
7532850450489.737582360.2625
8294189373216.9875-79027.9875000001
98076380418.4875344.51249999997
1010599586562.737519432.2625
112504538883.9875-13838.9875
1290474114456.9875-23982.9875
134848133400.745833333415080.2541666666
145073053052.9958333333-2322.99583333334
156869465168.49583333333525.50416666667
16207716140911.49583333366804.5041666666
179913296572.24583333332559.75416666665
1810401294790.24583333349221.75416666663
19422632452312.245833333-29680.2458333333
20364974375039.495833333-10065.4958333333
218268782240.9958333333446.004166666684
226683488385.2458333333-21551.2458333333
232840840706.4958333333-12298.4958333333
2497073116279.495833333-19206.4958333334
254028435223.25416666675060.7458333333
262442154875.5041666667-30454.5041666667
2711634666991.004166666749354.9958333333
2872120142734.004166667-70614.0041666667
2910875198394.754166666710356.2458333333
309173896612.7541666667-4874.75416666667
31402216454134.754166667-51918.7541666666
32390070376862.00416666713207.9958333334
3310604584063.504166666721981.4958333333
3411007090207.754166666719862.2458333333
357066842529.004166666728138.9958333333
36167841118102.00416666749738.9958333333
372860737045.7625-8438.76250000004
389537156698.012538672.9875
393060568813.5125-38208.5125
40131063144556.5125-13493.5125
4181214100217.2625-19003.2625
428545198435.2625-12984.2625
43455196455957.2625-761.262499999988
44454570378684.512575885.4875
456311485886.0125-22772.0125
467428792030.2625-17743.2625
474235044351.5125-2001.51249999999
48113375119924.5125-6549.5125

\begin{tabular}{lllllllll}
\hline
Multiple Linear Regression - Actuals, Interpolation, and Residuals \tabularnewline
Time or Index & Actuals & InterpolationForecast & ResidualsPrediction Error \tabularnewline
1 & 19876 & 31578.2374999999 & -11702.2374999999 \tabularnewline
2 & 45335 & 51230.4875 & -5895.48749999999 \tabularnewline
3 & 48674 & 63345.9875 & -14671.9875 \tabularnewline
4 & 156392 & 139088.9875 & 17303.0125 \tabularnewline
5 & 100837 & 94749.7375 & 6087.26250000003 \tabularnewline
6 & 101605 & 92967.7375 & 8637.26250000001 \tabularnewline
7 & 532850 & 450489.7375 & 82360.2625 \tabularnewline
8 & 294189 & 373216.9875 & -79027.9875000001 \tabularnewline
9 & 80763 & 80418.4875 & 344.51249999997 \tabularnewline
10 & 105995 & 86562.7375 & 19432.2625 \tabularnewline
11 & 25045 & 38883.9875 & -13838.9875 \tabularnewline
12 & 90474 & 114456.9875 & -23982.9875 \tabularnewline
13 & 48481 & 33400.7458333334 & 15080.2541666666 \tabularnewline
14 & 50730 & 53052.9958333333 & -2322.99583333334 \tabularnewline
15 & 68694 & 65168.4958333333 & 3525.50416666667 \tabularnewline
16 & 207716 & 140911.495833333 & 66804.5041666666 \tabularnewline
17 & 99132 & 96572.2458333333 & 2559.75416666665 \tabularnewline
18 & 104012 & 94790.2458333334 & 9221.75416666663 \tabularnewline
19 & 422632 & 452312.245833333 & -29680.2458333333 \tabularnewline
20 & 364974 & 375039.495833333 & -10065.4958333333 \tabularnewline
21 & 82687 & 82240.9958333333 & 446.004166666684 \tabularnewline
22 & 66834 & 88385.2458333333 & -21551.2458333333 \tabularnewline
23 & 28408 & 40706.4958333333 & -12298.4958333333 \tabularnewline
24 & 97073 & 116279.495833333 & -19206.4958333334 \tabularnewline
25 & 40284 & 35223.2541666667 & 5060.7458333333 \tabularnewline
26 & 24421 & 54875.5041666667 & -30454.5041666667 \tabularnewline
27 & 116346 & 66991.0041666667 & 49354.9958333333 \tabularnewline
28 & 72120 & 142734.004166667 & -70614.0041666667 \tabularnewline
29 & 108751 & 98394.7541666667 & 10356.2458333333 \tabularnewline
30 & 91738 & 96612.7541666667 & -4874.75416666667 \tabularnewline
31 & 402216 & 454134.754166667 & -51918.7541666666 \tabularnewline
32 & 390070 & 376862.004166667 & 13207.9958333334 \tabularnewline
33 & 106045 & 84063.5041666667 & 21981.4958333333 \tabularnewline
34 & 110070 & 90207.7541666667 & 19862.2458333333 \tabularnewline
35 & 70668 & 42529.0041666667 & 28138.9958333333 \tabularnewline
36 & 167841 & 118102.004166667 & 49738.9958333333 \tabularnewline
37 & 28607 & 37045.7625 & -8438.76250000004 \tabularnewline
38 & 95371 & 56698.0125 & 38672.9875 \tabularnewline
39 & 30605 & 68813.5125 & -38208.5125 \tabularnewline
40 & 131063 & 144556.5125 & -13493.5125 \tabularnewline
41 & 81214 & 100217.2625 & -19003.2625 \tabularnewline
42 & 85451 & 98435.2625 & -12984.2625 \tabularnewline
43 & 455196 & 455957.2625 & -761.262499999988 \tabularnewline
44 & 454570 & 378684.5125 & 75885.4875 \tabularnewline
45 & 63114 & 85886.0125 & -22772.0125 \tabularnewline
46 & 74287 & 92030.2625 & -17743.2625 \tabularnewline
47 & 42350 & 44351.5125 & -2001.51249999999 \tabularnewline
48 & 113375 & 119924.5125 & -6549.5125 \tabularnewline
\hline
\end{tabular}
%Source: https://freestatistics.org/blog/index.php?pk=112405&T=4

[TABLE]
[ROW][C]Multiple Linear Regression - Actuals, Interpolation, and Residuals[/C][/ROW]
[ROW][C]Time or Index[/C][C]Actuals[/C][C]InterpolationForecast[/C][C]ResidualsPrediction Error[/C][/ROW]
[ROW][C]1[/C][C]19876[/C][C]31578.2374999999[/C][C]-11702.2374999999[/C][/ROW]
[ROW][C]2[/C][C]45335[/C][C]51230.4875[/C][C]-5895.48749999999[/C][/ROW]
[ROW][C]3[/C][C]48674[/C][C]63345.9875[/C][C]-14671.9875[/C][/ROW]
[ROW][C]4[/C][C]156392[/C][C]139088.9875[/C][C]17303.0125[/C][/ROW]
[ROW][C]5[/C][C]100837[/C][C]94749.7375[/C][C]6087.26250000003[/C][/ROW]
[ROW][C]6[/C][C]101605[/C][C]92967.7375[/C][C]8637.26250000001[/C][/ROW]
[ROW][C]7[/C][C]532850[/C][C]450489.7375[/C][C]82360.2625[/C][/ROW]
[ROW][C]8[/C][C]294189[/C][C]373216.9875[/C][C]-79027.9875000001[/C][/ROW]
[ROW][C]9[/C][C]80763[/C][C]80418.4875[/C][C]344.51249999997[/C][/ROW]
[ROW][C]10[/C][C]105995[/C][C]86562.7375[/C][C]19432.2625[/C][/ROW]
[ROW][C]11[/C][C]25045[/C][C]38883.9875[/C][C]-13838.9875[/C][/ROW]
[ROW][C]12[/C][C]90474[/C][C]114456.9875[/C][C]-23982.9875[/C][/ROW]
[ROW][C]13[/C][C]48481[/C][C]33400.7458333334[/C][C]15080.2541666666[/C][/ROW]
[ROW][C]14[/C][C]50730[/C][C]53052.9958333333[/C][C]-2322.99583333334[/C][/ROW]
[ROW][C]15[/C][C]68694[/C][C]65168.4958333333[/C][C]3525.50416666667[/C][/ROW]
[ROW][C]16[/C][C]207716[/C][C]140911.495833333[/C][C]66804.5041666666[/C][/ROW]
[ROW][C]17[/C][C]99132[/C][C]96572.2458333333[/C][C]2559.75416666665[/C][/ROW]
[ROW][C]18[/C][C]104012[/C][C]94790.2458333334[/C][C]9221.75416666663[/C][/ROW]
[ROW][C]19[/C][C]422632[/C][C]452312.245833333[/C][C]-29680.2458333333[/C][/ROW]
[ROW][C]20[/C][C]364974[/C][C]375039.495833333[/C][C]-10065.4958333333[/C][/ROW]
[ROW][C]21[/C][C]82687[/C][C]82240.9958333333[/C][C]446.004166666684[/C][/ROW]
[ROW][C]22[/C][C]66834[/C][C]88385.2458333333[/C][C]-21551.2458333333[/C][/ROW]
[ROW][C]23[/C][C]28408[/C][C]40706.4958333333[/C][C]-12298.4958333333[/C][/ROW]
[ROW][C]24[/C][C]97073[/C][C]116279.495833333[/C][C]-19206.4958333334[/C][/ROW]
[ROW][C]25[/C][C]40284[/C][C]35223.2541666667[/C][C]5060.7458333333[/C][/ROW]
[ROW][C]26[/C][C]24421[/C][C]54875.5041666667[/C][C]-30454.5041666667[/C][/ROW]
[ROW][C]27[/C][C]116346[/C][C]66991.0041666667[/C][C]49354.9958333333[/C][/ROW]
[ROW][C]28[/C][C]72120[/C][C]142734.004166667[/C][C]-70614.0041666667[/C][/ROW]
[ROW][C]29[/C][C]108751[/C][C]98394.7541666667[/C][C]10356.2458333333[/C][/ROW]
[ROW][C]30[/C][C]91738[/C][C]96612.7541666667[/C][C]-4874.75416666667[/C][/ROW]
[ROW][C]31[/C][C]402216[/C][C]454134.754166667[/C][C]-51918.7541666666[/C][/ROW]
[ROW][C]32[/C][C]390070[/C][C]376862.004166667[/C][C]13207.9958333334[/C][/ROW]
[ROW][C]33[/C][C]106045[/C][C]84063.5041666667[/C][C]21981.4958333333[/C][/ROW]
[ROW][C]34[/C][C]110070[/C][C]90207.7541666667[/C][C]19862.2458333333[/C][/ROW]
[ROW][C]35[/C][C]70668[/C][C]42529.0041666667[/C][C]28138.9958333333[/C][/ROW]
[ROW][C]36[/C][C]167841[/C][C]118102.004166667[/C][C]49738.9958333333[/C][/ROW]
[ROW][C]37[/C][C]28607[/C][C]37045.7625[/C][C]-8438.76250000004[/C][/ROW]
[ROW][C]38[/C][C]95371[/C][C]56698.0125[/C][C]38672.9875[/C][/ROW]
[ROW][C]39[/C][C]30605[/C][C]68813.5125[/C][C]-38208.5125[/C][/ROW]
[ROW][C]40[/C][C]131063[/C][C]144556.5125[/C][C]-13493.5125[/C][/ROW]
[ROW][C]41[/C][C]81214[/C][C]100217.2625[/C][C]-19003.2625[/C][/ROW]
[ROW][C]42[/C][C]85451[/C][C]98435.2625[/C][C]-12984.2625[/C][/ROW]
[ROW][C]43[/C][C]455196[/C][C]455957.2625[/C][C]-761.262499999988[/C][/ROW]
[ROW][C]44[/C][C]454570[/C][C]378684.5125[/C][C]75885.4875[/C][/ROW]
[ROW][C]45[/C][C]63114[/C][C]85886.0125[/C][C]-22772.0125[/C][/ROW]
[ROW][C]46[/C][C]74287[/C][C]92030.2625[/C][C]-17743.2625[/C][/ROW]
[ROW][C]47[/C][C]42350[/C][C]44351.5125[/C][C]-2001.51249999999[/C][/ROW]
[ROW][C]48[/C][C]113375[/C][C]119924.5125[/C][C]-6549.5125[/C][/ROW]
[/TABLE]
Source: https://freestatistics.org/blog/index.php?pk=112405&T=4

Globally Unique Identifier (entire table): ba.freestatistics.org/blog/index.php?pk=112405&T=4

As an alternative you can also use a QR Code:  

The GUIDs for individual cells are displayed in the table below:

Multiple Linear Regression - Actuals, Interpolation, and Residuals
Time or IndexActualsInterpolationForecastResidualsPrediction Error
11987631578.2374999999-11702.2374999999
24533551230.4875-5895.48749999999
34867463345.9875-14671.9875
4156392139088.987517303.0125
510083794749.73756087.26250000003
610160592967.73758637.26250000001
7532850450489.737582360.2625
8294189373216.9875-79027.9875000001
98076380418.4875344.51249999997
1010599586562.737519432.2625
112504538883.9875-13838.9875
1290474114456.9875-23982.9875
134848133400.745833333415080.2541666666
145073053052.9958333333-2322.99583333334
156869465168.49583333333525.50416666667
16207716140911.49583333366804.5041666666
179913296572.24583333332559.75416666665
1810401294790.24583333349221.75416666663
19422632452312.245833333-29680.2458333333
20364974375039.495833333-10065.4958333333
218268782240.9958333333446.004166666684
226683488385.2458333333-21551.2458333333
232840840706.4958333333-12298.4958333333
2497073116279.495833333-19206.4958333334
254028435223.25416666675060.7458333333
262442154875.5041666667-30454.5041666667
2711634666991.004166666749354.9958333333
2872120142734.004166667-70614.0041666667
2910875198394.754166666710356.2458333333
309173896612.7541666667-4874.75416666667
31402216454134.754166667-51918.7541666666
32390070376862.00416666713207.9958333334
3310604584063.504166666721981.4958333333
3411007090207.754166666719862.2458333333
357066842529.004166666728138.9958333333
36167841118102.00416666749738.9958333333
372860737045.7625-8438.76250000004
389537156698.012538672.9875
393060568813.5125-38208.5125
40131063144556.5125-13493.5125
4181214100217.2625-19003.2625
428545198435.2625-12984.2625
43455196455957.2625-761.262499999988
44454570378684.512575885.4875
456311485886.0125-22772.0125
467428792030.2625-17743.2625
474235044351.5125-2001.51249999999
48113375119924.5125-6549.5125


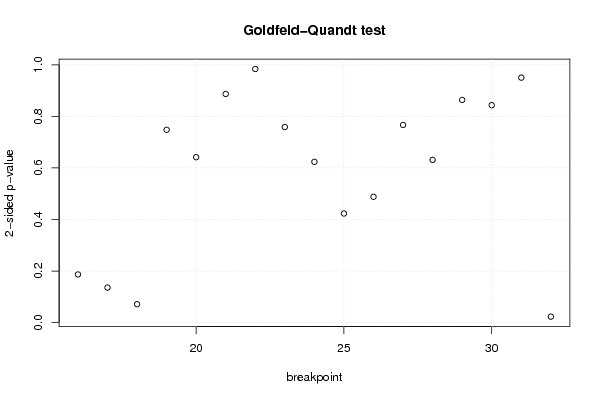
Goldfeld-Quandt test for Heteroskedasticity
p-valuesAlternative Hypothesis
breakpoint indexgreater2-sidedless
160.0936268301172660.1872536602345320.906373169882734
170.06815994631137460.1363198926227490.931840053688625
180.0358999744312750.071799948862550.964100025568725
190.6259709073823820.7480581852352350.374029092617618
200.6791152074625170.6417695850749650.320884792537483
210.5565357599828180.8869284800343650.443464240017182
220.4919917217783780.9839834435567560.508008278221622
230.3793500595821040.7587001191642070.620649940417896
240.3119464722705510.6238929445411030.688053527729449
250.2117642778770630.4235285557541250.788235722122937
260.2441420751027180.4882841502054360.755857924897282
270.3833664350733270.7667328701466540.616633564926673
280.6843171184347050.631365763130590.315682881565295
290.5680685044487080.8638629911025830.431931495551292
300.4217500070602670.8435000141205350.578249992939732
310.5248494902650920.9503010194698170.475150509734908
320.9882291131238520.02354177375229660.0117708868761483

\begin{tabular}{lllllllll}
\hline
Goldfeld-Quandt test for Heteroskedasticity \tabularnewline
p-values & Alternative Hypothesis \tabularnewline
breakpoint index & greater & 2-sided & less \tabularnewline
16 & 0.093626830117266 & 0.187253660234532 & 0.906373169882734 \tabularnewline
17 & 0.0681599463113746 & 0.136319892622749 & 0.931840053688625 \tabularnewline
18 & 0.035899974431275 & 0.07179994886255 & 0.964100025568725 \tabularnewline
19 & 0.625970907382382 & 0.748058185235235 & 0.374029092617618 \tabularnewline
20 & 0.679115207462517 & 0.641769585074965 & 0.320884792537483 \tabularnewline
21 & 0.556535759982818 & 0.886928480034365 & 0.443464240017182 \tabularnewline
22 & 0.491991721778378 & 0.983983443556756 & 0.508008278221622 \tabularnewline
23 & 0.379350059582104 & 0.758700119164207 & 0.620649940417896 \tabularnewline
24 & 0.311946472270551 & 0.623892944541103 & 0.688053527729449 \tabularnewline
25 & 0.211764277877063 & 0.423528555754125 & 0.788235722122937 \tabularnewline
26 & 0.244142075102718 & 0.488284150205436 & 0.755857924897282 \tabularnewline
27 & 0.383366435073327 & 0.766732870146654 & 0.616633564926673 \tabularnewline
28 & 0.684317118434705 & 0.63136576313059 & 0.315682881565295 \tabularnewline
29 & 0.568068504448708 & 0.863862991102583 & 0.431931495551292 \tabularnewline
30 & 0.421750007060267 & 0.843500014120535 & 0.578249992939732 \tabularnewline
31 & 0.524849490265092 & 0.950301019469817 & 0.475150509734908 \tabularnewline
32 & 0.988229113123852 & 0.0235417737522966 & 0.0117708868761483 \tabularnewline
\hline
\end{tabular}
%Source: https://freestatistics.org/blog/index.php?pk=112405&T=5

[TABLE]
[ROW][C]Goldfeld-Quandt test for Heteroskedasticity[/C][/ROW]
[ROW][C]p-values[/C][C]Alternative Hypothesis[/C][/ROW]
[ROW][C]breakpoint index[/C][C]greater[/C][C]2-sided[/C][C]less[/C][/ROW]
[ROW][C]16[/C][C]0.093626830117266[/C][C]0.187253660234532[/C][C]0.906373169882734[/C][/ROW]
[ROW][C]17[/C][C]0.0681599463113746[/C][C]0.136319892622749[/C][C]0.931840053688625[/C][/ROW]
[ROW][C]18[/C][C]0.035899974431275[/C][C]0.07179994886255[/C][C]0.964100025568725[/C][/ROW]
[ROW][C]19[/C][C]0.625970907382382[/C][C]0.748058185235235[/C][C]0.374029092617618[/C][/ROW]
[ROW][C]20[/C][C]0.679115207462517[/C][C]0.641769585074965[/C][C]0.320884792537483[/C][/ROW]
[ROW][C]21[/C][C]0.556535759982818[/C][C]0.886928480034365[/C][C]0.443464240017182[/C][/ROW]
[ROW][C]22[/C][C]0.491991721778378[/C][C]0.983983443556756[/C][C]0.508008278221622[/C][/ROW]
[ROW][C]23[/C][C]0.379350059582104[/C][C]0.758700119164207[/C][C]0.620649940417896[/C][/ROW]
[ROW][C]24[/C][C]0.311946472270551[/C][C]0.623892944541103[/C][C]0.688053527729449[/C][/ROW]
[ROW][C]25[/C][C]0.211764277877063[/C][C]0.423528555754125[/C][C]0.788235722122937[/C][/ROW]
[ROW][C]26[/C][C]0.244142075102718[/C][C]0.488284150205436[/C][C]0.755857924897282[/C][/ROW]
[ROW][C]27[/C][C]0.383366435073327[/C][C]0.766732870146654[/C][C]0.616633564926673[/C][/ROW]
[ROW][C]28[/C][C]0.684317118434705[/C][C]0.63136576313059[/C][C]0.315682881565295[/C][/ROW]
[ROW][C]29[/C][C]0.568068504448708[/C][C]0.863862991102583[/C][C]0.431931495551292[/C][/ROW]
[ROW][C]30[/C][C]0.421750007060267[/C][C]0.843500014120535[/C][C]0.578249992939732[/C][/ROW]
[ROW][C]31[/C][C]0.524849490265092[/C][C]0.950301019469817[/C][C]0.475150509734908[/C][/ROW]
[ROW][C]32[/C][C]0.988229113123852[/C][C]0.0235417737522966[/C][C]0.0117708868761483[/C][/ROW]
[/TABLE]
Source: https://freestatistics.org/blog/index.php?pk=112405&T=5

Globally Unique Identifier (entire table): ba.freestatistics.org/blog/index.php?pk=112405&T=5

As an alternative you can also use a QR Code:  

The GUIDs for individual cells are displayed in the table below:

Goldfeld-Quandt test for Heteroskedasticity
p-valuesAlternative Hypothesis
breakpoint indexgreater2-sidedless
160.0936268301172660.1872536602345320.906373169882734
170.06815994631137460.1363198926227490.931840053688625
180.0358999744312750.071799948862550.964100025568725
190.6259709073823820.7480581852352350.374029092617618
200.6791152074625170.6417695850749650.320884792537483
210.5565357599828180.8869284800343650.443464240017182
220.4919917217783780.9839834435567560.508008278221622
230.3793500595821040.7587001191642070.620649940417896
240.3119464722705510.6238929445411030.688053527729449
250.2117642778770630.4235285557541250.788235722122937
260.2441420751027180.4882841502054360.755857924897282
270.3833664350733270.7667328701466540.616633564926673
280.6843171184347050.631365763130590.315682881565295
290.5680685044487080.8638629911025830.431931495551292
300.4217500070602670.8435000141205350.578249992939732
310.5248494902650920.9503010194698170.475150509734908
320.9882291131238520.02354177375229660.0117708868761483


Meta Analysis of Goldfeld-Quandt test for Heteroskedasticity
Description# significant tests% significant testsOK/NOK
1% type I error level00OK
5% type I error level10.0588235294117647NOK
10% type I error level20.117647058823529NOK

\begin{tabular}{lllllllll}
\hline
Meta Analysis of Goldfeld-Quandt test for Heteroskedasticity \tabularnewline
Description & # significant tests & % significant tests & OK/NOK \tabularnewline
1% type I error level & 0 & 0 & OK \tabularnewline
5% type I error level & 1 & 0.0588235294117647 & NOK \tabularnewline
10% type I error level & 2 & 0.117647058823529 & NOK \tabularnewline
\hline
\end{tabular}
%Source: https://freestatistics.org/blog/index.php?pk=112405&T=6

[TABLE]
[ROW][C]Meta Analysis of Goldfeld-Quandt test for Heteroskedasticity[/C][/ROW]
[ROW][C]Description[/C][C]# significant tests[/C][C]% significant tests[/C][C]OK/NOK[/C][/ROW]
[ROW][C]1% type I error level[/C][C]0[/C][C]0[/C][C]OK[/C][/ROW]
[ROW][C]5% type I error level[/C][C]1[/C][C]0.0588235294117647[/C][C]NOK[/C][/ROW]
[ROW][C]10% type I error level[/C][C]2[/C][C]0.117647058823529[/C][C]NOK[/C][/ROW]
[/TABLE]
Source: https://freestatistics.org/blog/index.php?pk=112405&T=6

Globally Unique Identifier (entire table): ba.freestatistics.org/blog/index.php?pk=112405&T=6

As an alternative you can also use a QR Code:  

The GUIDs for individual cells are displayed in the table below:

Meta Analysis of Goldfeld-Quandt test for Heteroskedasticity
Description# significant tests% significant testsOK/NOK
1% type I error level00OK
5% type I error level10.0588235294117647NOK
10% type I error level20.117647058823529NOK


Parameters (Session):
par1 = 12 ; par2 = Triple ; par3 = additive ;
Parameters (R input):
par1 = 1 ; par2 = Include Monthly Dummies ; par3 = Linear Trend ;
R code (references can be found in the software module):
library(lattice)
library(lmtest)
n25 <- 25 #minimum number of obs. for Goldfeld-Quandt test
par1 <- as.numeric(par1)
x <- t(y)
k <- length(x[1,])
n <- length(x[,1])
x1 <- cbind(x[,par1], x[,1:k!=par1])
mycolnames <- c(colnames(x)[par1], colnames(x)[1:k!=par1])
colnames(x1) <- mycolnames #colnames(x)[par1]
x <- x1
if (par3 == 'First Differences'){
x2 <- array(0, dim=c(n-1,k), dimnames=list(1:(n-1), paste('(1-B)',colnames(x),sep='')))
for (i in 1:n-1) {
for (j in 1:k) {
x2[i,j] <- x[i+1,j] - x[i,j]
}
}
x <- x2
}
if (par2 == 'Include Monthly Dummies'){
x2 <- array(0, dim=c(n,11), dimnames=list(1:n, paste('M', seq(1:11), sep ='')))
for (i in 1:11){
x2[seq(i,n,12),i] <- 1
}
x <- cbind(x, x2)
}
if (par2 == 'Include Quarterly Dummies'){
x2 <- array(0, dim=c(n,3), dimnames=list(1:n, paste('Q', seq(1:3), sep ='')))
for (i in 1:3){
x2[seq(i,n,4),i] <- 1
}
x <- cbind(x, x2)
}
k <- length(x[1,])
if (par3 == 'Linear Trend'){
x <- cbind(x, c(1:n))
colnames(x)[k+1] <- 't'
}
x
k <- length(x[1,])
df <- as.data.frame(x)
(mylm <- lm(df))
(mysum <- summary(mylm))
if (n > n25) {
kp3 <- k + 3
nmkm3 <- n - k - 3
gqarr <- array(NA, dim=c(nmkm3-kp3+1,3))
numgqtests <- 0
numsignificant1 <- 0
numsignificant5 <- 0
numsignificant10 <- 0
for (mypoint in kp3:nmkm3) {
j <- 0
numgqtests <- numgqtests + 1
for (myalt in c('greater', 'two.sided', 'less')) {
j <- j + 1
gqarr[mypoint-kp3+1,j] <- gqtest(mylm, point=mypoint, alternative=myalt)$p.value
}
if (gqarr[mypoint-kp3+1,2] < 0.01) numsignificant1 <- numsignificant1 + 1
if (gqarr[mypoint-kp3+1,2] < 0.05) numsignificant5 <- numsignificant5 + 1
if (gqarr[mypoint-kp3+1,2] < 0.10) numsignificant10 <- numsignificant10 + 1
}
gqarr
}
bitmap(file='test0.png')
plot(x[,1], type='l', main='Actuals and Interpolation', ylab='value of Actuals and Interpolation (dots)', xlab='time or index')
points(x[,1]-mysum$resid)
grid()
dev.off()
bitmap(file='test1.png')
plot(mysum$resid, type='b', pch=19, main='Residuals', ylab='value of Residuals', xlab='time or index')
grid()
dev.off()
bitmap(file='test2.png')
hist(mysum$resid, main='Residual Histogram', xlab='values of Residuals')
grid()
dev.off()
bitmap(file='test3.png')
densityplot(~mysum$resid,col='black',main='Residual Density Plot', xlab='values of Residuals')
dev.off()
bitmap(file='test4.png')
qqnorm(mysum$resid, main='Residual Normal Q-Q Plot')
qqline(mysum$resid)
grid()
dev.off()
(myerror <- as.ts(mysum$resid))
bitmap(file='test5.png')
dum <- cbind(lag(myerror,k=1),myerror)
dum
dum1 <- dum[2:length(myerror),]
dum1
z <- as.data.frame(dum1)
z
plot(z,main=paste('Residual Lag plot, lowess, and regression line'), ylab='values of Residuals', xlab='lagged values of Residuals')
lines(lowess(z))
abline(lm(z))
grid()
dev.off()
bitmap(file='test6.png')
acf(mysum$resid, lag.max=length(mysum$resid)/2, main='Residual Autocorrelation Function')
grid()
dev.off()
bitmap(file='test7.png')
pacf(mysum$resid, lag.max=length(mysum$resid)/2, main='Residual Partial Autocorrelation Function')
grid()
dev.off()
bitmap(file='test8.png')
opar <- par(mfrow = c(2,2), oma = c(0, 0, 1.1, 0))
plot(mylm, las = 1, sub='Residual Diagnostics')
par(opar)
dev.off()
if (n > n25) {
bitmap(file='test9.png')
plot(kp3:nmkm3,gqarr[,2], main='Goldfeld-Quandt test',ylab='2-sided p-value',xlab='breakpoint')
grid()
dev.off()
}
load(file='createtable')
a<-table.start()
a<-table.row.start(a)
a<-table.element(a, 'Multiple Linear Regression - Estimated Regression Equation', 1, TRUE)
a<-table.row.end(a)
myeq <- colnames(x)[1]
myeq <- paste(myeq, '[t] = ', sep='')
for (i in 1:k){
if (mysum$coefficients[i,1] > 0) myeq <- paste(myeq, '+', '')
myeq <- paste(myeq, mysum$coefficients[i,1], sep=' ')
if (rownames(mysum$coefficients)[i] != '(Intercept)') {
myeq <- paste(myeq, rownames(mysum$coefficients)[i], sep='')
if (rownames(mysum$coefficients)[i] != 't') myeq <- paste(myeq, '[t]', sep='')
}
}
myeq <- paste(myeq, ' + e[t]')
a<-table.row.start(a)
a<-table.element(a, myeq)
a<-table.row.end(a)
a<-table.end(a)
table.save(a,file='mytable1.tab')
a<-table.start()
a<-table.row.start(a)
a<-table.element(a,hyperlink('ols1.htm','Multiple Linear Regression - Ordinary Least Squares',''), 6, TRUE)
a<-table.row.end(a)
a<-table.row.start(a)
a<-table.element(a,'Variable',header=TRUE)
a<-table.element(a,'Parameter',header=TRUE)
a<-table.element(a,'S.D.',header=TRUE)
a<-table.element(a,'T-STAT
H0: parameter = 0',header=TRUE)
a<-table.element(a,'2-tail p-value',header=TRUE)
a<-table.element(a,'1-tail p-value',header=TRUE)
a<-table.row.end(a)
for (i in 1:k){
a<-table.row.start(a)
a<-table.element(a,rownames(mysum$coefficients)[i],header=TRUE)
a<-table.element(a,mysum$coefficients[i,1])
a<-table.element(a, round(mysum$coefficients[i,2],6))
a<-table.element(a, round(mysum$coefficients[i,3],4))
a<-table.element(a, round(mysum$coefficients[i,4],6))
a<-table.element(a, round(mysum$coefficients[i,4]/2,6))
a<-table.row.end(a)
}
a<-table.end(a)
table.save(a,file='mytable2.tab')
a<-table.start()
a<-table.row.start(a)
a<-table.element(a, 'Multiple Linear Regression - Regression Statistics', 2, TRUE)
a<-table.row.end(a)
a<-table.row.start(a)
a<-table.element(a, 'Multiple R',1,TRUE)
a<-table.element(a, sqrt(mysum$r.squared))
a<-table.row.end(a)
a<-table.row.start(a)
a<-table.element(a, 'R-squared',1,TRUE)
a<-table.element(a, mysum$r.squared)
a<-table.row.end(a)
a<-table.row.start(a)
a<-table.element(a, 'Adjusted R-squared',1,TRUE)
a<-table.element(a, mysum$adj.r.squared)
a<-table.row.end(a)
a<-table.row.start(a)
a<-table.element(a, 'F-TEST (value)',1,TRUE)
a<-table.element(a, mysum$fstatistic[1])
a<-table.row.end(a)
a<-table.row.start(a)
a<-table.element(a, 'F-TEST (DF numerator)',1,TRUE)
a<-table.element(a, mysum$fstatistic[2])
a<-table.row.end(a)
a<-table.row.start(a)
a<-table.element(a, 'F-TEST (DF denominator)',1,TRUE)
a<-table.element(a, mysum$fstatistic[3])
a<-table.row.end(a)
a<-table.row.start(a)
a<-table.element(a, 'p-value',1,TRUE)
a<-table.element(a, 1-pf(mysum$fstatistic[1],mysum$fstatistic[2],mysum$fstatistic[3]))
a<-table.row.end(a)
a<-table.row.start(a)
a<-table.element(a, 'Multiple Linear Regression - Residual Statistics', 2, TRUE)
a<-table.row.end(a)
a<-table.row.start(a)
a<-table.element(a, 'Residual Standard Deviation',1,TRUE)
a<-table.element(a, mysum$sigma)
a<-table.row.end(a)
a<-table.row.start(a)
a<-table.element(a, 'Sum Squared Residuals',1,TRUE)
a<-table.element(a, sum(myerror*myerror))
a<-table.row.end(a)
a<-table.end(a)
table.save(a,file='mytable3.tab')
a<-table.start()
a<-table.row.start(a)
a<-table.element(a, 'Multiple Linear Regression - Actuals, Interpolation, and Residuals', 4, TRUE)
a<-table.row.end(a)
a<-table.row.start(a)
a<-table.element(a, 'Time or Index', 1, TRUE)
a<-table.element(a, 'Actuals', 1, TRUE)
a<-table.element(a, 'Interpolation
Forecast', 1, TRUE)
a<-table.element(a, 'Residuals
Prediction Error', 1, TRUE)
a<-table.row.end(a)
for (i in 1:n) {
a<-table.row.start(a)
a<-table.element(a,i, 1, TRUE)
a<-table.element(a,x[i])
a<-table.element(a,x[i]-mysum$resid[i])
a<-table.element(a,mysum$resid[i])
a<-table.row.end(a)
}
a<-table.end(a)
table.save(a,file='mytable4.tab')
if (n > n25) {
a<-table.start()
a<-table.row.start(a)
a<-table.element(a,'Goldfeld-Quandt test for Heteroskedasticity',4,TRUE)
a<-table.row.end(a)
a<-table.row.start(a)
a<-table.element(a,'p-values',header=TRUE)
a<-table.element(a,'Alternative Hypothesis',3,header=TRUE)
a<-table.row.end(a)
a<-table.row.start(a)
a<-table.element(a,'breakpoint index',header=TRUE)
a<-table.element(a,'greater',header=TRUE)
a<-table.element(a,'2-sided',header=TRUE)
a<-table.element(a,'less',header=TRUE)
a<-table.row.end(a)
for (mypoint in kp3:nmkm3) {
a<-table.row.start(a)
a<-table.element(a,mypoint,header=TRUE)
a<-table.element(a,gqarr[mypoint-kp3+1,1])
a<-table.element(a,gqarr[mypoint-kp3+1,2])
a<-table.element(a,gqarr[mypoint-kp3+1,3])
a<-table.row.end(a)
}
a<-table.end(a)
table.save(a,file='mytable5.tab')
a<-table.start()
a<-table.row.start(a)
a<-table.element(a,'Meta Analysis of Goldfeld-Quandt test for Heteroskedasticity',4,TRUE)
a<-table.row.end(a)
a<-table.row.start(a)
a<-table.element(a,'Description',header=TRUE)
a<-table.element(a,'# significant tests',header=TRUE)
a<-table.element(a,'% significant tests',header=TRUE)
a<-table.element(a,'OK/NOK',header=TRUE)
a<-table.row.end(a)
a<-table.row.start(a)
a<-table.element(a,'1% type I error level',header=TRUE)
a<-table.element(a,numsignificant1)
a<-table.element(a,numsignificant1/numgqtests)
if (numsignificant1/numgqtests < 0.01) dum <- 'OK' else dum <- 'NOK'
a<-table.element(a,dum)
a<-table.row.end(a)
a<-table.row.start(a)
a<-table.element(a,'5% type I error level',header=TRUE)
a<-table.element(a,numsignificant5)
a<-table.element(a,numsignificant5/numgqtests)
if (numsignificant5/numgqtests < 0.05) dum <- 'OK' else dum <- 'NOK'
a<-table.element(a,dum)
a<-table.row.end(a)
a<-table.row.start(a)
a<-table.element(a,'10% type I error level',header=TRUE)
a<-table.element(a,numsignificant10)
a<-table.element(a,numsignificant10/numgqtests)
if (numsignificant10/numgqtests < 0.1) dum <- 'OK' else dum <- 'NOK'
a<-table.element(a,dum)
a<-table.row.end(a)
a<-table.end(a)
table.save(a,file='mytable6.tab')
}