| Multiple Linear Regression - Estimated Regression Equation |
| Y[t] = + 3992.02121212121 -1669.36750841751X[t] + e[t] |
| Multiple Linear Regression - Ordinary Least Squares | |||||
| Variable | Parameter | S.D. | T-STAT H0: parameter = 0 | 2-tail p-value | 1-tail p-value |
| (Intercept) | 3992.02121212121 | 66.550507 | 59.9848 | 0 | 0 |
| X | -1669.36750841751 | 99.207638 | -16.827 | 0 | 0 |
| Multiple Linear Regression - Regression Statistics | |
| Multiple R | 0.91103560619018 |
| R-squared | 0.829985875746308 |
| Adjusted R-squared | 0.827054597741934 |
| F-TEST (value) | 283.148126690071 |
| F-TEST (DF numerator) | 1 |
| F-TEST (DF denominator) | 58 |
| p-value | 0 |
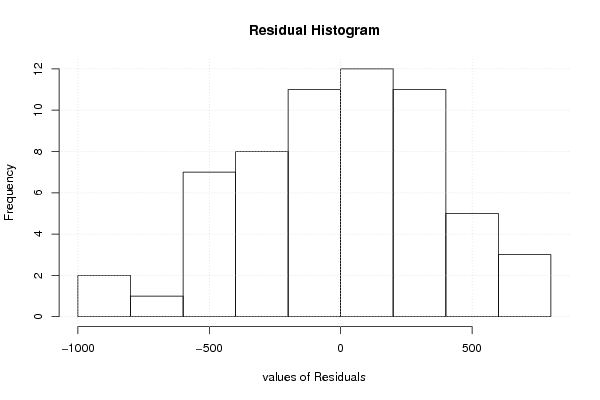
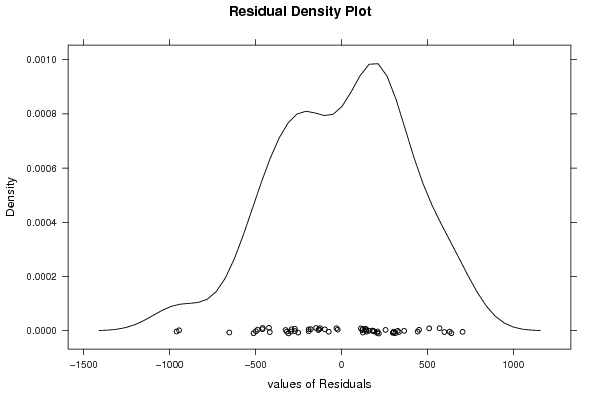
| Multiple Linear Regression - Residual Statistics | |
| Residual Standard Deviation | 382.303555342167 |
| Sum Squared Residuals | 8477048.48878115 |
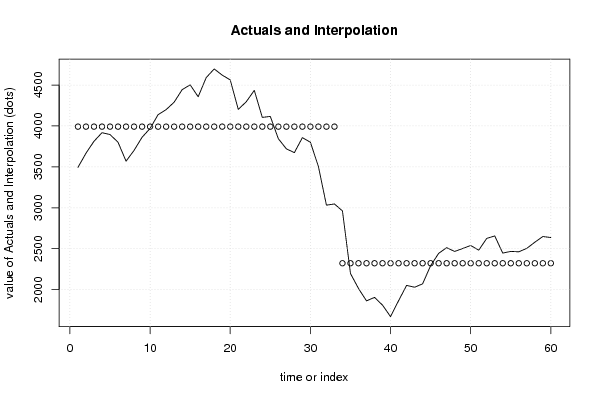
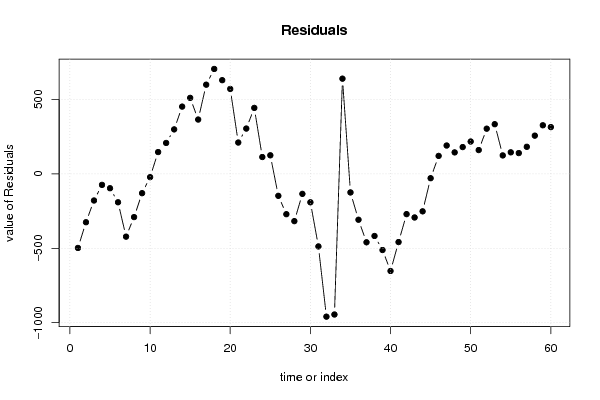
| Multiple Linear Regression - Actuals, Interpolation, and Residuals | |||
| Time or Index | Actuals | Interpolation Forecast | Residuals Prediction Error |
| 1 | 3494.17 | 3992.02121212122 | -497.851212121218 |
| 2 | 3667.03 | 3992.02121212121 | -324.991212121213 |
| 3 | 3813.06 | 3992.02121212121 | -178.961212121212 |
| 4 | 3917.96 | 3992.02121212121 | -74.0612121212119 |
| 5 | 3895.51 | 3992.02121212121 | -96.5112121212117 |
| 6 | 3801.06 | 3992.02121212121 | -190.961212121212 |
| 7 | 3570.12 | 3992.02121212121 | -421.901212121212 |
| 8 | 3701.61 | 3992.02121212121 | -290.411212121212 |
| 9 | 3862.27 | 3992.02121212121 | -129.751212121212 |
| 10 | 3970.1 | 3992.02121212121 | -21.9212121212121 |
| 11 | 4138.52 | 3992.02121212121 | 146.498787878788 |
| 12 | 4199.75 | 3992.02121212121 | 207.728787878788 |
| 13 | 4290.89 | 3992.02121212121 | 298.868787878788 |
| 14 | 4443.91 | 3992.02121212121 | 451.888787878788 |
| 15 | 4502.64 | 3992.02121212121 | 510.618787878788 |
| 16 | 4356.98 | 3992.02121212121 | 364.958787878788 |
| 17 | 4591.27 | 3992.02121212121 | 599.248787878789 |
| 18 | 4696.96 | 3992.02121212121 | 704.938787878788 |
| 19 | 4621.4 | 3992.02121212121 | 629.378787878788 |
| 20 | 4562.84 | 3992.02121212121 | 570.818787878788 |
| 21 | 4202.52 | 3992.02121212121 | 210.498787878789 |
| 22 | 4296.49 | 3992.02121212121 | 304.468787878788 |
| 23 | 4435.23 | 3992.02121212121 | 443.208787878788 |
| 24 | 4105.18 | 3992.02121212121 | 113.158787878788 |
| 25 | 4116.68 | 3992.02121212121 | 124.658787878788 |
| 26 | 3844.49 | 3992.02121212121 | -147.531212121212 |
| 27 | 3720.98 | 3992.02121212121 | -271.041212121212 |
| 28 | 3674.4 | 3992.02121212121 | -317.621212121212 |
| 29 | 3857.62 | 3992.02121212121 | -134.401212121212 |
| 30 | 3801.06 | 3992.02121212121 | -190.961212121212 |
| 31 | 3504.37 | 3992.02121212121 | -487.651212121212 |
| 32 | 3032.6 | 3992.02121212121 | -959.421212121212 |
| 33 | 3047.03 | 3992.02121212121 | -944.991212121212 |
| 34 | 2962.34 | 2322.6537037037 | 639.686296296296 |
| 35 | 2197.82 | 2322.6537037037 | -124.833703703703 |
| 36 | 2014.45 | 2322.6537037037 | -308.203703703704 |
| 37 | 1862.83 | 2322.6537037037 | -459.823703703704 |
| 38 | 1905.41 | 2322.6537037037 | -417.243703703704 |
| 39 | 1810.99 | 2322.6537037037 | -511.663703703704 |
| 40 | 1670.07 | 2322.6537037037 | -652.583703703704 |
| 41 | 1864.44 | 2322.6537037037 | -458.213703703704 |
| 42 | 2052.02 | 2322.6537037037 | -270.633703703704 |
| 43 | 2029.6 | 2322.6537037037 | -293.053703703704 |
| 44 | 2070.83 | 2322.6537037037 | -251.823703703704 |
| 45 | 2293.41 | 2322.6537037037 | -29.2437037037039 |
| 46 | 2443.27 | 2322.6537037037 | 120.616296296296 |
| 47 | 2513.17 | 2322.6537037037 | 190.516296296296 |
| 48 | 2466.92 | 2322.6537037037 | 144.266296296296 |
| 49 | 2502.66 | 2322.6537037037 | 180.006296296296 |
| 50 | 2539.91 | 2322.6537037037 | 217.256296296296 |
| 51 | 2482.6 | 2322.6537037037 | 159.946296296296 |
| 52 | 2626.15 | 2322.6537037037 | 303.496296296296 |
| 53 | 2656.32 | 2322.6537037037 | 333.666296296296 |
| 54 | 2446.66 | 2322.6537037037 | 124.006296296296 |
| 55 | 2467.38 | 2322.6537037037 | 144.726296296296 |
| 56 | 2462.32 | 2322.6537037037 | 139.666296296296 |
| 57 | 2504.58 | 2322.6537037037 | 181.926296296296 |
| 58 | 2579.39 | 2322.6537037037 | 256.736296296296 |
| 59 | 2649.24 | 2322.6537037037 | 326.586296296296 |
| 60 | 2636.87 | 2322.6537037037 | 314.216296296296 |
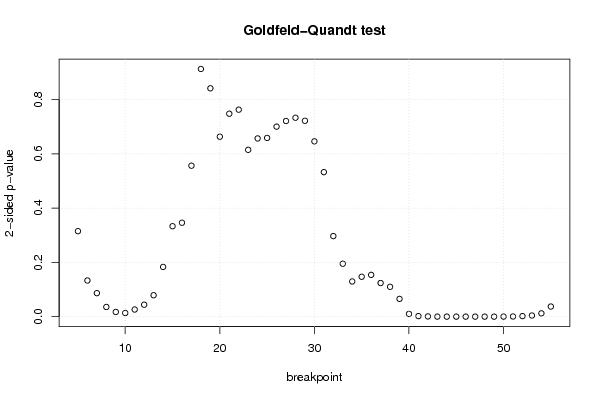
| Goldfeld-Quandt test for Heteroskedasticity | |||
| p-values | Alternative Hypothesis | ||
| breakpoint index | greater | 2-sided | less |
| 5 | 0.157540945542743 | 0.315081891085486 | 0.842459054457257 |
| 6 | 0.0666454543829469 | 0.133290908765894 | 0.933354545617053 |
| 7 | 0.0433052759776753 | 0.0866105519553506 | 0.956694724022325 |
| 8 | 0.0178490643265518 | 0.0356981286531036 | 0.982150935673448 |
| 9 | 0.0086489909407389 | 0.0172979818814778 | 0.99135100905926 |
| 10 | 0.00674734338732934 | 0.0134946867746587 | 0.99325265661267 |
| 11 | 0.0131422570595305 | 0.026284514119061 | 0.98685774294047 |
| 12 | 0.0220101328043126 | 0.0440202656086251 | 0.977989867195687 |
| 13 | 0.0394323184086035 | 0.078864636817207 | 0.960567681591396 |
| 14 | 0.0916265116079284 | 0.183253023215857 | 0.908373488392072 |
| 15 | 0.166641531295609 | 0.333283062591219 | 0.83335846870439 |
| 16 | 0.173066273153845 | 0.346132546307691 | 0.826933726846155 |
| 17 | 0.278165952630901 | 0.556331905261802 | 0.721834047369099 |
| 18 | 0.456468868518545 | 0.912937737037089 | 0.543531131481455 |
| 19 | 0.579194064905773 | 0.841611870188454 | 0.420805935094227 |
| 20 | 0.668411831886576 | 0.663176336226847 | 0.331588168113424 |
| 21 | 0.626009513523494 | 0.747980972953013 | 0.373990486476506 |
| 22 | 0.618583596263775 | 0.76283280747245 | 0.381416403736225 |
| 23 | 0.692539775617003 | 0.614920448765994 | 0.307460224382997 |
| 24 | 0.671596216866418 | 0.656807566267164 | 0.328403783133582 |
| 25 | 0.67068318391449 | 0.65863363217102 | 0.32931681608551 |
| 26 | 0.649861595780132 | 0.700276808439735 | 0.350138404219868 |
| 27 | 0.63945576984284 | 0.721088460314321 | 0.360544230157161 |
| 28 | 0.633418439460025 | 0.733163121079949 | 0.366581560539975 |
| 29 | 0.639049246679757 | 0.721901506640485 | 0.360950753320243 |
| 30 | 0.67692418057127 | 0.646151638857459 | 0.32307581942873 |
| 31 | 0.733666799369742 | 0.532666401260516 | 0.266333200630258 |
| 32 | 0.851560792909242 | 0.296878414181515 | 0.148439207090758 |
| 33 | 0.902486204415075 | 0.19502759116985 | 0.097513795584925 |
| 34 | 0.935157439642207 | 0.129685120715585 | 0.0648425603577926 |
| 35 | 0.926490045738136 | 0.147019908523728 | 0.0735099542618641 |
| 36 | 0.923011789916161 | 0.153976420167678 | 0.0769882100838392 |
| 37 | 0.938022634511362 | 0.123954730977276 | 0.0619773654886381 |
| 38 | 0.94504053230585 | 0.109918935388299 | 0.0549594676941494 |
| 39 | 0.967246084242814 | 0.0655078315143711 | 0.0327539157571856 |
| 40 | 0.994964302343284 | 0.0100713953134318 | 0.00503569765671589 |
| 41 | 0.999006680728048 | 0.00198663854390438 | 0.000993319271952192 |
| 42 | 0.999572241774368 | 0.000855516451264202 | 0.000427758225632101 |
| 43 | 0.999946349468839 | 0.000107301062322376 | 5.36505311611882e-05 |
| 44 | 0.999999287714874 | 1.42457025170788e-06 | 7.12285125853942e-07 |
| 45 | 0.999999859279817 | 2.81440365061556e-07 | 1.40720182530778e-07 |
| 46 | 0.999999646369343 | 7.07261313850974e-07 | 3.53630656925487e-07 |
| 47 | 0.99999845004669 | 3.09990662063267e-06 | 1.54995331031633e-06 |
| 48 | 0.999995087612457 | 9.82477508639392e-06 | 4.91238754319696e-06 |
| 49 | 0.999980041471908 | 3.99170561843931e-05 | 1.99585280921965e-05 |
| 50 | 0.999911272580272 | 0.000177454839456408 | 8.87274197282038e-05 |
| 51 | 0.999703915549716 | 0.000592168900567883 | 0.000296084450283941 |
| 52 | 0.999039482947308 | 0.00192103410538301 | 0.000960517052691506 |
| 53 | 0.997871045095119 | 0.00425790980976188 | 0.00212895490488094 |
| 54 | 0.993924600692434 | 0.0121507986151326 | 0.00607539930756628 |
| 55 | 0.98136092143177 | 0.0372781571364606 | 0.0186390785682303 |
| Meta Analysis of Goldfeld-Quandt test for Heteroskedasticity | |||
| Description | # significant tests | % significant tests | OK/NOK |
| 1% type I error level | 13 | 0.254901960784314 | NOK |
| 5% type I error level | 21 | 0.411764705882353 | NOK |
| 10% type I error level | 24 | 0.470588235294118 | NOK |