Free Statistics

of Irreproducible Research!

Author's title

Author*The author of this computation has been verified*
R Software Modulerwasp_autocorrelation.wasp
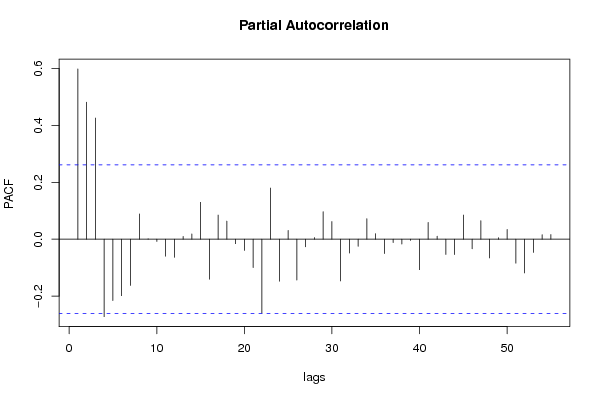
Title produced by software(Partial) Autocorrelation Function
Date of computationSun, 19 Dec 2010 11:18:22 +0000
Cite this page as followsStatistical Computations at FreeStatistics.org, Office for Research Development and Education, URL https://freestatistics.org/blog/index.php?v=date/2010/Dec/19/t1292757400tclgy4turrz2jpi.htm/, Retrieved Sat, 04 May 2024 20:04:52 +0000
Statistical Computations at FreeStatistics.org, Office for Research Development and Education, URL https://freestatistics.org/blog/index.php?pk=112287, Retrieved Sat, 04 May 2024 20:04:52 +0000
QR Codes:

Original text written by user:
IsPrivate?No (this computation is public)
User-defined keywords
Estimated Impact172
Family? (F = Feedback message, R = changed R code, M = changed R Module, P = changed Parameters, D = changed Data)
-     [Univariate Data Series] [data set] [2008-12-01 19:54:57] [b98453cac15ba1066b407e146608df68]
- RMP   [(Partial) Autocorrelation Function] [Unemployment] [2010-11-29 09:09:37] [b98453cac15ba1066b407e146608df68]
-   PD    [(Partial) Autocorrelation Function] [ws 9: acf (zonder...] [2010-12-07 09:32:15] [bd591a1ebb67d263a02e7adae3fa1a4d]
-             [(Partial) Autocorrelation Function] [acf (zonder seizo...] [2010-12-19 11:18:22] [09489ba95453d3f5c9e6f2eaeda915af] [Current]
Feedback Forum

Post a new message
Dataseries X:
94.6
95.9
104.7
102.8
98.1
113.9
80.9
95.7
113.2
105.9
108.8
102.3
99
100.7
115.5
100.7
109.9
114.6
85.4
100.5
114.8
116.5
112.9
102
106
105.3
118.8
106.1
109.3
117.2
92.5
104.2
112.5
122.4
113.3
100
110.7
112.8
109.8
117.3
109.1
115.9
96
99.8
116.8
115.7
99.4
94.3
91
93.2
103.1
94.1
91.8
102.7
82.6
89.1
104.5
105.1
95.1
88.7
86.3
91.8
111.5
99.7
97.5
111.7
86.2
95.4


Summary of computational transaction
Raw Inputview raw input (R code)
Raw Outputview raw output of R engine
Computing time2 seconds
R Server'Gwilym Jenkins' @ 72.249.127.135

\begin{tabular}{lllllllll}
\hline
Summary of computational transaction \tabularnewline
Raw Input & view raw input (R code)  \tabularnewline
Raw Output & view raw output of R engine  \tabularnewline
Computing time & 2 seconds \tabularnewline
R Server & 'Gwilym Jenkins' @ 72.249.127.135 \tabularnewline
\hline
\end{tabular}
%Source: https://freestatistics.org/blog/index.php?pk=112287&T=0

[TABLE]
[ROW][C]Summary of computational transaction[/C][/ROW]
[ROW][C]Raw Input[/C][C]view raw input (R code) [/C][/ROW]
[ROW][C]Raw Output[/C][C]view raw output of R engine [/C][/ROW]
[ROW][C]Computing time[/C][C]2 seconds[/C][/ROW]
[ROW][C]R Server[/C][C]'Gwilym Jenkins' @ 72.249.127.135[/C][/ROW]
[/TABLE]
Source: https://freestatistics.org/blog/index.php?pk=112287&T=0

Globally Unique Identifier (entire table): ba.freestatistics.org/blog/index.php?pk=112287&T=0

As an alternative you can also use a QR Code:  

The GUIDs for individual cells are displayed in the table below:

Summary of computational transaction
Raw Inputview raw input (R code)
Raw Outputview raw output of R engine
Computing time2 seconds
R Server'Gwilym Jenkins' @ 72.249.127.135


Autocorrelation Function
Time lag kACF(k)T-STATP-value
10.5988294.48121.9e-05
20.6677854.99723e-06
30.7055215.27961e-06
40.4530173.39010.000643
50.4742083.54860.000396
60.3616682.70650.004498
70.1992721.49120.070759
80.2269221.69810.047517
90.0627780.46980.320165
100.0039980.02990.48812
11-0.01969-0.14730.441693
12-0.136933-1.02470.154952
13-0.131141-0.98140.165315
14-0.173678-1.29970.099516
15-0.184699-1.38220.086205
16-0.230349-1.72380.045133
17-0.165248-1.23660.110699
18-0.170027-1.27240.104251
19-0.185468-1.38790.08533
20-0.115669-0.86560.195204
21-0.135047-1.01060.158277
22-0.183711-1.37480.087339
23-0.025169-0.18830.425643
24-0.207048-1.54940.063459
25-0.119086-0.89120.188329
26-0.115043-0.86090.196481
27-0.225269-1.68580.048704
28-0.126941-0.94990.173112
29-0.183249-1.37130.087875
30-0.216472-1.61990.055433
31-0.167767-1.25550.107264
32-0.214099-1.60220.057372
33-0.205971-1.54130.064432
34-0.167738-1.25520.107303
35-0.220486-1.650.052274
36-0.151087-1.13060.131514
37-0.141235-1.05690.147547
38-0.121109-0.90630.18433
39-0.112557-0.84230.201601
40-0.074144-0.55480.290607
41-0.036217-0.2710.393684
42-0.028515-0.21340.4159
43-0.012449-0.09320.463056
440.0089760.06720.473343
450.015370.1150.454422
460.0535140.40050.345169
470.0289760.21680.414563
480.0579510.43370.333098
490.0698090.52240.301725
500.05250.39290.347952
510.0662170.49550.311084
520.0322450.24130.405102
530.0391370.29290.385352
540.0154870.11590.454076
550.0091330.06830.472876
56NANANA
57NANANA
58NANANA
59NANANA
60NANANA

\begin{tabular}{lllllllll}
\hline
Autocorrelation Function \tabularnewline
Time lag k & ACF(k) & T-STAT & P-value \tabularnewline
1 & 0.598829 & 4.4812 & 1.9e-05 \tabularnewline
2 & 0.667785 & 4.9972 & 3e-06 \tabularnewline
3 & 0.705521 & 5.2796 & 1e-06 \tabularnewline
4 & 0.453017 & 3.3901 & 0.000643 \tabularnewline
5 & 0.474208 & 3.5486 & 0.000396 \tabularnewline
6 & 0.361668 & 2.7065 & 0.004498 \tabularnewline
7 & 0.199272 & 1.4912 & 0.070759 \tabularnewline
8 & 0.226922 & 1.6981 & 0.047517 \tabularnewline
9 & 0.062778 & 0.4698 & 0.320165 \tabularnewline
10 & 0.003998 & 0.0299 & 0.48812 \tabularnewline
11 & -0.01969 & -0.1473 & 0.441693 \tabularnewline
12 & -0.136933 & -1.0247 & 0.154952 \tabularnewline
13 & -0.131141 & -0.9814 & 0.165315 \tabularnewline
14 & -0.173678 & -1.2997 & 0.099516 \tabularnewline
15 & -0.184699 & -1.3822 & 0.086205 \tabularnewline
16 & -0.230349 & -1.7238 & 0.045133 \tabularnewline
17 & -0.165248 & -1.2366 & 0.110699 \tabularnewline
18 & -0.170027 & -1.2724 & 0.104251 \tabularnewline
19 & -0.185468 & -1.3879 & 0.08533 \tabularnewline
20 & -0.115669 & -0.8656 & 0.195204 \tabularnewline
21 & -0.135047 & -1.0106 & 0.158277 \tabularnewline
22 & -0.183711 & -1.3748 & 0.087339 \tabularnewline
23 & -0.025169 & -0.1883 & 0.425643 \tabularnewline
24 & -0.207048 & -1.5494 & 0.063459 \tabularnewline
25 & -0.119086 & -0.8912 & 0.188329 \tabularnewline
26 & -0.115043 & -0.8609 & 0.196481 \tabularnewline
27 & -0.225269 & -1.6858 & 0.048704 \tabularnewline
28 & -0.126941 & -0.9499 & 0.173112 \tabularnewline
29 & -0.183249 & -1.3713 & 0.087875 \tabularnewline
30 & -0.216472 & -1.6199 & 0.055433 \tabularnewline
31 & -0.167767 & -1.2555 & 0.107264 \tabularnewline
32 & -0.214099 & -1.6022 & 0.057372 \tabularnewline
33 & -0.205971 & -1.5413 & 0.064432 \tabularnewline
34 & -0.167738 & -1.2552 & 0.107303 \tabularnewline
35 & -0.220486 & -1.65 & 0.052274 \tabularnewline
36 & -0.151087 & -1.1306 & 0.131514 \tabularnewline
37 & -0.141235 & -1.0569 & 0.147547 \tabularnewline
38 & -0.121109 & -0.9063 & 0.18433 \tabularnewline
39 & -0.112557 & -0.8423 & 0.201601 \tabularnewline
40 & -0.074144 & -0.5548 & 0.290607 \tabularnewline
41 & -0.036217 & -0.271 & 0.393684 \tabularnewline
42 & -0.028515 & -0.2134 & 0.4159 \tabularnewline
43 & -0.012449 & -0.0932 & 0.463056 \tabularnewline
44 & 0.008976 & 0.0672 & 0.473343 \tabularnewline
45 & 0.01537 & 0.115 & 0.454422 \tabularnewline
46 & 0.053514 & 0.4005 & 0.345169 \tabularnewline
47 & 0.028976 & 0.2168 & 0.414563 \tabularnewline
48 & 0.057951 & 0.4337 & 0.333098 \tabularnewline
49 & 0.069809 & 0.5224 & 0.301725 \tabularnewline
50 & 0.0525 & 0.3929 & 0.347952 \tabularnewline
51 & 0.066217 & 0.4955 & 0.311084 \tabularnewline
52 & 0.032245 & 0.2413 & 0.405102 \tabularnewline
53 & 0.039137 & 0.2929 & 0.385352 \tabularnewline
54 & 0.015487 & 0.1159 & 0.454076 \tabularnewline
55 & 0.009133 & 0.0683 & 0.472876 \tabularnewline
56 & NA & NA & NA \tabularnewline
57 & NA & NA & NA \tabularnewline
58 & NA & NA & NA \tabularnewline
59 & NA & NA & NA \tabularnewline
60 & NA & NA & NA \tabularnewline
\hline
\end{tabular}
%Source: https://freestatistics.org/blog/index.php?pk=112287&T=1

[TABLE]
[ROW][C]Autocorrelation Function[/C][/ROW]
[ROW][C]Time lag k[/C][C]ACF(k)[/C][C]T-STAT[/C][C]P-value[/C][/ROW]
[ROW][C]1[/C][C]0.598829[/C][C]4.4812[/C][C]1.9e-05[/C][/ROW]
[ROW][C]2[/C][C]0.667785[/C][C]4.9972[/C][C]3e-06[/C][/ROW]
[ROW][C]3[/C][C]0.705521[/C][C]5.2796[/C][C]1e-06[/C][/ROW]
[ROW][C]4[/C][C]0.453017[/C][C]3.3901[/C][C]0.000643[/C][/ROW]
[ROW][C]5[/C][C]0.474208[/C][C]3.5486[/C][C]0.000396[/C][/ROW]
[ROW][C]6[/C][C]0.361668[/C][C]2.7065[/C][C]0.004498[/C][/ROW]
[ROW][C]7[/C][C]0.199272[/C][C]1.4912[/C][C]0.070759[/C][/ROW]
[ROW][C]8[/C][C]0.226922[/C][C]1.6981[/C][C]0.047517[/C][/ROW]
[ROW][C]9[/C][C]0.062778[/C][C]0.4698[/C][C]0.320165[/C][/ROW]
[ROW][C]10[/C][C]0.003998[/C][C]0.0299[/C][C]0.48812[/C][/ROW]
[ROW][C]11[/C][C]-0.01969[/C][C]-0.1473[/C][C]0.441693[/C][/ROW]
[ROW][C]12[/C][C]-0.136933[/C][C]-1.0247[/C][C]0.154952[/C][/ROW]
[ROW][C]13[/C][C]-0.131141[/C][C]-0.9814[/C][C]0.165315[/C][/ROW]
[ROW][C]14[/C][C]-0.173678[/C][C]-1.2997[/C][C]0.099516[/C][/ROW]
[ROW][C]15[/C][C]-0.184699[/C][C]-1.3822[/C][C]0.086205[/C][/ROW]
[ROW][C]16[/C][C]-0.230349[/C][C]-1.7238[/C][C]0.045133[/C][/ROW]
[ROW][C]17[/C][C]-0.165248[/C][C]-1.2366[/C][C]0.110699[/C][/ROW]
[ROW][C]18[/C][C]-0.170027[/C][C]-1.2724[/C][C]0.104251[/C][/ROW]
[ROW][C]19[/C][C]-0.185468[/C][C]-1.3879[/C][C]0.08533[/C][/ROW]
[ROW][C]20[/C][C]-0.115669[/C][C]-0.8656[/C][C]0.195204[/C][/ROW]
[ROW][C]21[/C][C]-0.135047[/C][C]-1.0106[/C][C]0.158277[/C][/ROW]
[ROW][C]22[/C][C]-0.183711[/C][C]-1.3748[/C][C]0.087339[/C][/ROW]
[ROW][C]23[/C][C]-0.025169[/C][C]-0.1883[/C][C]0.425643[/C][/ROW]
[ROW][C]24[/C][C]-0.207048[/C][C]-1.5494[/C][C]0.063459[/C][/ROW]
[ROW][C]25[/C][C]-0.119086[/C][C]-0.8912[/C][C]0.188329[/C][/ROW]
[ROW][C]26[/C][C]-0.115043[/C][C]-0.8609[/C][C]0.196481[/C][/ROW]
[ROW][C]27[/C][C]-0.225269[/C][C]-1.6858[/C][C]0.048704[/C][/ROW]
[ROW][C]28[/C][C]-0.126941[/C][C]-0.9499[/C][C]0.173112[/C][/ROW]
[ROW][C]29[/C][C]-0.183249[/C][C]-1.3713[/C][C]0.087875[/C][/ROW]
[ROW][C]30[/C][C]-0.216472[/C][C]-1.6199[/C][C]0.055433[/C][/ROW]
[ROW][C]31[/C][C]-0.167767[/C][C]-1.2555[/C][C]0.107264[/C][/ROW]
[ROW][C]32[/C][C]-0.214099[/C][C]-1.6022[/C][C]0.057372[/C][/ROW]
[ROW][C]33[/C][C]-0.205971[/C][C]-1.5413[/C][C]0.064432[/C][/ROW]
[ROW][C]34[/C][C]-0.167738[/C][C]-1.2552[/C][C]0.107303[/C][/ROW]
[ROW][C]35[/C][C]-0.220486[/C][C]-1.65[/C][C]0.052274[/C][/ROW]
[ROW][C]36[/C][C]-0.151087[/C][C]-1.1306[/C][C]0.131514[/C][/ROW]
[ROW][C]37[/C][C]-0.141235[/C][C]-1.0569[/C][C]0.147547[/C][/ROW]
[ROW][C]38[/C][C]-0.121109[/C][C]-0.9063[/C][C]0.18433[/C][/ROW]
[ROW][C]39[/C][C]-0.112557[/C][C]-0.8423[/C][C]0.201601[/C][/ROW]
[ROW][C]40[/C][C]-0.074144[/C][C]-0.5548[/C][C]0.290607[/C][/ROW]
[ROW][C]41[/C][C]-0.036217[/C][C]-0.271[/C][C]0.393684[/C][/ROW]
[ROW][C]42[/C][C]-0.028515[/C][C]-0.2134[/C][C]0.4159[/C][/ROW]
[ROW][C]43[/C][C]-0.012449[/C][C]-0.0932[/C][C]0.463056[/C][/ROW]
[ROW][C]44[/C][C]0.008976[/C][C]0.0672[/C][C]0.473343[/C][/ROW]
[ROW][C]45[/C][C]0.01537[/C][C]0.115[/C][C]0.454422[/C][/ROW]
[ROW][C]46[/C][C]0.053514[/C][C]0.4005[/C][C]0.345169[/C][/ROW]
[ROW][C]47[/C][C]0.028976[/C][C]0.2168[/C][C]0.414563[/C][/ROW]
[ROW][C]48[/C][C]0.057951[/C][C]0.4337[/C][C]0.333098[/C][/ROW]
[ROW][C]49[/C][C]0.069809[/C][C]0.5224[/C][C]0.301725[/C][/ROW]
[ROW][C]50[/C][C]0.0525[/C][C]0.3929[/C][C]0.347952[/C][/ROW]
[ROW][C]51[/C][C]0.066217[/C][C]0.4955[/C][C]0.311084[/C][/ROW]
[ROW][C]52[/C][C]0.032245[/C][C]0.2413[/C][C]0.405102[/C][/ROW]
[ROW][C]53[/C][C]0.039137[/C][C]0.2929[/C][C]0.385352[/C][/ROW]
[ROW][C]54[/C][C]0.015487[/C][C]0.1159[/C][C]0.454076[/C][/ROW]
[ROW][C]55[/C][C]0.009133[/C][C]0.0683[/C][C]0.472876[/C][/ROW]
[ROW][C]56[/C][C]NA[/C][C]NA[/C][C]NA[/C][/ROW]
[ROW][C]57[/C][C]NA[/C][C]NA[/C][C]NA[/C][/ROW]
[ROW][C]58[/C][C]NA[/C][C]NA[/C][C]NA[/C][/ROW]
[ROW][C]59[/C][C]NA[/C][C]NA[/C][C]NA[/C][/ROW]
[ROW][C]60[/C][C]NA[/C][C]NA[/C][C]NA[/C][/ROW]
[/TABLE]
Source: https://freestatistics.org/blog/index.php?pk=112287&T=1

Globally Unique Identifier (entire table): ba.freestatistics.org/blog/index.php?pk=112287&T=1

As an alternative you can also use a QR Code:  

The GUIDs for individual cells are displayed in the table below:

Autocorrelation Function
Time lag kACF(k)T-STATP-value
10.5988294.48121.9e-05
20.6677854.99723e-06
30.7055215.27961e-06
40.4530173.39010.000643
50.4742083.54860.000396
60.3616682.70650.004498
70.1992721.49120.070759
80.2269221.69810.047517
90.0627780.46980.320165
100.0039980.02990.48812
11-0.01969-0.14730.441693
12-0.136933-1.02470.154952
13-0.131141-0.98140.165315
14-0.173678-1.29970.099516
15-0.184699-1.38220.086205
16-0.230349-1.72380.045133
17-0.165248-1.23660.110699
18-0.170027-1.27240.104251
19-0.185468-1.38790.08533
20-0.115669-0.86560.195204
21-0.135047-1.01060.158277
22-0.183711-1.37480.087339
23-0.025169-0.18830.425643
24-0.207048-1.54940.063459
25-0.119086-0.89120.188329
26-0.115043-0.86090.196481
27-0.225269-1.68580.048704
28-0.126941-0.94990.173112
29-0.183249-1.37130.087875
30-0.216472-1.61990.055433
31-0.167767-1.25550.107264
32-0.214099-1.60220.057372
33-0.205971-1.54130.064432
34-0.167738-1.25520.107303
35-0.220486-1.650.052274
36-0.151087-1.13060.131514
37-0.141235-1.05690.147547
38-0.121109-0.90630.18433
39-0.112557-0.84230.201601
40-0.074144-0.55480.290607
41-0.036217-0.2710.393684
42-0.028515-0.21340.4159
43-0.012449-0.09320.463056
440.0089760.06720.473343
450.015370.1150.454422
460.0535140.40050.345169
470.0289760.21680.414563
480.0579510.43370.333098
490.0698090.52240.301725
500.05250.39290.347952
510.0662170.49550.311084
520.0322450.24130.405102
530.0391370.29290.385352
540.0154870.11590.454076
550.0091330.06830.472876
56NANANA
57NANANA
58NANANA
59NANANA
60NANANA


Partial Autocorrelation Function
Time lag kPACF(k)T-STATP-value
10.5988294.48121.9e-05
20.482053.60730.00033
30.4259763.18770.001174
4-0.272197-2.03690.023197
5-0.215462-1.61240.056252
6-0.198286-1.48380.07173
7-0.162278-1.21440.11485
80.088930.66550.254234
90.0016780.01260.495012
10-0.007714-0.05770.477085
11-0.059472-0.4450.329001
12-0.063488-0.47510.318282
130.0098320.07360.470804
140.0186820.13980.444658
150.1299050.97210.167586
16-0.140535-1.05170.148735
170.0848680.63510.263976
180.0637320.47690.317636
19-0.015587-0.11660.453781
20-0.039549-0.2960.384179
21-0.099568-0.74510.229664
22-0.26001-1.94570.028356
230.1797971.34550.091947
24-0.147713-1.10540.13686
250.0311690.23320.40821
26-0.143657-1.0750.143486
27-0.026707-0.19990.421159
280.0060380.04520.482059
290.0968670.72490.235771
300.0624070.4670.321152
31-0.146831-1.09880.138282
32-0.048467-0.36270.359099
33-0.024844-0.18590.426591
340.0723320.54130.29523
350.0194870.14580.44229
36-0.050566-0.37840.353282
37-0.011482-0.08590.465917
38-0.016918-0.12660.449855
39-0.004029-0.03020.488027
40-0.106837-0.79950.213692
410.0591750.44280.3298
420.0108720.08140.467723
43-0.053462-0.40010.345313
44-0.053752-0.40220.344518
450.0850020.63610.263651
46-0.033718-0.25230.400858
470.0651640.48760.313853
48-0.065916-0.49330.311875
490.0054810.0410.483715
500.0344790.2580.398669
51-0.084341-0.63110.265256
52-0.11858-0.88740.189337
53-0.046181-0.34560.365473
540.0159150.11910.452811
550.0163640.12250.451487
56NANANA
57NANANA
58NANANA
59NANANA
60NANANA

\begin{tabular}{lllllllll}
\hline
Partial Autocorrelation Function \tabularnewline
Time lag k & PACF(k) & T-STAT & P-value \tabularnewline
1 & 0.598829 & 4.4812 & 1.9e-05 \tabularnewline
2 & 0.48205 & 3.6073 & 0.00033 \tabularnewline
3 & 0.425976 & 3.1877 & 0.001174 \tabularnewline
4 & -0.272197 & -2.0369 & 0.023197 \tabularnewline
5 & -0.215462 & -1.6124 & 0.056252 \tabularnewline
6 & -0.198286 & -1.4838 & 0.07173 \tabularnewline
7 & -0.162278 & -1.2144 & 0.11485 \tabularnewline
8 & 0.08893 & 0.6655 & 0.254234 \tabularnewline
9 & 0.001678 & 0.0126 & 0.495012 \tabularnewline
10 & -0.007714 & -0.0577 & 0.477085 \tabularnewline
11 & -0.059472 & -0.445 & 0.329001 \tabularnewline
12 & -0.063488 & -0.4751 & 0.318282 \tabularnewline
13 & 0.009832 & 0.0736 & 0.470804 \tabularnewline
14 & 0.018682 & 0.1398 & 0.444658 \tabularnewline
15 & 0.129905 & 0.9721 & 0.167586 \tabularnewline
16 & -0.140535 & -1.0517 & 0.148735 \tabularnewline
17 & 0.084868 & 0.6351 & 0.263976 \tabularnewline
18 & 0.063732 & 0.4769 & 0.317636 \tabularnewline
19 & -0.015587 & -0.1166 & 0.453781 \tabularnewline
20 & -0.039549 & -0.296 & 0.384179 \tabularnewline
21 & -0.099568 & -0.7451 & 0.229664 \tabularnewline
22 & -0.26001 & -1.9457 & 0.028356 \tabularnewline
23 & 0.179797 & 1.3455 & 0.091947 \tabularnewline
24 & -0.147713 & -1.1054 & 0.13686 \tabularnewline
25 & 0.031169 & 0.2332 & 0.40821 \tabularnewline
26 & -0.143657 & -1.075 & 0.143486 \tabularnewline
27 & -0.026707 & -0.1999 & 0.421159 \tabularnewline
28 & 0.006038 & 0.0452 & 0.482059 \tabularnewline
29 & 0.096867 & 0.7249 & 0.235771 \tabularnewline
30 & 0.062407 & 0.467 & 0.321152 \tabularnewline
31 & -0.146831 & -1.0988 & 0.138282 \tabularnewline
32 & -0.048467 & -0.3627 & 0.359099 \tabularnewline
33 & -0.024844 & -0.1859 & 0.426591 \tabularnewline
34 & 0.072332 & 0.5413 & 0.29523 \tabularnewline
35 & 0.019487 & 0.1458 & 0.44229 \tabularnewline
36 & -0.050566 & -0.3784 & 0.353282 \tabularnewline
37 & -0.011482 & -0.0859 & 0.465917 \tabularnewline
38 & -0.016918 & -0.1266 & 0.449855 \tabularnewline
39 & -0.004029 & -0.0302 & 0.488027 \tabularnewline
40 & -0.106837 & -0.7995 & 0.213692 \tabularnewline
41 & 0.059175 & 0.4428 & 0.3298 \tabularnewline
42 & 0.010872 & 0.0814 & 0.467723 \tabularnewline
43 & -0.053462 & -0.4001 & 0.345313 \tabularnewline
44 & -0.053752 & -0.4022 & 0.344518 \tabularnewline
45 & 0.085002 & 0.6361 & 0.263651 \tabularnewline
46 & -0.033718 & -0.2523 & 0.400858 \tabularnewline
47 & 0.065164 & 0.4876 & 0.313853 \tabularnewline
48 & -0.065916 & -0.4933 & 0.311875 \tabularnewline
49 & 0.005481 & 0.041 & 0.483715 \tabularnewline
50 & 0.034479 & 0.258 & 0.398669 \tabularnewline
51 & -0.084341 & -0.6311 & 0.265256 \tabularnewline
52 & -0.11858 & -0.8874 & 0.189337 \tabularnewline
53 & -0.046181 & -0.3456 & 0.365473 \tabularnewline
54 & 0.015915 & 0.1191 & 0.452811 \tabularnewline
55 & 0.016364 & 0.1225 & 0.451487 \tabularnewline
56 & NA & NA & NA \tabularnewline
57 & NA & NA & NA \tabularnewline
58 & NA & NA & NA \tabularnewline
59 & NA & NA & NA \tabularnewline
60 & NA & NA & NA \tabularnewline
\hline
\end{tabular}
%Source: https://freestatistics.org/blog/index.php?pk=112287&T=2

[TABLE]
[ROW][C]Partial Autocorrelation Function[/C][/ROW]
[ROW][C]Time lag k[/C][C]PACF(k)[/C][C]T-STAT[/C][C]P-value[/C][/ROW]
[ROW][C]1[/C][C]0.598829[/C][C]4.4812[/C][C]1.9e-05[/C][/ROW]
[ROW][C]2[/C][C]0.48205[/C][C]3.6073[/C][C]0.00033[/C][/ROW]
[ROW][C]3[/C][C]0.425976[/C][C]3.1877[/C][C]0.001174[/C][/ROW]
[ROW][C]4[/C][C]-0.272197[/C][C]-2.0369[/C][C]0.023197[/C][/ROW]
[ROW][C]5[/C][C]-0.215462[/C][C]-1.6124[/C][C]0.056252[/C][/ROW]
[ROW][C]6[/C][C]-0.198286[/C][C]-1.4838[/C][C]0.07173[/C][/ROW]
[ROW][C]7[/C][C]-0.162278[/C][C]-1.2144[/C][C]0.11485[/C][/ROW]
[ROW][C]8[/C][C]0.08893[/C][C]0.6655[/C][C]0.254234[/C][/ROW]
[ROW][C]9[/C][C]0.001678[/C][C]0.0126[/C][C]0.495012[/C][/ROW]
[ROW][C]10[/C][C]-0.007714[/C][C]-0.0577[/C][C]0.477085[/C][/ROW]
[ROW][C]11[/C][C]-0.059472[/C][C]-0.445[/C][C]0.329001[/C][/ROW]
[ROW][C]12[/C][C]-0.063488[/C][C]-0.4751[/C][C]0.318282[/C][/ROW]
[ROW][C]13[/C][C]0.009832[/C][C]0.0736[/C][C]0.470804[/C][/ROW]
[ROW][C]14[/C][C]0.018682[/C][C]0.1398[/C][C]0.444658[/C][/ROW]
[ROW][C]15[/C][C]0.129905[/C][C]0.9721[/C][C]0.167586[/C][/ROW]
[ROW][C]16[/C][C]-0.140535[/C][C]-1.0517[/C][C]0.148735[/C][/ROW]
[ROW][C]17[/C][C]0.084868[/C][C]0.6351[/C][C]0.263976[/C][/ROW]
[ROW][C]18[/C][C]0.063732[/C][C]0.4769[/C][C]0.317636[/C][/ROW]
[ROW][C]19[/C][C]-0.015587[/C][C]-0.1166[/C][C]0.453781[/C][/ROW]
[ROW][C]20[/C][C]-0.039549[/C][C]-0.296[/C][C]0.384179[/C][/ROW]
[ROW][C]21[/C][C]-0.099568[/C][C]-0.7451[/C][C]0.229664[/C][/ROW]
[ROW][C]22[/C][C]-0.26001[/C][C]-1.9457[/C][C]0.028356[/C][/ROW]
[ROW][C]23[/C][C]0.179797[/C][C]1.3455[/C][C]0.091947[/C][/ROW]
[ROW][C]24[/C][C]-0.147713[/C][C]-1.1054[/C][C]0.13686[/C][/ROW]
[ROW][C]25[/C][C]0.031169[/C][C]0.2332[/C][C]0.40821[/C][/ROW]
[ROW][C]26[/C][C]-0.143657[/C][C]-1.075[/C][C]0.143486[/C][/ROW]
[ROW][C]27[/C][C]-0.026707[/C][C]-0.1999[/C][C]0.421159[/C][/ROW]
[ROW][C]28[/C][C]0.006038[/C][C]0.0452[/C][C]0.482059[/C][/ROW]
[ROW][C]29[/C][C]0.096867[/C][C]0.7249[/C][C]0.235771[/C][/ROW]
[ROW][C]30[/C][C]0.062407[/C][C]0.467[/C][C]0.321152[/C][/ROW]
[ROW][C]31[/C][C]-0.146831[/C][C]-1.0988[/C][C]0.138282[/C][/ROW]
[ROW][C]32[/C][C]-0.048467[/C][C]-0.3627[/C][C]0.359099[/C][/ROW]
[ROW][C]33[/C][C]-0.024844[/C][C]-0.1859[/C][C]0.426591[/C][/ROW]
[ROW][C]34[/C][C]0.072332[/C][C]0.5413[/C][C]0.29523[/C][/ROW]
[ROW][C]35[/C][C]0.019487[/C][C]0.1458[/C][C]0.44229[/C][/ROW]
[ROW][C]36[/C][C]-0.050566[/C][C]-0.3784[/C][C]0.353282[/C][/ROW]
[ROW][C]37[/C][C]-0.011482[/C][C]-0.0859[/C][C]0.465917[/C][/ROW]
[ROW][C]38[/C][C]-0.016918[/C][C]-0.1266[/C][C]0.449855[/C][/ROW]
[ROW][C]39[/C][C]-0.004029[/C][C]-0.0302[/C][C]0.488027[/C][/ROW]
[ROW][C]40[/C][C]-0.106837[/C][C]-0.7995[/C][C]0.213692[/C][/ROW]
[ROW][C]41[/C][C]0.059175[/C][C]0.4428[/C][C]0.3298[/C][/ROW]
[ROW][C]42[/C][C]0.010872[/C][C]0.0814[/C][C]0.467723[/C][/ROW]
[ROW][C]43[/C][C]-0.053462[/C][C]-0.4001[/C][C]0.345313[/C][/ROW]
[ROW][C]44[/C][C]-0.053752[/C][C]-0.4022[/C][C]0.344518[/C][/ROW]
[ROW][C]45[/C][C]0.085002[/C][C]0.6361[/C][C]0.263651[/C][/ROW]
[ROW][C]46[/C][C]-0.033718[/C][C]-0.2523[/C][C]0.400858[/C][/ROW]
[ROW][C]47[/C][C]0.065164[/C][C]0.4876[/C][C]0.313853[/C][/ROW]
[ROW][C]48[/C][C]-0.065916[/C][C]-0.4933[/C][C]0.311875[/C][/ROW]
[ROW][C]49[/C][C]0.005481[/C][C]0.041[/C][C]0.483715[/C][/ROW]
[ROW][C]50[/C][C]0.034479[/C][C]0.258[/C][C]0.398669[/C][/ROW]
[ROW][C]51[/C][C]-0.084341[/C][C]-0.6311[/C][C]0.265256[/C][/ROW]
[ROW][C]52[/C][C]-0.11858[/C][C]-0.8874[/C][C]0.189337[/C][/ROW]
[ROW][C]53[/C][C]-0.046181[/C][C]-0.3456[/C][C]0.365473[/C][/ROW]
[ROW][C]54[/C][C]0.015915[/C][C]0.1191[/C][C]0.452811[/C][/ROW]
[ROW][C]55[/C][C]0.016364[/C][C]0.1225[/C][C]0.451487[/C][/ROW]
[ROW][C]56[/C][C]NA[/C][C]NA[/C][C]NA[/C][/ROW]
[ROW][C]57[/C][C]NA[/C][C]NA[/C][C]NA[/C][/ROW]
[ROW][C]58[/C][C]NA[/C][C]NA[/C][C]NA[/C][/ROW]
[ROW][C]59[/C][C]NA[/C][C]NA[/C][C]NA[/C][/ROW]
[ROW][C]60[/C][C]NA[/C][C]NA[/C][C]NA[/C][/ROW]
[/TABLE]
Source: https://freestatistics.org/blog/index.php?pk=112287&T=2

Globally Unique Identifier (entire table): ba.freestatistics.org/blog/index.php?pk=112287&T=2

As an alternative you can also use a QR Code:  

The GUIDs for individual cells are displayed in the table below:

Partial Autocorrelation Function
Time lag kPACF(k)T-STATP-value
10.5988294.48121.9e-05
20.482053.60730.00033
30.4259763.18770.001174
4-0.272197-2.03690.023197
5-0.215462-1.61240.056252
6-0.198286-1.48380.07173
7-0.162278-1.21440.11485
80.088930.66550.254234
90.0016780.01260.495012
10-0.007714-0.05770.477085
11-0.059472-0.4450.329001
12-0.063488-0.47510.318282
130.0098320.07360.470804
140.0186820.13980.444658
150.1299050.97210.167586
16-0.140535-1.05170.148735
170.0848680.63510.263976
180.0637320.47690.317636
19-0.015587-0.11660.453781
20-0.039549-0.2960.384179
21-0.099568-0.74510.229664
22-0.26001-1.94570.028356
230.1797971.34550.091947
24-0.147713-1.10540.13686
250.0311690.23320.40821
26-0.143657-1.0750.143486
27-0.026707-0.19990.421159
280.0060380.04520.482059
290.0968670.72490.235771
300.0624070.4670.321152
31-0.146831-1.09880.138282
32-0.048467-0.36270.359099
33-0.024844-0.18590.426591
340.0723320.54130.29523
350.0194870.14580.44229
36-0.050566-0.37840.353282
37-0.011482-0.08590.465917
38-0.016918-0.12660.449855
39-0.004029-0.03020.488027
40-0.106837-0.79950.213692
410.0591750.44280.3298
420.0108720.08140.467723
43-0.053462-0.40010.345313
44-0.053752-0.40220.344518
450.0850020.63610.263651
46-0.033718-0.25230.400858
470.0651640.48760.313853
48-0.065916-0.49330.311875
490.0054810.0410.483715
500.0344790.2580.398669
51-0.084341-0.63110.265256
52-0.11858-0.88740.189337
53-0.046181-0.34560.365473
540.0159150.11910.452811
550.0163640.12250.451487
56NANANA
57NANANA
58NANANA
59NANANA
60NANANA


Parameters (Session):
par1 = 60 ; par2 = 1 ; par3 = 0 ; par4 = 1 ; par5 = 12 ; par6 = White Noise ; par7 = 0.95 ;
Parameters (R input):
par1 = 60 ; par2 = 1 ; par3 = 0 ; par4 = 1 ; par5 = 12 ; par6 = White Noise ; par7 = 0.95 ; par8 = ; par9 = ; par10 = ; par11 = ; par12 = ; par13 = ; par14 = ; par15 = ; par16 = ; par17 = ; par18 = ; par19 = ; par20 = ;
R code (references can be found in the software module):
if (par1 == 'Default') {
par1 = 10*log10(length(x))
} else {
par1 <- as.numeric(par1)
}
par2 <- as.numeric(par2)
par3 <- as.numeric(par3)
par4 <- as.numeric(par4)
par5 <- as.numeric(par5)
if (par6 == 'White Noise') par6 <- 'white' else par6 <- 'ma'
par7 <- as.numeric(par7)
if (par2 == 0) {
x <- log(x)
} else {
x <- (x ^ par2 - 1) / par2
}
if (par3 > 0) x <- diff(x,lag=1,difference=par3)
if (par4 > 0) x <- diff(x,lag=par5,difference=par4)
bitmap(file='pic1.png')
racf <- acf(x, par1, main='Autocorrelation', xlab='time lag', ylab='ACF', ci.type=par6, ci=par7, sub=paste('(lambda=',par2,', d=',par3,', D=',par4,', CI=', par7, ', CI type=',par6,')',sep=''))
dev.off()
bitmap(file='pic2.png')
rpacf <- pacf(x,par1,main='Partial Autocorrelation',xlab='lags',ylab='PACF')
dev.off()
(myacf <- c(racf$acf))
(mypacf <- c(rpacf$acf))
lengthx <- length(x)
sqrtn <- sqrt(lengthx)
load(file='createtable')
a<-table.start()
a<-table.row.start(a)
a<-table.element(a,'Autocorrelation Function',4,TRUE)
a<-table.row.end(a)
a<-table.row.start(a)
a<-table.element(a,'Time lag k',header=TRUE)
a<-table.element(a,hyperlink('basics.htm','ACF(k)','click here for more information about the Autocorrelation Function'),header=TRUE)
a<-table.element(a,'T-STAT',header=TRUE)
a<-table.element(a,'P-value',header=TRUE)
a<-table.row.end(a)
for (i in 2:(par1+1)) {
a<-table.row.start(a)
a<-table.element(a,i-1,header=TRUE)
a<-table.element(a,round(myacf[i],6))
mytstat <- myacf[i]*sqrtn
a<-table.element(a,round(mytstat,4))
a<-table.element(a,round(1-pt(abs(mytstat),lengthx),6))
a<-table.row.end(a)
}
a<-table.end(a)
table.save(a,file='mytable.tab')
a<-table.start()
a<-table.row.start(a)
a<-table.element(a,'Partial Autocorrelation Function',4,TRUE)
a<-table.row.end(a)
a<-table.row.start(a)
a<-table.element(a,'Time lag k',header=TRUE)
a<-table.element(a,hyperlink('basics.htm','PACF(k)','click here for more information about the Partial Autocorrelation Function'),header=TRUE)
a<-table.element(a,'T-STAT',header=TRUE)
a<-table.element(a,'P-value',header=TRUE)
a<-table.row.end(a)
for (i in 1:par1) {
a<-table.row.start(a)
a<-table.element(a,i,header=TRUE)
a<-table.element(a,round(mypacf[i],6))
mytstat <- mypacf[i]*sqrtn
a<-table.element(a,round(mytstat,4))
a<-table.element(a,round(1-pt(abs(mytstat),lengthx),6))
a<-table.row.end(a)
}
a<-table.end(a)
table.save(a,file='mytable1.tab')