Free Statistics

of Irreproducible Research!

Author's title

Author*The author of this computation has been verified*
R Software Modulerwasp_arimabackwardselection.wasp
Title produced by softwareARIMA Backward Selection
Date of computationSun, 19 Dec 2010 10:50:40 +0000
Cite this page as followsStatistical Computations at FreeStatistics.org, Office for Research Development and Education, URL https://freestatistics.org/blog/index.php?v=date/2010/Dec/19/t12927560252hnj08tebrxu94v.htm/, Retrieved Sun, 05 May 2024 03:39:52 +0000
Statistical Computations at FreeStatistics.org, Office for Research Development and Education, URL https://freestatistics.org/blog/index.php?pk=112274, Retrieved Sun, 05 May 2024 03:39:52 +0000
QR Codes:

Original text written by user:
IsPrivate?No (this computation is public)
User-defined keywords
Estimated Impact127
Family? (F = Feedback message, R = changed R code, M = changed R Module, P = changed Parameters, D = changed Data)
-     [Classical Decomposition] [HPC Retail Sales] [2008-03-02 16:19:32] [74be16979710d4c4e7c6647856088456]
- RMPD    [ARIMA Backward Selection] [AR MA huwelijken] [2010-12-19 10:50:40] [3f56c8f677e988de577e4e00a8180a48] [Current]
Feedback Forum

Post a new message
Dataseries X:
3111
3995
5245
5588
10681
10516
7496
9935
10249
6271
3616
3724
2886
3318
4166
6401
9209
9820
7470
8207
9564
5309
3385
3706
2733
3045
3449
5542
10072
9418
7516
7840
10081
4956
3641
3970
2931
3170
3889
4850
8037
12370
6712
7297
10613
5184
3506
3810
2692
3073
3713
4555
7807
10869
9682
7704
9826
5456
3677
3431
2765
3483
3445
6081
8767
9407
6551
12480
9530
5960
3252
3717
2642
2989
3607
5366
8898
9435
7328
8594
11349
5797
3621
3851


Summary of computational transaction
Raw Inputview raw input (R code)
Raw Outputview raw output of R engine
Computing time13 seconds
R Server'Sir Ronald Aylmer Fisher' @ 193.190.124.24

\begin{tabular}{lllllllll}
\hline
Summary of computational transaction \tabularnewline
Raw Input & view raw input (R code)  \tabularnewline
Raw Output & view raw output of R engine  \tabularnewline
Computing time & 13 seconds \tabularnewline
R Server & 'Sir Ronald Aylmer Fisher' @ 193.190.124.24 \tabularnewline
\hline
\end{tabular}
%Source: https://freestatistics.org/blog/index.php?pk=112274&T=0

[TABLE]
[ROW][C]Summary of computational transaction[/C][/ROW]
[ROW][C]Raw Input[/C][C]view raw input (R code) [/C][/ROW]
[ROW][C]Raw Output[/C][C]view raw output of R engine [/C][/ROW]
[ROW][C]Computing time[/C][C]13 seconds[/C][/ROW]
[ROW][C]R Server[/C][C]'Sir Ronald Aylmer Fisher' @ 193.190.124.24[/C][/ROW]
[/TABLE]
Source: https://freestatistics.org/blog/index.php?pk=112274&T=0

Globally Unique Identifier (entire table): ba.freestatistics.org/blog/index.php?pk=112274&T=0

As an alternative you can also use a QR Code:  

The GUIDs for individual cells are displayed in the table below:

Summary of computational transaction
Raw Inputview raw input (R code)
Raw Outputview raw output of R engine
Computing time13 seconds
R Server'Sir Ronald Aylmer Fisher' @ 193.190.124.24


ARIMA Parameter Estimation and Backward Selection
Iterationar1ar2ar3ma1sar1sar2sma1
Estimates ( 1 )-0.3998-0.2682-0.1206-0.83130.2135-0.0717-0.9999
(p-val)(0.0137 )(0.0926 )(0.3605 )(0 )(0.2017 )(0.7007 )(0.0145 )
Estimates ( 2 )-0.3937-0.2865-0.1234-0.83290.22670-1
(p-val)(0.0129 )(0.0524 )(0.3463 )(0 )(0.167 )(NA )(0.0022 )
Estimates ( 3 )-0.3311-0.21690-0.86460.20290-1
(p-val)(0.0194 )(0.0828 )(NA )(0 )(0.1983 )(NA )(9e-04 )
Estimates ( 4 )-0.2753-0.21510-1.155600-0.7726
(p-val)(0.0483 )(0.0945 )(NA )(0 )(NA )(NA )(0.0029 )
Estimates ( 5 )-0.181200-1.108500-0.9975
(p-val)(0.141 )(NA )(NA )(0 )(NA )(NA )(0.1704 )
Estimates ( 6 )-0.348100-0.9447000
(p-val)(0.0028 )(NA )(NA )(0 )(NA )(NA )(NA )
Estimates ( 7 )NANANANANANANA
(p-val)(NA )(NA )(NA )(NA )(NA )(NA )(NA )
Estimates ( 8 )NANANANANANANA
(p-val)(NA )(NA )(NA )(NA )(NA )(NA )(NA )
Estimates ( 9 )NANANANANANANA
(p-val)(NA )(NA )(NA )(NA )(NA )(NA )(NA )
Estimates ( 10 )NANANANANANANA
(p-val)(NA )(NA )(NA )(NA )(NA )(NA )(NA )
Estimates ( 11 )NANANANANANANA
(p-val)(NA )(NA )(NA )(NA )(NA )(NA )(NA )
Estimates ( 12 )NANANANANANANA
(p-val)(NA )(NA )(NA )(NA )(NA )(NA )(NA )
Estimates ( 13 )NANANANANANANA
(p-val)(NA )(NA )(NA )(NA )(NA )(NA )(NA )

\begin{tabular}{lllllllll}
\hline
ARIMA Parameter Estimation and Backward Selection \tabularnewline
Iteration & ar1 & ar2 & ar3 & ma1 & sar1 & sar2 & sma1 \tabularnewline
Estimates ( 1 ) & -0.3998 & -0.2682 & -0.1206 & -0.8313 & 0.2135 & -0.0717 & -0.9999 \tabularnewline
(p-val) & (0.0137 ) & (0.0926 ) & (0.3605 ) & (0 ) & (0.2017 ) & (0.7007 ) & (0.0145 ) \tabularnewline
Estimates ( 2 ) & -0.3937 & -0.2865 & -0.1234 & -0.8329 & 0.2267 & 0 & -1 \tabularnewline
(p-val) & (0.0129 ) & (0.0524 ) & (0.3463 ) & (0 ) & (0.167 ) & (NA ) & (0.0022 ) \tabularnewline
Estimates ( 3 ) & -0.3311 & -0.2169 & 0 & -0.8646 & 0.2029 & 0 & -1 \tabularnewline
(p-val) & (0.0194 ) & (0.0828 ) & (NA ) & (0 ) & (0.1983 ) & (NA ) & (9e-04 ) \tabularnewline
Estimates ( 4 ) & -0.2753 & -0.2151 & 0 & -1.1556 & 0 & 0 & -0.7726 \tabularnewline
(p-val) & (0.0483 ) & (0.0945 ) & (NA ) & (0 ) & (NA ) & (NA ) & (0.0029 ) \tabularnewline
Estimates ( 5 ) & -0.1812 & 0 & 0 & -1.1085 & 0 & 0 & -0.9975 \tabularnewline
(p-val) & (0.141 ) & (NA ) & (NA ) & (0 ) & (NA ) & (NA ) & (0.1704 ) \tabularnewline
Estimates ( 6 ) & -0.3481 & 0 & 0 & -0.9447 & 0 & 0 & 0 \tabularnewline
(p-val) & (0.0028 ) & (NA ) & (NA ) & (0 ) & (NA ) & (NA ) & (NA ) \tabularnewline
Estimates ( 7 ) & NA & NA & NA & NA & NA & NA & NA \tabularnewline
(p-val) & (NA ) & (NA ) & (NA ) & (NA ) & (NA ) & (NA ) & (NA ) \tabularnewline
Estimates ( 8 ) & NA & NA & NA & NA & NA & NA & NA \tabularnewline
(p-val) & (NA ) & (NA ) & (NA ) & (NA ) & (NA ) & (NA ) & (NA ) \tabularnewline
Estimates ( 9 ) & NA & NA & NA & NA & NA & NA & NA \tabularnewline
(p-val) & (NA ) & (NA ) & (NA ) & (NA ) & (NA ) & (NA ) & (NA ) \tabularnewline
Estimates ( 10 ) & NA & NA & NA & NA & NA & NA & NA \tabularnewline
(p-val) & (NA ) & (NA ) & (NA ) & (NA ) & (NA ) & (NA ) & (NA ) \tabularnewline
Estimates ( 11 ) & NA & NA & NA & NA & NA & NA & NA \tabularnewline
(p-val) & (NA ) & (NA ) & (NA ) & (NA ) & (NA ) & (NA ) & (NA ) \tabularnewline
Estimates ( 12 ) & NA & NA & NA & NA & NA & NA & NA \tabularnewline
(p-val) & (NA ) & (NA ) & (NA ) & (NA ) & (NA ) & (NA ) & (NA ) \tabularnewline
Estimates ( 13 ) & NA & NA & NA & NA & NA & NA & NA \tabularnewline
(p-val) & (NA ) & (NA ) & (NA ) & (NA ) & (NA ) & (NA ) & (NA ) \tabularnewline
\hline
\end{tabular}
%Source: https://freestatistics.org/blog/index.php?pk=112274&T=1

[TABLE]
[ROW][C]ARIMA Parameter Estimation and Backward Selection[/C][/ROW]
[ROW][C]Iteration[/C][C]ar1[/C][C]ar2[/C][C]ar3[/C][C]ma1[/C][C]sar1[/C][C]sar2[/C][C]sma1[/C][/ROW]
[ROW][C]Estimates ( 1 )[/C][C]-0.3998[/C][C]-0.2682[/C][C]-0.1206[/C][C]-0.8313[/C][C]0.2135[/C][C]-0.0717[/C][C]-0.9999[/C][/ROW]
[ROW][C](p-val)[/C][C](0.0137 )[/C][C](0.0926 )[/C][C](0.3605 )[/C][C](0 )[/C][C](0.2017 )[/C][C](0.7007 )[/C][C](0.0145 )[/C][/ROW]
[ROW][C]Estimates ( 2 )[/C][C]-0.3937[/C][C]-0.2865[/C][C]-0.1234[/C][C]-0.8329[/C][C]0.2267[/C][C]0[/C][C]-1[/C][/ROW]
[ROW][C](p-val)[/C][C](0.0129 )[/C][C](0.0524 )[/C][C](0.3463 )[/C][C](0 )[/C][C](0.167 )[/C][C](NA )[/C][C](0.0022 )[/C][/ROW]
[ROW][C]Estimates ( 3 )[/C][C]-0.3311[/C][C]-0.2169[/C][C]0[/C][C]-0.8646[/C][C]0.2029[/C][C]0[/C][C]-1[/C][/ROW]
[ROW][C](p-val)[/C][C](0.0194 )[/C][C](0.0828 )[/C][C](NA )[/C][C](0 )[/C][C](0.1983 )[/C][C](NA )[/C][C](9e-04 )[/C][/ROW]
[ROW][C]Estimates ( 4 )[/C][C]-0.2753[/C][C]-0.2151[/C][C]0[/C][C]-1.1556[/C][C]0[/C][C]0[/C][C]-0.7726[/C][/ROW]
[ROW][C](p-val)[/C][C](0.0483 )[/C][C](0.0945 )[/C][C](NA )[/C][C](0 )[/C][C](NA )[/C][C](NA )[/C][C](0.0029 )[/C][/ROW]
[ROW][C]Estimates ( 5 )[/C][C]-0.1812[/C][C]0[/C][C]0[/C][C]-1.1085[/C][C]0[/C][C]0[/C][C]-0.9975[/C][/ROW]
[ROW][C](p-val)[/C][C](0.141 )[/C][C](NA )[/C][C](NA )[/C][C](0 )[/C][C](NA )[/C][C](NA )[/C][C](0.1704 )[/C][/ROW]
[ROW][C]Estimates ( 6 )[/C][C]-0.3481[/C][C]0[/C][C]0[/C][C]-0.9447[/C][C]0[/C][C]0[/C][C]0[/C][/ROW]
[ROW][C](p-val)[/C][C](0.0028 )[/C][C](NA )[/C][C](NA )[/C][C](0 )[/C][C](NA )[/C][C](NA )[/C][C](NA )[/C][/ROW]
[ROW][C]Estimates ( 7 )[/C][C]NA[/C][C]NA[/C][C]NA[/C][C]NA[/C][C]NA[/C][C]NA[/C][C]NA[/C][/ROW]
[ROW][C](p-val)[/C][C](NA )[/C][C](NA )[/C][C](NA )[/C][C](NA )[/C][C](NA )[/C][C](NA )[/C][C](NA )[/C][/ROW]
[ROW][C]Estimates ( 8 )[/C][C]NA[/C][C]NA[/C][C]NA[/C][C]NA[/C][C]NA[/C][C]NA[/C][C]NA[/C][/ROW]
[ROW][C](p-val)[/C][C](NA )[/C][C](NA )[/C][C](NA )[/C][C](NA )[/C][C](NA )[/C][C](NA )[/C][C](NA )[/C][/ROW]
[ROW][C]Estimates ( 9 )[/C][C]NA[/C][C]NA[/C][C]NA[/C][C]NA[/C][C]NA[/C][C]NA[/C][C]NA[/C][/ROW]
[ROW][C](p-val)[/C][C](NA )[/C][C](NA )[/C][C](NA )[/C][C](NA )[/C][C](NA )[/C][C](NA )[/C][C](NA )[/C][/ROW]
[ROW][C]Estimates ( 10 )[/C][C]NA[/C][C]NA[/C][C]NA[/C][C]NA[/C][C]NA[/C][C]NA[/C][C]NA[/C][/ROW]
[ROW][C](p-val)[/C][C](NA )[/C][C](NA )[/C][C](NA )[/C][C](NA )[/C][C](NA )[/C][C](NA )[/C][C](NA )[/C][/ROW]
[ROW][C]Estimates ( 11 )[/C][C]NA[/C][C]NA[/C][C]NA[/C][C]NA[/C][C]NA[/C][C]NA[/C][C]NA[/C][/ROW]
[ROW][C](p-val)[/C][C](NA )[/C][C](NA )[/C][C](NA )[/C][C](NA )[/C][C](NA )[/C][C](NA )[/C][C](NA )[/C][/ROW]
[ROW][C]Estimates ( 12 )[/C][C]NA[/C][C]NA[/C][C]NA[/C][C]NA[/C][C]NA[/C][C]NA[/C][C]NA[/C][/ROW]
[ROW][C](p-val)[/C][C](NA )[/C][C](NA )[/C][C](NA )[/C][C](NA )[/C][C](NA )[/C][C](NA )[/C][C](NA )[/C][/ROW]
[ROW][C]Estimates ( 13 )[/C][C]NA[/C][C]NA[/C][C]NA[/C][C]NA[/C][C]NA[/C][C]NA[/C][C]NA[/C][/ROW]
[ROW][C](p-val)[/C][C](NA )[/C][C](NA )[/C][C](NA )[/C][C](NA )[/C][C](NA )[/C][C](NA )[/C][C](NA )[/C][/ROW]
[/TABLE]
Source: https://freestatistics.org/blog/index.php?pk=112274&T=1

Globally Unique Identifier (entire table): ba.freestatistics.org/blog/index.php?pk=112274&T=1

As an alternative you can also use a QR Code:  

The GUIDs for individual cells are displayed in the table below:

ARIMA Parameter Estimation and Backward Selection
Iterationar1ar2ar3ma1sar1sar2sma1
Estimates ( 1 )-0.3998-0.2682-0.1206-0.83130.2135-0.0717-0.9999
(p-val)(0.0137 )(0.0926 )(0.3605 )(0 )(0.2017 )(0.7007 )(0.0145 )
Estimates ( 2 )-0.3937-0.2865-0.1234-0.83290.22670-1
(p-val)(0.0129 )(0.0524 )(0.3463 )(0 )(0.167 )(NA )(0.0022 )
Estimates ( 3 )-0.3311-0.21690-0.86460.20290-1
(p-val)(0.0194 )(0.0828 )(NA )(0 )(0.1983 )(NA )(9e-04 )
Estimates ( 4 )-0.2753-0.21510-1.155600-0.7726
(p-val)(0.0483 )(0.0945 )(NA )(0 )(NA )(NA )(0.0029 )
Estimates ( 5 )-0.181200-1.108500-0.9975
(p-val)(0.141 )(NA )(NA )(0 )(NA )(NA )(0.1704 )
Estimates ( 6 )-0.348100-0.9447000
(p-val)(0.0028 )(NA )(NA )(0 )(NA )(NA )(NA )
Estimates ( 7 )NANANANANANANA
(p-val)(NA )(NA )(NA )(NA )(NA )(NA )(NA )
Estimates ( 8 )NANANANANANANA
(p-val)(NA )(NA )(NA )(NA )(NA )(NA )(NA )
Estimates ( 9 )NANANANANANANA
(p-val)(NA )(NA )(NA )(NA )(NA )(NA )(NA )
Estimates ( 10 )NANANANANANANA
(p-val)(NA )(NA )(NA )(NA )(NA )(NA )(NA )
Estimates ( 11 )NANANANANANANA
(p-val)(NA )(NA )(NA )(NA )(NA )(NA )(NA )
Estimates ( 12 )NANANANANANANA
(p-val)(NA )(NA )(NA )(NA )(NA )(NA )(NA )
Estimates ( 13 )NANANANANANANA
(p-val)(NA )(NA )(NA )(NA )(NA )(NA )(NA )


Estimated ARIMA Residuals
Value
-22.8682780790984
-194.162646444220
-354.909660003803
800.77851833299
-551.35171911475
-217.793839333871
318.564659326081
-711.528714164104
-149.718812107888
-185.666423308302
271.271895327695
433.559020262169
477.959370104864
160.511985164604
-368.774760576308
182.471994115529
676.144902796924
24.4469644584129
474.341662839196
-401.376703857687
505.15877563312
-104.548222337364
490.152833213104
636.918894145997
575.74122814786
266.454617047441
99.444046071222
-388.524156176522
-1163.68293848266
2249.17022778118
102.667548091755
-816.299252955025
755.911729775306
198.661470109549
265.763551128631
307.138458303894
219.361887611484
114.861381667927
-43.3408932662295
-515.787121621791
-1064.18441796890
588.372705341206
2466.88952115096
91.653847017021
-101.740576817716
217.783551695921
336.805118090844
-101.576378029384
145.515937084008
404.522841761899
-264.252425512562
744.1594567677
-28.8136792075411
-843.079526965256
-901.518110833116
3717.21535492375
193.912693455414
329.201752039766
-234.584309410653
-92.4072339049361
-134.536567037993
-259.947133306788
-270.416087180153
-44.3903539923082
-54.01260735164
-698.024714474723
-140.637260522021
-78.5236583749116
1328.47272722394
534.286477427366
176.870244961637
144.117547275019

\begin{tabular}{lllllllll}
\hline
Estimated ARIMA Residuals \tabularnewline
Value \tabularnewline
-22.8682780790984 \tabularnewline
-194.162646444220 \tabularnewline
-354.909660003803 \tabularnewline
800.77851833299 \tabularnewline
-551.35171911475 \tabularnewline
-217.793839333871 \tabularnewline
318.564659326081 \tabularnewline
-711.528714164104 \tabularnewline
-149.718812107888 \tabularnewline
-185.666423308302 \tabularnewline
271.271895327695 \tabularnewline
433.559020262169 \tabularnewline
477.959370104864 \tabularnewline
160.511985164604 \tabularnewline
-368.774760576308 \tabularnewline
182.471994115529 \tabularnewline
676.144902796924 \tabularnewline
24.4469644584129 \tabularnewline
474.341662839196 \tabularnewline
-401.376703857687 \tabularnewline
505.15877563312 \tabularnewline
-104.548222337364 \tabularnewline
490.152833213104 \tabularnewline
636.918894145997 \tabularnewline
575.74122814786 \tabularnewline
266.454617047441 \tabularnewline
99.444046071222 \tabularnewline
-388.524156176522 \tabularnewline
-1163.68293848266 \tabularnewline
2249.17022778118 \tabularnewline
102.667548091755 \tabularnewline
-816.299252955025 \tabularnewline
755.911729775306 \tabularnewline
198.661470109549 \tabularnewline
265.763551128631 \tabularnewline
307.138458303894 \tabularnewline
219.361887611484 \tabularnewline
114.861381667927 \tabularnewline
-43.3408932662295 \tabularnewline
-515.787121621791 \tabularnewline
-1064.18441796890 \tabularnewline
588.372705341206 \tabularnewline
2466.88952115096 \tabularnewline
91.653847017021 \tabularnewline
-101.740576817716 \tabularnewline
217.783551695921 \tabularnewline
336.805118090844 \tabularnewline
-101.576378029384 \tabularnewline
145.515937084008 \tabularnewline
404.522841761899 \tabularnewline
-264.252425512562 \tabularnewline
744.1594567677 \tabularnewline
-28.8136792075411 \tabularnewline
-843.079526965256 \tabularnewline
-901.518110833116 \tabularnewline
3717.21535492375 \tabularnewline
193.912693455414 \tabularnewline
329.201752039766 \tabularnewline
-234.584309410653 \tabularnewline
-92.4072339049361 \tabularnewline
-134.536567037993 \tabularnewline
-259.947133306788 \tabularnewline
-270.416087180153 \tabularnewline
-44.3903539923082 \tabularnewline
-54.01260735164 \tabularnewline
-698.024714474723 \tabularnewline
-140.637260522021 \tabularnewline
-78.5236583749116 \tabularnewline
1328.47272722394 \tabularnewline
534.286477427366 \tabularnewline
176.870244961637 \tabularnewline
144.117547275019 \tabularnewline
\hline
\end{tabular}
%Source: https://freestatistics.org/blog/index.php?pk=112274&T=2

[TABLE]
[ROW][C]Estimated ARIMA Residuals[/C][/ROW]
[ROW][C]Value[/C][/ROW]
[ROW][C]-22.8682780790984[/C][/ROW]
[ROW][C]-194.162646444220[/C][/ROW]
[ROW][C]-354.909660003803[/C][/ROW]
[ROW][C]800.77851833299[/C][/ROW]
[ROW][C]-551.35171911475[/C][/ROW]
[ROW][C]-217.793839333871[/C][/ROW]
[ROW][C]318.564659326081[/C][/ROW]
[ROW][C]-711.528714164104[/C][/ROW]
[ROW][C]-149.718812107888[/C][/ROW]
[ROW][C]-185.666423308302[/C][/ROW]
[ROW][C]271.271895327695[/C][/ROW]
[ROW][C]433.559020262169[/C][/ROW]
[ROW][C]477.959370104864[/C][/ROW]
[ROW][C]160.511985164604[/C][/ROW]
[ROW][C]-368.774760576308[/C][/ROW]
[ROW][C]182.471994115529[/C][/ROW]
[ROW][C]676.144902796924[/C][/ROW]
[ROW][C]24.4469644584129[/C][/ROW]
[ROW][C]474.341662839196[/C][/ROW]
[ROW][C]-401.376703857687[/C][/ROW]
[ROW][C]505.15877563312[/C][/ROW]
[ROW][C]-104.548222337364[/C][/ROW]
[ROW][C]490.152833213104[/C][/ROW]
[ROW][C]636.918894145997[/C][/ROW]
[ROW][C]575.74122814786[/C][/ROW]
[ROW][C]266.454617047441[/C][/ROW]
[ROW][C]99.444046071222[/C][/ROW]
[ROW][C]-388.524156176522[/C][/ROW]
[ROW][C]-1163.68293848266[/C][/ROW]
[ROW][C]2249.17022778118[/C][/ROW]
[ROW][C]102.667548091755[/C][/ROW]
[ROW][C]-816.299252955025[/C][/ROW]
[ROW][C]755.911729775306[/C][/ROW]
[ROW][C]198.661470109549[/C][/ROW]
[ROW][C]265.763551128631[/C][/ROW]
[ROW][C]307.138458303894[/C][/ROW]
[ROW][C]219.361887611484[/C][/ROW]
[ROW][C]114.861381667927[/C][/ROW]
[ROW][C]-43.3408932662295[/C][/ROW]
[ROW][C]-515.787121621791[/C][/ROW]
[ROW][C]-1064.18441796890[/C][/ROW]
[ROW][C]588.372705341206[/C][/ROW]
[ROW][C]2466.88952115096[/C][/ROW]
[ROW][C]91.653847017021[/C][/ROW]
[ROW][C]-101.740576817716[/C][/ROW]
[ROW][C]217.783551695921[/C][/ROW]
[ROW][C]336.805118090844[/C][/ROW]
[ROW][C]-101.576378029384[/C][/ROW]
[ROW][C]145.515937084008[/C][/ROW]
[ROW][C]404.522841761899[/C][/ROW]
[ROW][C]-264.252425512562[/C][/ROW]
[ROW][C]744.1594567677[/C][/ROW]
[ROW][C]-28.8136792075411[/C][/ROW]
[ROW][C]-843.079526965256[/C][/ROW]
[ROW][C]-901.518110833116[/C][/ROW]
[ROW][C]3717.21535492375[/C][/ROW]
[ROW][C]193.912693455414[/C][/ROW]
[ROW][C]329.201752039766[/C][/ROW]
[ROW][C]-234.584309410653[/C][/ROW]
[ROW][C]-92.4072339049361[/C][/ROW]
[ROW][C]-134.536567037993[/C][/ROW]
[ROW][C]-259.947133306788[/C][/ROW]
[ROW][C]-270.416087180153[/C][/ROW]
[ROW][C]-44.3903539923082[/C][/ROW]
[ROW][C]-54.01260735164[/C][/ROW]
[ROW][C]-698.024714474723[/C][/ROW]
[ROW][C]-140.637260522021[/C][/ROW]
[ROW][C]-78.5236583749116[/C][/ROW]
[ROW][C]1328.47272722394[/C][/ROW]
[ROW][C]534.286477427366[/C][/ROW]
[ROW][C]176.870244961637[/C][/ROW]
[ROW][C]144.117547275019[/C][/ROW]
[/TABLE]
Source: https://freestatistics.org/blog/index.php?pk=112274&T=2

Globally Unique Identifier (entire table): ba.freestatistics.org/blog/index.php?pk=112274&T=2

As an alternative you can also use a QR Code:  

The GUIDs for individual cells are displayed in the table below:

Estimated ARIMA Residuals
Value
-22.8682780790984
-194.162646444220
-354.909660003803
800.77851833299
-551.35171911475
-217.793839333871
318.564659326081
-711.528714164104
-149.718812107888
-185.666423308302
271.271895327695
433.559020262169
477.959370104864
160.511985164604
-368.774760576308
182.471994115529
676.144902796924
24.4469644584129
474.341662839196
-401.376703857687
505.15877563312
-104.548222337364
490.152833213104
636.918894145997
575.74122814786
266.454617047441
99.444046071222
-388.524156176522
-1163.68293848266
2249.17022778118
102.667548091755
-816.299252955025
755.911729775306
198.661470109549
265.763551128631
307.138458303894
219.361887611484
114.861381667927
-43.3408932662295
-515.787121621791
-1064.18441796890
588.372705341206
2466.88952115096
91.653847017021
-101.740576817716
217.783551695921
336.805118090844
-101.576378029384
145.515937084008
404.522841761899
-264.252425512562
744.1594567677
-28.8136792075411
-843.079526965256
-901.518110833116
3717.21535492375
193.912693455414
329.201752039766
-234.584309410653
-92.4072339049361
-134.536567037993
-259.947133306788
-270.416087180153
-44.3903539923082
-54.01260735164
-698.024714474723
-140.637260522021
-78.5236583749116
1328.47272722394
534.286477427366
176.870244961637
144.117547275019


Parameters (Session):
par1 = 48 ; par2 = 1 ; par3 = 0 ; par4 = 0 ; par5 = 12 ; par6 = White Noise ; par7 = 0.95 ;
Parameters (R input):
par1 = FALSE ; par2 = 1 ; par3 = 1 ; par4 = 1 ; par5 = 12 ; par6 = 3 ; par7 = 1 ; par8 = 2 ; par9 = 1 ;
R code (references can be found in the software module):
library(lattice)
if (par1 == 'TRUE') par1 <- TRUE
if (par1 == 'FALSE') par1 <- FALSE
par2 <- as.numeric(par2) #Box-Cox lambda transformation parameter
par3 <- as.numeric(par3) #degree of non-seasonal differencing
par4 <- as.numeric(par4) #degree of seasonal differencing
par5 <- as.numeric(par5) #seasonal period
par6 <- as.numeric(par6) #degree (p) of the non-seasonal AR(p) polynomial
par7 <- as.numeric(par7) #degree (q) of the non-seasonal MA(q) polynomial
par8 <- as.numeric(par8) #degree (P) of the seasonal AR(P) polynomial
par9 <- as.numeric(par9) #degree (Q) of the seasonal MA(Q) polynomial
armaGR <- function(arima.out, names, n){
try1 <- arima.out$coef
try2 <- sqrt(diag(arima.out$var.coef))
try.data.frame <- data.frame(matrix(NA,ncol=4,nrow=length(names)))
dimnames(try.data.frame) <- list(names,c('coef','std','tstat','pv'))
try.data.frame[,1] <- try1
for(i in 1:length(try2)) try.data.frame[which(rownames(try.data.frame)==names(try2)[i]),2] <- try2[i]
try.data.frame[,3] <- try.data.frame[,1] / try.data.frame[,2]
try.data.frame[,4] <- round((1-pt(abs(try.data.frame[,3]),df=n-(length(try2)+1)))*2,5)
vector <- rep(NA,length(names))
vector[is.na(try.data.frame[,4])] <- 0
maxi <- which.max(try.data.frame[,4])
continue <- max(try.data.frame[,4],na.rm=TRUE) > .05
vector[maxi] <- 0
list(summary=try.data.frame,next.vector=vector,continue=continue)
}
arimaSelect <- function(series, order=c(13,0,0), seasonal=list(order=c(2,0,0),period=12), include.mean=F){
nrc <- order[1]+order[3]+seasonal$order[1]+seasonal$order[3]
coeff <- matrix(NA, nrow=nrc*2, ncol=nrc)
pval <- matrix(NA, nrow=nrc*2, ncol=nrc)
mylist <- rep(list(NULL), nrc)
names <- NULL
if(order[1] > 0) names <- paste('ar',1:order[1],sep='')
if(order[3] > 0) names <- c( names , paste('ma',1:order[3],sep='') )
if(seasonal$order[1] > 0) names <- c(names, paste('sar',1:seasonal$order[1],sep=''))
if(seasonal$order[3] > 0) names <- c(names, paste('sma',1:seasonal$order[3],sep=''))
arima.out <- arima(series, order=order, seasonal=seasonal, include.mean=include.mean, method='ML')
mylist[[1]] <- arima.out
last.arma <- armaGR(arima.out, names, length(series))
mystop <- FALSE
i <- 1
coeff[i,] <- last.arma[[1]][,1]
pval [i,] <- last.arma[[1]][,4]
i <- 2
aic <- arima.out$aic
while(!mystop){
mylist[[i]] <- arima.out
arima.out <- arima(series, order=order, seasonal=seasonal, include.mean=include.mean, method='ML', fixed=last.arma$next.vector)
aic <- c(aic, arima.out$aic)
last.arma <- armaGR(arima.out, names, length(series))
mystop <- !last.arma$continue
coeff[i,] <- last.arma[[1]][,1]
pval [i,] <- last.arma[[1]][,4]
i <- i+1
}
list(coeff, pval, mylist, aic=aic)
}
arimaSelectplot <- function(arimaSelect.out,noms,choix){
noms <- names(arimaSelect.out[[3]][[1]]$coef)
coeff <- arimaSelect.out[[1]]
k <- min(which(is.na(coeff[,1])))-1
coeff <- coeff[1:k,]
pval <- arimaSelect.out[[2]][1:k,]
aic <- arimaSelect.out$aic[1:k]
coeff[coeff==0] <- NA
n <- ncol(coeff)
if(missing(choix)) choix <- k
layout(matrix(c(1,1,1,2,
3,3,3,2,
3,3,3,4,
5,6,7,7),nr=4),
widths=c(10,35,45,15),
heights=c(30,30,15,15))
couleurs <- rainbow(75)[1:50]#(50)
ticks <- pretty(coeff)
par(mar=c(1,1,3,1))
plot(aic,k:1-.5,type='o',pch=21,bg='blue',cex=2,axes=F,lty=2,xpd=NA)
points(aic[choix],k-choix+.5,pch=21,cex=4,bg=2,xpd=NA)
title('aic',line=2)
par(mar=c(3,0,0,0))
plot(0,axes=F,xlab='',ylab='',xlim=range(ticks),ylim=c(.1,1))
rect(xleft = min(ticks) + (0:49)/50*(max(ticks)-min(ticks)),
xright = min(ticks) + (1:50)/50*(max(ticks)-min(ticks)),
ytop = rep(1,50),
ybottom= rep(0,50),col=couleurs,border=NA)
axis(1,ticks)
rect(xleft=min(ticks),xright=max(ticks),ytop=1,ybottom=0)
text(mean(coeff,na.rm=T),.5,'coefficients',cex=2,font=2)
par(mar=c(1,1,3,1))
image(1:n,1:k,t(coeff[k:1,]),axes=F,col=couleurs,zlim=range(ticks))
for(i in 1:n) for(j in 1:k) if(!is.na(coeff[j,i])) {
if(pval[j,i]<.01) symb = 'green'
else if( (pval[j,i]<.05) & (pval[j,i]>=.01)) symb = 'orange'
else if( (pval[j,i]<.1) & (pval[j,i]>=.05)) symb = 'red'
else symb = 'black'
polygon(c(i+.5 ,i+.2 ,i+.5 ,i+.5),
c(k-j+0.5,k-j+0.5,k-j+0.8,k-j+0.5),
col=symb)
if(j==choix) {
rect(xleft=i-.5,
xright=i+.5,
ybottom=k-j+1.5,
ytop=k-j+.5,
lwd=4)
text(i,
k-j+1,
round(coeff[j,i],2),
cex=1.2,
font=2)
}
else{
rect(xleft=i-.5,xright=i+.5,ybottom=k-j+1.5,ytop=k-j+.5)
text(i,k-j+1,round(coeff[j,i],2),cex=1.2,font=1)
}
}
axis(3,1:n,noms)
par(mar=c(0.5,0,0,0.5))
plot(0,axes=F,xlab='',ylab='',type='n',xlim=c(0,8),ylim=c(-.2,.8))
cols <- c('green','orange','red','black')
niv <- c('0','0.01','0.05','0.1')
for(i in 0:3){
polygon(c(1+2*i ,1+2*i ,1+2*i-.5 ,1+2*i),
c(.4 ,.7 , .4 , .4),
col=cols[i+1])
text(2*i,0.5,niv[i+1],cex=1.5)
}
text(8,.5,1,cex=1.5)
text(4,0,'p-value',cex=2)
box()
residus <- arimaSelect.out[[3]][[choix]]$res
par(mar=c(1,2,4,1))
acf(residus,main='')
title('acf',line=.5)
par(mar=c(1,2,4,1))
pacf(residus,main='')
title('pacf',line=.5)
par(mar=c(2,2,4,1))
qqnorm(residus,main='')
title('qq-norm',line=.5)
qqline(residus)
residus
}
if (par2 == 0) x <- log(x)
if (par2 != 0) x <- x^par2
(selection <- arimaSelect(x, order=c(par6,par3,par7), seasonal=list(order=c(par8,par4,par9), period=par5)))
bitmap(file='test1.png')
resid <- arimaSelectplot(selection)
dev.off()
resid
bitmap(file='test2.png')
acf(resid,length(resid)/2, main='Residual Autocorrelation Function')
dev.off()
bitmap(file='test3.png')
pacf(resid,length(resid)/2, main='Residual Partial Autocorrelation Function')
dev.off()
bitmap(file='test4.png')
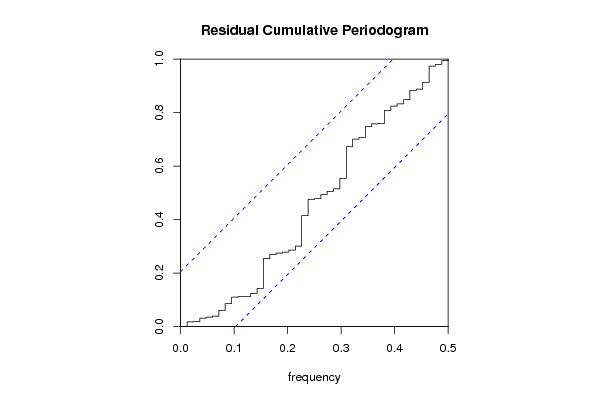
cpgram(resid, main='Residual Cumulative Periodogram')
dev.off()
bitmap(file='test5.png')
hist(resid, main='Residual Histogram', xlab='values of Residuals')
dev.off()
bitmap(file='test6.png')
densityplot(~resid,col='black',main='Residual Density Plot', xlab='values of Residuals')
dev.off()
bitmap(file='test7.png')
qqnorm(resid, main='Residual Normal Q-Q Plot')
qqline(resid)
dev.off()
ncols <- length(selection[[1]][1,])
nrows <- length(selection[[2]][,1])-1
load(file='createtable')
a<-table.start()
a<-table.row.start(a)
a<-table.element(a,'ARIMA Parameter Estimation and Backward Selection', ncols+1,TRUE)
a<-table.row.end(a)
a<-table.row.start(a)
a<-table.element(a,'Iteration', header=TRUE)
for (i in 1:ncols) {
a<-table.element(a,names(selection[[3]][[1]]$coef)[i],header=TRUE)
}
a<-table.row.end(a)
for (j in 1:nrows) {
a<-table.row.start(a)
mydum <- 'Estimates ('
mydum <- paste(mydum,j)
mydum <- paste(mydum,')')
a<-table.element(a,mydum, header=TRUE)
for (i in 1:ncols) {
a<-table.element(a,round(selection[[1]][j,i],4))
}
a<-table.row.end(a)
a<-table.row.start(a)
a<-table.element(a,'(p-val)', header=TRUE)
for (i in 1:ncols) {
mydum <- '('
mydum <- paste(mydum,round(selection[[2]][j,i],4),sep='')
mydum <- paste(mydum,')')
a<-table.element(a,mydum)
}
a<-table.row.end(a)
}
a<-table.end(a)
table.save(a,file='mytable.tab')
a<-table.start()
a<-table.row.start(a)
a<-table.element(a,'Estimated ARIMA Residuals', 1,TRUE)
a<-table.row.end(a)
a<-table.row.start(a)
a<-table.element(a,'Value', 1,TRUE)
a<-table.row.end(a)
for (i in (par4*par5+par3):length(resid)) {
a<-table.row.start(a)
a<-table.element(a,resid[i])
a<-table.row.end(a)
}
a<-table.end(a)
table.save(a,file='mytable1.tab')