Free Statistics

of Irreproducible Research!

Author's title

Author*The author of this computation has been verified*
R Software Modulerwasp_autocorrelation.wasp
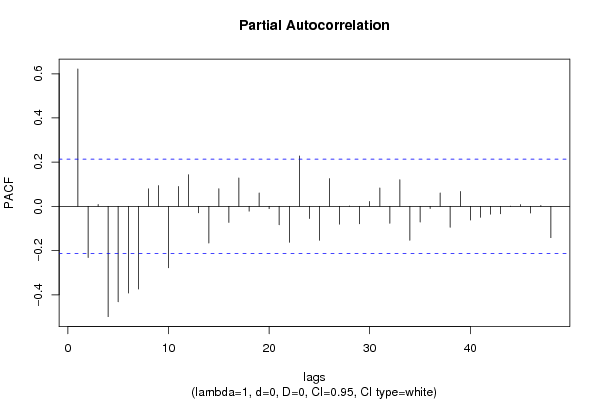
Title produced by software(Partial) Autocorrelation Function
Date of computationSun, 19 Dec 2010 10:16:34 +0000
Cite this page as followsStatistical Computations at FreeStatistics.org, Office for Research Development and Education, URL https://freestatistics.org/blog/index.php?v=date/2010/Dec/19/t1292753676v23htbebspli9aq.htm/, Retrieved Sat, 04 May 2024 21:15:44 +0000
Statistical Computations at FreeStatistics.org, Office for Research Development and Education, URL https://freestatistics.org/blog/index.php?pk=112248, Retrieved Sat, 04 May 2024 21:15:44 +0000
QR Codes:

Original text written by user:
IsPrivate?No (this computation is public)
User-defined keywords
Estimated Impact150
Family? (F = Feedback message, R = changed R code, M = changed R Module, P = changed Parameters, D = changed Data)
-     [Classical Decomposition] [HPC Retail Sales] [2008-03-02 16:19:32] [74be16979710d4c4e7c6647856088456]
- RMPD    [(Partial) Autocorrelation Function] [ACF huwelijken] [2010-12-19 10:16:34] [3f56c8f677e988de577e4e00a8180a48] [Current]
Feedback Forum

Post a new message
Dataseries X:
3111
3995
5245
5588
10681
10516
7496
9935
10249
6271
3616
3724
2886
3318
4166
6401
9209
9820
7470
8207
9564
5309
3385
3706
2733
3045
3449
5542
10072
9418
7516
7840
10081
4956
3641
3970
2931
3170
3889
4850
8037
12370
6712
7297
10613
5184
3506
3810
2692
3073
3713
4555
7807
10869
9682
7704
9826
5456
3677
3431
2765
3483
3445
6081
8767
9407
6551
12480
9530
5960
3252
3717
2642
2989
3607
5366
8898
9435
7328
8594
11349
5797
3621
3851


Summary of computational transaction
Raw Inputview raw input (R code)
Raw Outputview raw output of R engine
Computing time2 seconds
R Server'Sir Ronald Aylmer Fisher' @ 193.190.124.24

\begin{tabular}{lllllllll}
\hline
Summary of computational transaction \tabularnewline
Raw Input & view raw input (R code)  \tabularnewline
Raw Output & view raw output of R engine  \tabularnewline
Computing time & 2 seconds \tabularnewline
R Server & 'Sir Ronald Aylmer Fisher' @ 193.190.124.24 \tabularnewline
\hline
\end{tabular}
%Source: https://freestatistics.org/blog/index.php?pk=112248&T=0

[TABLE]
[ROW][C]Summary of computational transaction[/C][/ROW]
[ROW][C]Raw Input[/C][C]view raw input (R code) [/C][/ROW]
[ROW][C]Raw Output[/C][C]view raw output of R engine [/C][/ROW]
[ROW][C]Computing time[/C][C]2 seconds[/C][/ROW]
[ROW][C]R Server[/C][C]'Sir Ronald Aylmer Fisher' @ 193.190.124.24[/C][/ROW]
[/TABLE]
Source: https://freestatistics.org/blog/index.php?pk=112248&T=0

Globally Unique Identifier (entire table): ba.freestatistics.org/blog/index.php?pk=112248&T=0

As an alternative you can also use a QR Code:  

The GUIDs for individual cells are displayed in the table below:

Summary of computational transaction
Raw Inputview raw input (R code)
Raw Outputview raw output of R engine
Computing time2 seconds
R Server'Sir Ronald Aylmer Fisher' @ 193.190.124.24


Autocorrelation Function
Time lag kACF(k)T-STATP-value
10.621715.69810
20.2445572.24140.013819
30.0481810.44160.329961
4-0.305756-2.80230.003149
5-0.655764-6.01020
6-0.744157-6.82030
7-0.643267-5.89560
8-0.317206-2.90720.002331
90.0545930.50040.309067
100.2407632.20660.015035
110.5409024.95752e-06
120.7818427.16570
130.5839195.35170
140.2241062.0540.021544
150.037340.34220.366516
16-0.261607-2.39770.009358
17-0.535146-4.90472e-06
18-0.626438-5.74140
19-0.541349-4.96152e-06
20-0.275913-2.52880.006658
210.0172380.1580.437422
220.1793211.64350.052009
230.4607954.22333e-05
240.647525.93460
250.4407924.03995.9e-05
260.2359572.16260.016708
270.0605090.55460.290331
28-0.207641-1.90310.030229
29-0.452502-4.14734e-05
30-0.504776-4.62637e-06
31-0.442773-4.05815.5e-05
32-0.233837-2.14320.017497
330.0116190.10650.457724
340.1272811.16650.123347
350.3445953.15830.001103
360.5222684.78674e-06
370.3749753.43670.000459
380.1557371.42740.078592
390.0794360.7280.234305
40-0.136283-1.24910.107558
41-0.358673-3.28730.000739
42-0.405827-3.71950.00018
43-0.34948-3.2030.000961
44-0.194702-1.78450.038979
45-0.007835-0.07180.471463
460.1017340.93240.1769
470.2631112.41150.009034
480.3864683.5420.000325

\begin{tabular}{lllllllll}
\hline
Autocorrelation Function \tabularnewline
Time lag k & ACF(k) & T-STAT & P-value \tabularnewline
1 & 0.62171 & 5.6981 & 0 \tabularnewline
2 & 0.244557 & 2.2414 & 0.013819 \tabularnewline
3 & 0.048181 & 0.4416 & 0.329961 \tabularnewline
4 & -0.305756 & -2.8023 & 0.003149 \tabularnewline
5 & -0.655764 & -6.0102 & 0 \tabularnewline
6 & -0.744157 & -6.8203 & 0 \tabularnewline
7 & -0.643267 & -5.8956 & 0 \tabularnewline
8 & -0.317206 & -2.9072 & 0.002331 \tabularnewline
9 & 0.054593 & 0.5004 & 0.309067 \tabularnewline
10 & 0.240763 & 2.2066 & 0.015035 \tabularnewline
11 & 0.540902 & 4.9575 & 2e-06 \tabularnewline
12 & 0.781842 & 7.1657 & 0 \tabularnewline
13 & 0.583919 & 5.3517 & 0 \tabularnewline
14 & 0.224106 & 2.054 & 0.021544 \tabularnewline
15 & 0.03734 & 0.3422 & 0.366516 \tabularnewline
16 & -0.261607 & -2.3977 & 0.009358 \tabularnewline
17 & -0.535146 & -4.9047 & 2e-06 \tabularnewline
18 & -0.626438 & -5.7414 & 0 \tabularnewline
19 & -0.541349 & -4.9615 & 2e-06 \tabularnewline
20 & -0.275913 & -2.5288 & 0.006658 \tabularnewline
21 & 0.017238 & 0.158 & 0.437422 \tabularnewline
22 & 0.179321 & 1.6435 & 0.052009 \tabularnewline
23 & 0.460795 & 4.2233 & 3e-05 \tabularnewline
24 & 0.64752 & 5.9346 & 0 \tabularnewline
25 & 0.440792 & 4.0399 & 5.9e-05 \tabularnewline
26 & 0.235957 & 2.1626 & 0.016708 \tabularnewline
27 & 0.060509 & 0.5546 & 0.290331 \tabularnewline
28 & -0.207641 & -1.9031 & 0.030229 \tabularnewline
29 & -0.452502 & -4.1473 & 4e-05 \tabularnewline
30 & -0.504776 & -4.6263 & 7e-06 \tabularnewline
31 & -0.442773 & -4.0581 & 5.5e-05 \tabularnewline
32 & -0.233837 & -2.1432 & 0.017497 \tabularnewline
33 & 0.011619 & 0.1065 & 0.457724 \tabularnewline
34 & 0.127281 & 1.1665 & 0.123347 \tabularnewline
35 & 0.344595 & 3.1583 & 0.001103 \tabularnewline
36 & 0.522268 & 4.7867 & 4e-06 \tabularnewline
37 & 0.374975 & 3.4367 & 0.000459 \tabularnewline
38 & 0.155737 & 1.4274 & 0.078592 \tabularnewline
39 & 0.079436 & 0.728 & 0.234305 \tabularnewline
40 & -0.136283 & -1.2491 & 0.107558 \tabularnewline
41 & -0.358673 & -3.2873 & 0.000739 \tabularnewline
42 & -0.405827 & -3.7195 & 0.00018 \tabularnewline
43 & -0.34948 & -3.203 & 0.000961 \tabularnewline
44 & -0.194702 & -1.7845 & 0.038979 \tabularnewline
45 & -0.007835 & -0.0718 & 0.471463 \tabularnewline
46 & 0.101734 & 0.9324 & 0.1769 \tabularnewline
47 & 0.263111 & 2.4115 & 0.009034 \tabularnewline
48 & 0.386468 & 3.542 & 0.000325 \tabularnewline
\hline
\end{tabular}
%Source: https://freestatistics.org/blog/index.php?pk=112248&T=1

[TABLE]
[ROW][C]Autocorrelation Function[/C][/ROW]
[ROW][C]Time lag k[/C][C]ACF(k)[/C][C]T-STAT[/C][C]P-value[/C][/ROW]
[ROW][C]1[/C][C]0.62171[/C][C]5.6981[/C][C]0[/C][/ROW]
[ROW][C]2[/C][C]0.244557[/C][C]2.2414[/C][C]0.013819[/C][/ROW]
[ROW][C]3[/C][C]0.048181[/C][C]0.4416[/C][C]0.329961[/C][/ROW]
[ROW][C]4[/C][C]-0.305756[/C][C]-2.8023[/C][C]0.003149[/C][/ROW]
[ROW][C]5[/C][C]-0.655764[/C][C]-6.0102[/C][C]0[/C][/ROW]
[ROW][C]6[/C][C]-0.744157[/C][C]-6.8203[/C][C]0[/C][/ROW]
[ROW][C]7[/C][C]-0.643267[/C][C]-5.8956[/C][C]0[/C][/ROW]
[ROW][C]8[/C][C]-0.317206[/C][C]-2.9072[/C][C]0.002331[/C][/ROW]
[ROW][C]9[/C][C]0.054593[/C][C]0.5004[/C][C]0.309067[/C][/ROW]
[ROW][C]10[/C][C]0.240763[/C][C]2.2066[/C][C]0.015035[/C][/ROW]
[ROW][C]11[/C][C]0.540902[/C][C]4.9575[/C][C]2e-06[/C][/ROW]
[ROW][C]12[/C][C]0.781842[/C][C]7.1657[/C][C]0[/C][/ROW]
[ROW][C]13[/C][C]0.583919[/C][C]5.3517[/C][C]0[/C][/ROW]
[ROW][C]14[/C][C]0.224106[/C][C]2.054[/C][C]0.021544[/C][/ROW]
[ROW][C]15[/C][C]0.03734[/C][C]0.3422[/C][C]0.366516[/C][/ROW]
[ROW][C]16[/C][C]-0.261607[/C][C]-2.3977[/C][C]0.009358[/C][/ROW]
[ROW][C]17[/C][C]-0.535146[/C][C]-4.9047[/C][C]2e-06[/C][/ROW]
[ROW][C]18[/C][C]-0.626438[/C][C]-5.7414[/C][C]0[/C][/ROW]
[ROW][C]19[/C][C]-0.541349[/C][C]-4.9615[/C][C]2e-06[/C][/ROW]
[ROW][C]20[/C][C]-0.275913[/C][C]-2.5288[/C][C]0.006658[/C][/ROW]
[ROW][C]21[/C][C]0.017238[/C][C]0.158[/C][C]0.437422[/C][/ROW]
[ROW][C]22[/C][C]0.179321[/C][C]1.6435[/C][C]0.052009[/C][/ROW]
[ROW][C]23[/C][C]0.460795[/C][C]4.2233[/C][C]3e-05[/C][/ROW]
[ROW][C]24[/C][C]0.64752[/C][C]5.9346[/C][C]0[/C][/ROW]
[ROW][C]25[/C][C]0.440792[/C][C]4.0399[/C][C]5.9e-05[/C][/ROW]
[ROW][C]26[/C][C]0.235957[/C][C]2.1626[/C][C]0.016708[/C][/ROW]
[ROW][C]27[/C][C]0.060509[/C][C]0.5546[/C][C]0.290331[/C][/ROW]
[ROW][C]28[/C][C]-0.207641[/C][C]-1.9031[/C][C]0.030229[/C][/ROW]
[ROW][C]29[/C][C]-0.452502[/C][C]-4.1473[/C][C]4e-05[/C][/ROW]
[ROW][C]30[/C][C]-0.504776[/C][C]-4.6263[/C][C]7e-06[/C][/ROW]
[ROW][C]31[/C][C]-0.442773[/C][C]-4.0581[/C][C]5.5e-05[/C][/ROW]
[ROW][C]32[/C][C]-0.233837[/C][C]-2.1432[/C][C]0.017497[/C][/ROW]
[ROW][C]33[/C][C]0.011619[/C][C]0.1065[/C][C]0.457724[/C][/ROW]
[ROW][C]34[/C][C]0.127281[/C][C]1.1665[/C][C]0.123347[/C][/ROW]
[ROW][C]35[/C][C]0.344595[/C][C]3.1583[/C][C]0.001103[/C][/ROW]
[ROW][C]36[/C][C]0.522268[/C][C]4.7867[/C][C]4e-06[/C][/ROW]
[ROW][C]37[/C][C]0.374975[/C][C]3.4367[/C][C]0.000459[/C][/ROW]
[ROW][C]38[/C][C]0.155737[/C][C]1.4274[/C][C]0.078592[/C][/ROW]
[ROW][C]39[/C][C]0.079436[/C][C]0.728[/C][C]0.234305[/C][/ROW]
[ROW][C]40[/C][C]-0.136283[/C][C]-1.2491[/C][C]0.107558[/C][/ROW]
[ROW][C]41[/C][C]-0.358673[/C][C]-3.2873[/C][C]0.000739[/C][/ROW]
[ROW][C]42[/C][C]-0.405827[/C][C]-3.7195[/C][C]0.00018[/C][/ROW]
[ROW][C]43[/C][C]-0.34948[/C][C]-3.203[/C][C]0.000961[/C][/ROW]
[ROW][C]44[/C][C]-0.194702[/C][C]-1.7845[/C][C]0.038979[/C][/ROW]
[ROW][C]45[/C][C]-0.007835[/C][C]-0.0718[/C][C]0.471463[/C][/ROW]
[ROW][C]46[/C][C]0.101734[/C][C]0.9324[/C][C]0.1769[/C][/ROW]
[ROW][C]47[/C][C]0.263111[/C][C]2.4115[/C][C]0.009034[/C][/ROW]
[ROW][C]48[/C][C]0.386468[/C][C]3.542[/C][C]0.000325[/C][/ROW]
[/TABLE]
Source: https://freestatistics.org/blog/index.php?pk=112248&T=1

Globally Unique Identifier (entire table): ba.freestatistics.org/blog/index.php?pk=112248&T=1

As an alternative you can also use a QR Code:  

The GUIDs for individual cells are displayed in the table below:

Autocorrelation Function
Time lag kACF(k)T-STATP-value
10.621715.69810
20.2445572.24140.013819
30.0481810.44160.329961
4-0.305756-2.80230.003149
5-0.655764-6.01020
6-0.744157-6.82030
7-0.643267-5.89560
8-0.317206-2.90720.002331
90.0545930.50040.309067
100.2407632.20660.015035
110.5409024.95752e-06
120.7818427.16570
130.5839195.35170
140.2241062.0540.021544
150.037340.34220.366516
16-0.261607-2.39770.009358
17-0.535146-4.90472e-06
18-0.626438-5.74140
19-0.541349-4.96152e-06
20-0.275913-2.52880.006658
210.0172380.1580.437422
220.1793211.64350.052009
230.4607954.22333e-05
240.647525.93460
250.4407924.03995.9e-05
260.2359572.16260.016708
270.0605090.55460.290331
28-0.207641-1.90310.030229
29-0.452502-4.14734e-05
30-0.504776-4.62637e-06
31-0.442773-4.05815.5e-05
32-0.233837-2.14320.017497
330.0116190.10650.457724
340.1272811.16650.123347
350.3445953.15830.001103
360.5222684.78674e-06
370.3749753.43670.000459
380.1557371.42740.078592
390.0794360.7280.234305
40-0.136283-1.24910.107558
41-0.358673-3.28730.000739
42-0.405827-3.71950.00018
43-0.34948-3.2030.000961
44-0.194702-1.78450.038979
45-0.007835-0.07180.471463
460.1017340.93240.1769
470.2631112.41150.009034
480.3864683.5420.000325


Partial Autocorrelation Function
Time lag kPACF(k)T-STATP-value
10.621715.69810
2-0.231412-2.12090.018438
30.008310.07620.469737
4-0.49907-4.57418e-06
5-0.431405-3.95398e-05
6-0.392531-3.59760.000271
7-0.373891-3.42680.000474
80.0791540.72550.235095
90.09380.85970.196204
10-0.277849-2.54650.006352
110.0895420.82070.20708
120.1431071.31160.096615
13-0.029337-0.26890.394341
14-0.166062-1.5220.065885
150.079980.7330.232792
16-0.072581-0.66520.253867
170.1288051.18050.120563
18-0.021656-0.19850.421573
190.0603740.55330.290751
20-0.01049-0.09610.461818
21-0.083405-0.76440.223379
22-0.162475-1.48910.070101
230.2281932.09140.019755
24-0.055177-0.50570.307194
25-0.153088-1.40310.082141
260.125711.15210.126265
27-0.080515-0.73790.231306
280.001790.01640.493475
29-0.079111-0.72510.235213
300.0217090.1990.421386
310.0836010.76620.222847
32-0.07666-0.70260.242123
330.1206941.10620.135903
34-0.1535-1.40680.081581
35-0.071289-0.65340.257649
36-0.010255-0.0940.462669
370.0609760.55890.288873
38-0.094297-0.86420.194957
390.0672360.61620.269704
40-0.06204-0.56860.28557
41-0.04933-0.45210.326175
42-0.035388-0.32430.373245
43-0.033663-0.30850.379222
440.0007510.00690.497264
450.0078480.07190.471416
46-0.029947-0.27450.392201
470.0043670.040.484083
48-0.141515-1.2970.099091

\begin{tabular}{lllllllll}
\hline
Partial Autocorrelation Function \tabularnewline
Time lag k & PACF(k) & T-STAT & P-value \tabularnewline
1 & 0.62171 & 5.6981 & 0 \tabularnewline
2 & -0.231412 & -2.1209 & 0.018438 \tabularnewline
3 & 0.00831 & 0.0762 & 0.469737 \tabularnewline
4 & -0.49907 & -4.5741 & 8e-06 \tabularnewline
5 & -0.431405 & -3.9539 & 8e-05 \tabularnewline
6 & -0.392531 & -3.5976 & 0.000271 \tabularnewline
7 & -0.373891 & -3.4268 & 0.000474 \tabularnewline
8 & 0.079154 & 0.7255 & 0.235095 \tabularnewline
9 & 0.0938 & 0.8597 & 0.196204 \tabularnewline
10 & -0.277849 & -2.5465 & 0.006352 \tabularnewline
11 & 0.089542 & 0.8207 & 0.20708 \tabularnewline
12 & 0.143107 & 1.3116 & 0.096615 \tabularnewline
13 & -0.029337 & -0.2689 & 0.394341 \tabularnewline
14 & -0.166062 & -1.522 & 0.065885 \tabularnewline
15 & 0.07998 & 0.733 & 0.232792 \tabularnewline
16 & -0.072581 & -0.6652 & 0.253867 \tabularnewline
17 & 0.128805 & 1.1805 & 0.120563 \tabularnewline
18 & -0.021656 & -0.1985 & 0.421573 \tabularnewline
19 & 0.060374 & 0.5533 & 0.290751 \tabularnewline
20 & -0.01049 & -0.0961 & 0.461818 \tabularnewline
21 & -0.083405 & -0.7644 & 0.223379 \tabularnewline
22 & -0.162475 & -1.4891 & 0.070101 \tabularnewline
23 & 0.228193 & 2.0914 & 0.019755 \tabularnewline
24 & -0.055177 & -0.5057 & 0.307194 \tabularnewline
25 & -0.153088 & -1.4031 & 0.082141 \tabularnewline
26 & 0.12571 & 1.1521 & 0.126265 \tabularnewline
27 & -0.080515 & -0.7379 & 0.231306 \tabularnewline
28 & 0.00179 & 0.0164 & 0.493475 \tabularnewline
29 & -0.079111 & -0.7251 & 0.235213 \tabularnewline
30 & 0.021709 & 0.199 & 0.421386 \tabularnewline
31 & 0.083601 & 0.7662 & 0.222847 \tabularnewline
32 & -0.07666 & -0.7026 & 0.242123 \tabularnewline
33 & 0.120694 & 1.1062 & 0.135903 \tabularnewline
34 & -0.1535 & -1.4068 & 0.081581 \tabularnewline
35 & -0.071289 & -0.6534 & 0.257649 \tabularnewline
36 & -0.010255 & -0.094 & 0.462669 \tabularnewline
37 & 0.060976 & 0.5589 & 0.288873 \tabularnewline
38 & -0.094297 & -0.8642 & 0.194957 \tabularnewline
39 & 0.067236 & 0.6162 & 0.269704 \tabularnewline
40 & -0.06204 & -0.5686 & 0.28557 \tabularnewline
41 & -0.04933 & -0.4521 & 0.326175 \tabularnewline
42 & -0.035388 & -0.3243 & 0.373245 \tabularnewline
43 & -0.033663 & -0.3085 & 0.379222 \tabularnewline
44 & 0.000751 & 0.0069 & 0.497264 \tabularnewline
45 & 0.007848 & 0.0719 & 0.471416 \tabularnewline
46 & -0.029947 & -0.2745 & 0.392201 \tabularnewline
47 & 0.004367 & 0.04 & 0.484083 \tabularnewline
48 & -0.141515 & -1.297 & 0.099091 \tabularnewline
\hline
\end{tabular}
%Source: https://freestatistics.org/blog/index.php?pk=112248&T=2

[TABLE]
[ROW][C]Partial Autocorrelation Function[/C][/ROW]
[ROW][C]Time lag k[/C][C]PACF(k)[/C][C]T-STAT[/C][C]P-value[/C][/ROW]
[ROW][C]1[/C][C]0.62171[/C][C]5.6981[/C][C]0[/C][/ROW]
[ROW][C]2[/C][C]-0.231412[/C][C]-2.1209[/C][C]0.018438[/C][/ROW]
[ROW][C]3[/C][C]0.00831[/C][C]0.0762[/C][C]0.469737[/C][/ROW]
[ROW][C]4[/C][C]-0.49907[/C][C]-4.5741[/C][C]8e-06[/C][/ROW]
[ROW][C]5[/C][C]-0.431405[/C][C]-3.9539[/C][C]8e-05[/C][/ROW]
[ROW][C]6[/C][C]-0.392531[/C][C]-3.5976[/C][C]0.000271[/C][/ROW]
[ROW][C]7[/C][C]-0.373891[/C][C]-3.4268[/C][C]0.000474[/C][/ROW]
[ROW][C]8[/C][C]0.079154[/C][C]0.7255[/C][C]0.235095[/C][/ROW]
[ROW][C]9[/C][C]0.0938[/C][C]0.8597[/C][C]0.196204[/C][/ROW]
[ROW][C]10[/C][C]-0.277849[/C][C]-2.5465[/C][C]0.006352[/C][/ROW]
[ROW][C]11[/C][C]0.089542[/C][C]0.8207[/C][C]0.20708[/C][/ROW]
[ROW][C]12[/C][C]0.143107[/C][C]1.3116[/C][C]0.096615[/C][/ROW]
[ROW][C]13[/C][C]-0.029337[/C][C]-0.2689[/C][C]0.394341[/C][/ROW]
[ROW][C]14[/C][C]-0.166062[/C][C]-1.522[/C][C]0.065885[/C][/ROW]
[ROW][C]15[/C][C]0.07998[/C][C]0.733[/C][C]0.232792[/C][/ROW]
[ROW][C]16[/C][C]-0.072581[/C][C]-0.6652[/C][C]0.253867[/C][/ROW]
[ROW][C]17[/C][C]0.128805[/C][C]1.1805[/C][C]0.120563[/C][/ROW]
[ROW][C]18[/C][C]-0.021656[/C][C]-0.1985[/C][C]0.421573[/C][/ROW]
[ROW][C]19[/C][C]0.060374[/C][C]0.5533[/C][C]0.290751[/C][/ROW]
[ROW][C]20[/C][C]-0.01049[/C][C]-0.0961[/C][C]0.461818[/C][/ROW]
[ROW][C]21[/C][C]-0.083405[/C][C]-0.7644[/C][C]0.223379[/C][/ROW]
[ROW][C]22[/C][C]-0.162475[/C][C]-1.4891[/C][C]0.070101[/C][/ROW]
[ROW][C]23[/C][C]0.228193[/C][C]2.0914[/C][C]0.019755[/C][/ROW]
[ROW][C]24[/C][C]-0.055177[/C][C]-0.5057[/C][C]0.307194[/C][/ROW]
[ROW][C]25[/C][C]-0.153088[/C][C]-1.4031[/C][C]0.082141[/C][/ROW]
[ROW][C]26[/C][C]0.12571[/C][C]1.1521[/C][C]0.126265[/C][/ROW]
[ROW][C]27[/C][C]-0.080515[/C][C]-0.7379[/C][C]0.231306[/C][/ROW]
[ROW][C]28[/C][C]0.00179[/C][C]0.0164[/C][C]0.493475[/C][/ROW]
[ROW][C]29[/C][C]-0.079111[/C][C]-0.7251[/C][C]0.235213[/C][/ROW]
[ROW][C]30[/C][C]0.021709[/C][C]0.199[/C][C]0.421386[/C][/ROW]
[ROW][C]31[/C][C]0.083601[/C][C]0.7662[/C][C]0.222847[/C][/ROW]
[ROW][C]32[/C][C]-0.07666[/C][C]-0.7026[/C][C]0.242123[/C][/ROW]
[ROW][C]33[/C][C]0.120694[/C][C]1.1062[/C][C]0.135903[/C][/ROW]
[ROW][C]34[/C][C]-0.1535[/C][C]-1.4068[/C][C]0.081581[/C][/ROW]
[ROW][C]35[/C][C]-0.071289[/C][C]-0.6534[/C][C]0.257649[/C][/ROW]
[ROW][C]36[/C][C]-0.010255[/C][C]-0.094[/C][C]0.462669[/C][/ROW]
[ROW][C]37[/C][C]0.060976[/C][C]0.5589[/C][C]0.288873[/C][/ROW]
[ROW][C]38[/C][C]-0.094297[/C][C]-0.8642[/C][C]0.194957[/C][/ROW]
[ROW][C]39[/C][C]0.067236[/C][C]0.6162[/C][C]0.269704[/C][/ROW]
[ROW][C]40[/C][C]-0.06204[/C][C]-0.5686[/C][C]0.28557[/C][/ROW]
[ROW][C]41[/C][C]-0.04933[/C][C]-0.4521[/C][C]0.326175[/C][/ROW]
[ROW][C]42[/C][C]-0.035388[/C][C]-0.3243[/C][C]0.373245[/C][/ROW]
[ROW][C]43[/C][C]-0.033663[/C][C]-0.3085[/C][C]0.379222[/C][/ROW]
[ROW][C]44[/C][C]0.000751[/C][C]0.0069[/C][C]0.497264[/C][/ROW]
[ROW][C]45[/C][C]0.007848[/C][C]0.0719[/C][C]0.471416[/C][/ROW]
[ROW][C]46[/C][C]-0.029947[/C][C]-0.2745[/C][C]0.392201[/C][/ROW]
[ROW][C]47[/C][C]0.004367[/C][C]0.04[/C][C]0.484083[/C][/ROW]
[ROW][C]48[/C][C]-0.141515[/C][C]-1.297[/C][C]0.099091[/C][/ROW]
[/TABLE]
Source: https://freestatistics.org/blog/index.php?pk=112248&T=2

Globally Unique Identifier (entire table): ba.freestatistics.org/blog/index.php?pk=112248&T=2

As an alternative you can also use a QR Code:  

The GUIDs for individual cells are displayed in the table below:

Partial Autocorrelation Function
Time lag kPACF(k)T-STATP-value
10.621715.69810
2-0.231412-2.12090.018438
30.008310.07620.469737
4-0.49907-4.57418e-06
5-0.431405-3.95398e-05
6-0.392531-3.59760.000271
7-0.373891-3.42680.000474
80.0791540.72550.235095
90.09380.85970.196204
10-0.277849-2.54650.006352
110.0895420.82070.20708
120.1431071.31160.096615
13-0.029337-0.26890.394341
14-0.166062-1.5220.065885
150.079980.7330.232792
16-0.072581-0.66520.253867
170.1288051.18050.120563
18-0.021656-0.19850.421573
190.0603740.55330.290751
20-0.01049-0.09610.461818
21-0.083405-0.76440.223379
22-0.162475-1.48910.070101
230.2281932.09140.019755
24-0.055177-0.50570.307194
25-0.153088-1.40310.082141
260.125711.15210.126265
27-0.080515-0.73790.231306
280.001790.01640.493475
29-0.079111-0.72510.235213
300.0217090.1990.421386
310.0836010.76620.222847
32-0.07666-0.70260.242123
330.1206941.10620.135903
34-0.1535-1.40680.081581
35-0.071289-0.65340.257649
36-0.010255-0.0940.462669
370.0609760.55890.288873
38-0.094297-0.86420.194957
390.0672360.61620.269704
40-0.06204-0.56860.28557
41-0.04933-0.45210.326175
42-0.035388-0.32430.373245
43-0.033663-0.30850.379222
440.0007510.00690.497264
450.0078480.07190.471416
46-0.029947-0.27450.392201
470.0043670.040.484083
48-0.141515-1.2970.099091


Parameters (Session):
par1 = 48 ; par2 = 1 ; par3 = 0 ; par4 = 0 ; par5 = 12 ; par6 = White Noise ; par7 = 0.95 ;
Parameters (R input):
par1 = 48 ; par2 = 1 ; par3 = 0 ; par4 = 0 ; par5 = 12 ; par6 = White Noise ; par7 = 0.95 ; par8 = ;
R code (references can be found in the software module):
if (par1 == 'Default') {
par1 = 10*log10(length(x))
} else {
par1 <- as.numeric(par1)
}
par2 <- as.numeric(par2)
par3 <- as.numeric(par3)
par4 <- as.numeric(par4)
par5 <- as.numeric(par5)
if (par6 == 'White Noise') par6 <- 'white' else par6 <- 'ma'
par7 <- as.numeric(par7)
if (par8 != '') par8 <- as.numeric(par8)
ox <- x
if (par8 == '') {
if (par2 == 0) {
x <- log(x)
} else {
x <- (x ^ par2 - 1) / par2
}
} else {
x <- log(x,base=par8)
}
if (par3 > 0) x <- diff(x,lag=1,difference=par3)
if (par4 > 0) x <- diff(x,lag=par5,difference=par4)
bitmap(file='picts.png')
op <- par(mfrow=c(2,1))
plot(ox,type='l',main='Original Time Series',xlab='time',ylab='value')
if (par8=='') {
mytitle <- paste('Working Time Series (lambda=',par2,', d=',par3,', D=',par4,')',sep='')
mysub <- paste('(lambda=',par2,', d=',par3,', D=',par4,', CI=', par7, ', CI type=',par6,')',sep='')
} else {
mytitle <- paste('Working Time Series (base=',par8,', d=',par3,', D=',par4,')',sep='')
mysub <- paste('(base=',par8,', d=',par3,', D=',par4,', CI=', par7, ', CI type=',par6,')',sep='')
}
plot(x,type='l', main=mytitle,xlab='time',ylab='value')
par(op)
dev.off()
bitmap(file='pic1.png')
racf <- acf(x, par1, main='Autocorrelation', xlab='time lag', ylab='ACF', ci.type=par6, ci=par7, sub=mysub)
dev.off()
bitmap(file='pic2.png')
rpacf <- pacf(x,par1,main='Partial Autocorrelation',xlab='lags',ylab='PACF',sub=mysub)
dev.off()
(myacf <- c(racf$acf))
(mypacf <- c(rpacf$acf))
lengthx <- length(x)
sqrtn <- sqrt(lengthx)
load(file='createtable')
a<-table.start()
a<-table.row.start(a)
a<-table.element(a,'Autocorrelation Function',4,TRUE)
a<-table.row.end(a)
a<-table.row.start(a)
a<-table.element(a,'Time lag k',header=TRUE)
a<-table.element(a,hyperlink('basics.htm','ACF(k)','click here for more information about the Autocorrelation Function'),header=TRUE)
a<-table.element(a,'T-STAT',header=TRUE)
a<-table.element(a,'P-value',header=TRUE)
a<-table.row.end(a)
for (i in 2:(par1+1)) {
a<-table.row.start(a)
a<-table.element(a,i-1,header=TRUE)
a<-table.element(a,round(myacf[i],6))
mytstat <- myacf[i]*sqrtn
a<-table.element(a,round(mytstat,4))
a<-table.element(a,round(1-pt(abs(mytstat),lengthx),6))
a<-table.row.end(a)
}
a<-table.end(a)
table.save(a,file='mytable.tab')
a<-table.start()
a<-table.row.start(a)
a<-table.element(a,'Partial Autocorrelation Function',4,TRUE)
a<-table.row.end(a)
a<-table.row.start(a)
a<-table.element(a,'Time lag k',header=TRUE)
a<-table.element(a,hyperlink('basics.htm','PACF(k)','click here for more information about the Partial Autocorrelation Function'),header=TRUE)
a<-table.element(a,'T-STAT',header=TRUE)
a<-table.element(a,'P-value',header=TRUE)
a<-table.row.end(a)
for (i in 1:par1) {
a<-table.row.start(a)
a<-table.element(a,i,header=TRUE)
a<-table.element(a,round(mypacf[i],6))
mytstat <- mypacf[i]*sqrtn
a<-table.element(a,round(mytstat,4))
a<-table.element(a,round(1-pt(abs(mytstat),lengthx),6))
a<-table.row.end(a)
}
a<-table.end(a)
table.save(a,file='mytable1.tab')