| Multiple Linear Regression - Estimated Regression Equation |
| Totaal[t] = + 121.350385460641 + 15.4495309520155crisis[t] + 1.07950932409880`t-1`[t] -0.50927530639777`t-2`[t] + 0.0759563844468494`t-3`[t] + 0.0672167107393819`t-4`[t] + 0.440072107331956`t-12`[t] -0.382095098205888`t-24 `[t] + e[t] |
| Multiple Linear Regression - Ordinary Least Squares | |||||
| Variable | Parameter | S.D. | T-STAT H0: parameter = 0 | 2-tail p-value | 1-tail p-value |
| (Intercept) | 121.350385460641 | 87.277162 | 1.3904 | 0.170329 | 0.085165 |
| crisis | 15.4495309520155 | 8.971025 | 1.7222 | 0.090985 | 0.045492 |
| `t-1` | 1.07950932409880 | 0.142087 | 7.5975 | 0 | 0 |
| `t-2` | -0.50927530639777 | 0.20721 | -2.4578 | 0.01735 | 0.008675 |
| `t-3` | 0.0759563844468494 | 0.205224 | 0.3701 | 0.7128 | 0.3564 |
| `t-4` | 0.0672167107393819 | 0.14843 | 0.4529 | 0.652539 | 0.326269 |
| `t-12` | 0.440072107331956 | 0.15909 | 2.7662 | 0.007834 | 0.003917 |
| `t-24 ` | -0.382095098205888 | 0.152642 | -2.5032 | 0.015486 | 0.007743 |
| Multiple Linear Regression - Regression Statistics | |
| Multiple R | 0.92733413415113 |
| R-squared | 0.859948596361827 |
| Adjusted R-squared | 0.84109552279515 |
| F-TEST (value) | 45.6131777834778 |
| F-TEST (DF numerator) | 7 |
| F-TEST (DF denominator) | 52 |
| p-value | 0 |
| Multiple Linear Regression - Residual Statistics | |
| Residual Standard Deviation | 16.2044643843294 |
| Sum Squared Residuals | 13654.402631116 |
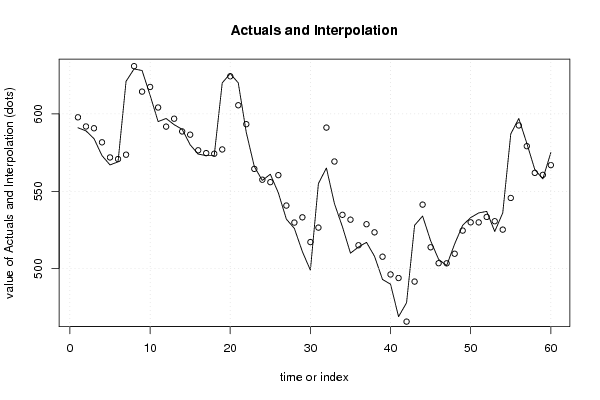
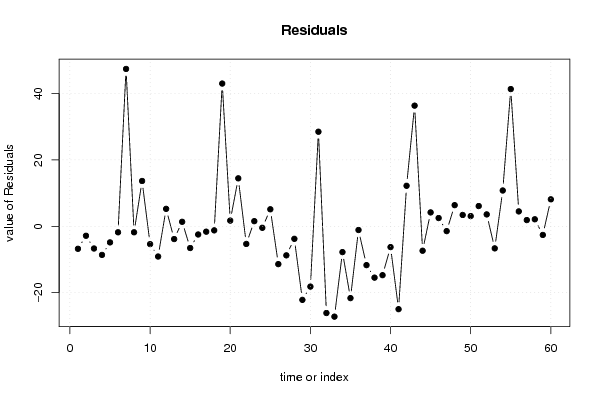
| Multiple Linear Regression - Actuals, Interpolation, and Residuals | |||
| Time or Index | Actuals | Interpolation Forecast | Residuals Prediction Error |
| 1 | 591 | 597.775264231122 | -6.7752642311221 |
| 2 | 589 | 591.846377760334 | -2.84637776033359 |
| 3 | 584 | 590.691965683054 | -6.69196568305394 |
| 4 | 573 | 581.617662765862 | -8.6176627658618 |
| 5 | 567 | 571.844913155236 | -4.84491315523601 |
| 6 | 569 | 570.803532292062 | -1.80353229206206 |
| 7 | 621 | 573.600380381199 | 47.3996196188013 |
| 8 | 629 | 630.799372241105 | -1.79937224110505 |
| 9 | 628 | 614.346077816744 | 13.6539221832555 |
| 10 | 612 | 617.363623516191 | -5.36362351619113 |
| 11 | 595 | 604.100155614093 | -9.10015561409346 |
| 12 | 597 | 591.741990629931 | 5.25800937006879 |
| 13 | 593 | 596.841216508233 | -3.84121650823289 |
| 14 | 590 | 588.639853575158 | 1.36014642484243 |
| 15 | 580 | 586.539865567352 | -6.539865567352 |
| 16 | 574 | 576.465459028862 | -2.46545902886191 |
| 17 | 573 | 574.618653195398 | -1.61865319539820 |
| 18 | 573 | 574.221155358428 | -1.22115535842797 |
| 19 | 620 | 576.999424823512 | 43.0005751764878 |
| 20 | 626 | 624.282066596428 | 1.71793340357167 |
| 21 | 620 | 605.551704125843 | 14.4482958741572 |
| 22 | 588 | 593.311982890966 | -5.31198289096582 |
| 23 | 566 | 564.45265091448 | 1.54734908552033 |
| 24 | 557 | 557.445866663248 | -0.445866663247895 |
| 25 | 561 | 555.86852688387 | 5.13147311613013 |
| 26 | 549 | 560.39204061077 | -11.39204061077 |
| 27 | 532 | 540.748206817415 | -8.74820681741515 |
| 28 | 526 | 529.769340561915 | -3.76934056191475 |
| 29 | 511 | 533.159853537583 | -22.1598535375827 |
| 30 | 499 | 517.160816253607 | -18.1608162536066 |
| 31 | 555 | 526.511386461048 | 28.4886135389518 |
| 32 | 565 | 591.11623811456 | -26.1162381145599 |
| 33 | 542 | 569.213849377034 | -27.2138493770340 |
| 34 | 527 | 534.770552995607 | -7.7705529956065 |
| 35 | 510 | 531.628975135344 | -21.6289751353441 |
| 36 | 514 | 515.116777324348 | -1.11677732434796 |
| 37 | 517 | 528.695833537948 | -11.6958335379481 |
| 38 | 508 | 523.4631710946 | -15.4631710946005 |
| 39 | 493 | 507.720627871151 | -14.7206278711515 |
| 40 | 490 | 496.260339708791 | -6.26033970879102 |
| 41 | 469 | 493.959997492884 | -24.9599974928842 |
| 42 | 478 | 465.792966154662 | 12.2070338453380 |
| 43 | 528 | 491.652780086386 | 36.3472199136141 |
| 44 | 534 | 541.356184812228 | -7.35618481222837 |
| 45 | 518 | 513.812444092028 | 4.18755590797234 |
| 46 | 506 | 503.513374219666 | 2.48662578033381 |
| 47 | 502 | 503.449107412381 | -1.44910741238136 |
| 48 | 516 | 509.629516219227 | 6.37048378077309 |
| 49 | 528 | 524.584639926181 | 3.41536007381878 |
| 50 | 533 | 529.922963671621 | 3.07703632837886 |
| 51 | 536 | 529.898264214161 | 6.10173578583897 |
| 52 | 537 | 533.415280485422 | 3.58471951457841 |
| 53 | 524 | 530.643258560551 | -6.64325856055116 |
| 54 | 536 | 525.210104892365 | 10.7898951076353 |
| 55 | 587 | 545.668682148454 | 41.3313178515456 |
| 56 | 597 | 592.511619375583 | 4.4883806244168 |
| 57 | 581 | 579.118364905459 | 1.88163509454067 |
| 58 | 564 | 561.884399976668 | 2.11560002333245 |
| 59 | 558 | 560.604090701701 | -2.60409070170147 |
| 60 | 575 | 566.874209031939 | 8.1257909680612 |
| Goldfeld-Quandt test for Heteroskedasticity | |||
| p-values | Alternative Hypothesis | ||
| breakpoint index | greater | 2-sided | less |
| 11 | 0.110948631231029 | 0.221897262462059 | 0.88905136876897 |
| 12 | 0.0482329476659703 | 0.0964658953319405 | 0.95176705233403 |
| 13 | 0.0195503049620977 | 0.0391006099241954 | 0.980449695037902 |
| 14 | 0.0127386497038309 | 0.0254772994076618 | 0.98726135029617 |
| 15 | 0.0157369617954466 | 0.0314739235908933 | 0.984263038204553 |
| 16 | 0.0116793007389843 | 0.0233586014779686 | 0.988320699261016 |
| 17 | 0.00813113124147431 | 0.0162622624829486 | 0.991868868758526 |
| 18 | 0.00603013024879473 | 0.0120602604975895 | 0.993969869751205 |
| 19 | 0.00940571175264478 | 0.0188114235052896 | 0.990594288247355 |
| 20 | 0.00439325279037848 | 0.00878650558075696 | 0.995606747209622 |
| 21 | 0.00433311760453439 | 0.00866623520906877 | 0.995666882395466 |
| 22 | 0.00484923706649171 | 0.00969847413298342 | 0.995150762933508 |
| 23 | 0.00241477010448375 | 0.0048295402089675 | 0.997585229895516 |
| 24 | 0.00207581136788206 | 0.00415162273576413 | 0.997924188632118 |
| 25 | 0.00260678792008841 | 0.00521357584017682 | 0.997393212079912 |
| 26 | 0.0162500038945677 | 0.0325000077891355 | 0.983749996105432 |
| 27 | 0.0340006347137202 | 0.0680012694274404 | 0.96599936528628 |
| 28 | 0.0372938171773005 | 0.074587634354601 | 0.9627061828227 |
| 29 | 0.088727377920656 | 0.177454755841312 | 0.911272622079344 |
| 30 | 0.110324888236256 | 0.220649776472511 | 0.889675111763744 |
| 31 | 0.175724342942134 | 0.351448685884267 | 0.824275657057866 |
| 32 | 0.252778693323834 | 0.505557386647669 | 0.747221306676166 |
| 33 | 0.255466219370446 | 0.510932438740893 | 0.744533780629554 |
| 34 | 0.266284582270009 | 0.532569164540019 | 0.73371541772999 |
| 35 | 0.278588352213623 | 0.557176704427245 | 0.721411647786377 |
| 36 | 0.302086138167179 | 0.604172276334357 | 0.697913861832821 |
| 37 | 0.295089748133549 | 0.590179496267099 | 0.70491025186645 |
| 38 | 0.320700926601763 | 0.641401853203526 | 0.679299073398237 |
| 39 | 0.407317993872806 | 0.814635987745613 | 0.592682006127194 |
| 40 | 0.497682566369999 | 0.995365132739997 | 0.502317433630001 |
| 41 | 0.69374149948125 | 0.6125170010375 | 0.30625850051875 |
| 42 | 0.747616617571168 | 0.504766764857664 | 0.252383382428832 |
| 43 | 0.87073909149684 | 0.258521817006321 | 0.129260908503161 |
| 44 | 0.937082320687497 | 0.125835358625006 | 0.0629176793125032 |
| 45 | 0.93038397448665 | 0.139232051026699 | 0.0696160255133496 |
| 46 | 0.900177813034472 | 0.199644373931057 | 0.0998221869655284 |
| 47 | 0.824322291370719 | 0.351355417258562 | 0.175677708629281 |
| 48 | 0.715682492581568 | 0.568635014836864 | 0.284317507418432 |
| 49 | 0.624371888259115 | 0.751256223481769 | 0.375628111740885 |
| Meta Analysis of Goldfeld-Quandt test for Heteroskedasticity | |||
| Description | # significant tests | % significant tests | OK/NOK |
| 1% type I error level | 6 | 0.153846153846154 | NOK |
| 5% type I error level | 14 | 0.358974358974359 | NOK |
| 10% type I error level | 17 | 0.435897435897436 | NOK |