| Multiple Linear Regression - Estimated Regression Equation |
| nb[t] = + 4480.4 -142.400000000001M1[t] -138.9M2[t] + 527.6M3[t] + 110.433333333333M4[t] + 297.933333333333M5[t] + 841.6M6[t] -223.566666666667M7[t] -32M8[t] + 30.5999999999999M9[t] + 230.6M10[t] -405.6M11[t] + e[t] |
| Multiple Linear Regression - Ordinary Least Squares | |||||
| Variable | Parameter | S.D. | T-STAT H0: parameter = 0 | 2-tail p-value | 1-tail p-value |
| (Intercept) | 4480.4 | 307.670022 | 14.5624 | 0 | 0 |
| M1 | -142.400000000001 | 416.587179 | -0.3418 | 0.733785 | 0.366893 |
| M2 | -138.9 | 416.587179 | -0.3334 | 0.740082 | 0.370041 |
| M3 | 527.6 | 416.587179 | 1.2665 | 0.210678 | 0.105339 |
| M4 | 110.433333333333 | 416.587179 | 0.2651 | 0.791931 | 0.395965 |
| M5 | 297.933333333333 | 416.587179 | 0.7152 | 0.477525 | 0.238763 |
| M6 | 841.6 | 416.587179 | 2.0202 | 0.048241 | 0.024121 |
| M7 | -223.566666666667 | 416.587179 | -0.5367 | 0.593665 | 0.296833 |
| M8 | -32 | 435.111118 | -0.0735 | 0.94164 | 0.47082 |
| M9 | 30.5999999999999 | 435.111118 | 0.0703 | 0.944189 | 0.472094 |
| M10 | 230.6 | 435.111118 | 0.53 | 0.598259 | 0.29913 |
| M11 | -405.6 | 435.111118 | -0.9322 | 0.35532 | 0.17766 |
| Multiple Linear Regression - Regression Statistics | |
| Multiple R | 0.472454725383456 |
| R-squared | 0.223213467537157 |
| Adjusted R-squared | 0.0678561610445886 |
| F-TEST (value) | 1.43677482943382 |
| F-TEST (DF numerator) | 11 |
| F-TEST (DF denominator) | 55 |
| p-value | 0.183209866296029 |
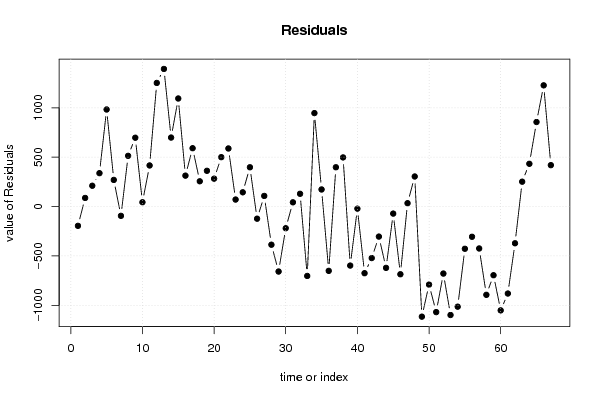
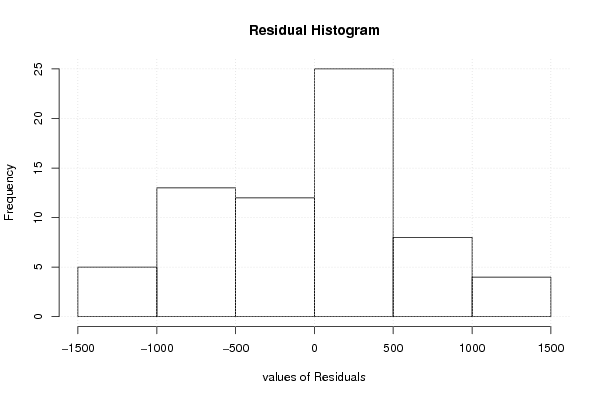
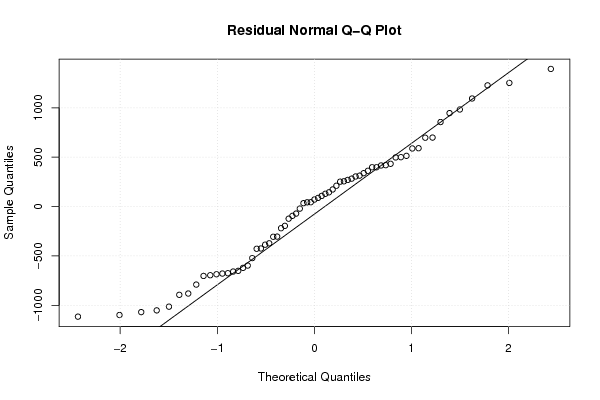
| Multiple Linear Regression - Residual Statistics | |
| Residual Standard Deviation | 687.97108422322 |
| Sum Squared Residuals | 26031731.7 |
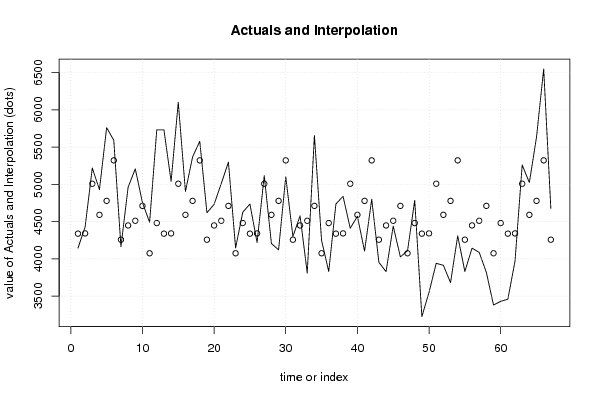
| Multiple Linear Regression - Actuals, Interpolation, and Residuals | |||
| Time or Index | Actuals | Interpolation Forecast | Residuals Prediction Error |
| 1 | 4143 | 4338 | -195.000000000004 |
| 2 | 4429 | 4341.5 | 87.5 |
| 3 | 5219 | 5008 | 211 |
| 4 | 4929 | 4590.83333333333 | 338.166666666667 |
| 5 | 5761 | 4778.33333333333 | 982.666666666667 |
| 6 | 5592 | 5322 | 270 |
| 7 | 4163 | 4256.83333333333 | -93.8333333333334 |
| 8 | 4962 | 4448.4 | 513.6 |
| 9 | 5208 | 4511 | 697 |
| 10 | 4755 | 4711 | 44.0000000000001 |
| 11 | 4491 | 4074.8 | 416.2 |
| 12 | 5732 | 4480.4 | 1251.6 |
| 13 | 5731 | 4338 | 1393 |
| 14 | 5040 | 4341.5 | 698.5 |
| 15 | 6102 | 5008 | 1094 |
| 16 | 4904 | 4590.83333333333 | 313.166666666667 |
| 17 | 5369 | 4778.33333333333 | 590.666666666667 |
| 18 | 5578 | 5322 | 256 |
| 19 | 4619 | 4256.83333333333 | 362.166666666667 |
| 20 | 4731 | 4448.4 | 282.6 |
| 21 | 5011 | 4511 | 500 |
| 22 | 5299 | 4711 | 588 |
| 23 | 4146 | 4074.8 | 71.2 |
| 24 | 4625 | 4480.4 | 144.6 |
| 25 | 4736 | 4338 | 398.000000000001 |
| 26 | 4219 | 4341.5 | -122.5 |
| 27 | 5116 | 5008 | 108 |
| 28 | 4205 | 4590.83333333333 | -385.833333333333 |
| 29 | 4121 | 4778.33333333333 | -657.333333333333 |
| 30 | 5103 | 5322 | -219 |
| 31 | 4300 | 4256.83333333333 | 43.1666666666667 |
| 32 | 4578 | 4448.4 | 129.6 |
| 33 | 3809 | 4511 | -702 |
| 34 | 5657 | 4711 | 946 |
| 35 | 4248 | 4074.8 | 173.2 |
| 36 | 3830 | 4480.4 | -650.4 |
| 37 | 4736 | 4338 | 398.000000000001 |
| 38 | 4839 | 4341.5 | 497.5 |
| 39 | 4411 | 5008 | -597 |
| 40 | 4570 | 4590.83333333333 | -20.8333333333333 |
| 41 | 4104 | 4778.33333333333 | -674.333333333333 |
| 42 | 4801 | 5322 | -521 |
| 43 | 3953 | 4256.83333333333 | -303.833333333333 |
| 44 | 3828 | 4448.4 | -620.4 |
| 45 | 4440 | 4511 | -71 |
| 46 | 4026 | 4711 | -685 |
| 47 | 4109 | 4074.8 | 34.2 |
| 48 | 4785 | 4480.4 | 304.6 |
| 49 | 3224 | 4338 | -1114 |
| 50 | 3552 | 4341.5 | -789.5 |
| 51 | 3940 | 5008 | -1068 |
| 52 | 3913 | 4590.83333333333 | -677.833333333333 |
| 53 | 3681 | 4778.33333333333 | -1097.33333333333 |
| 54 | 4309 | 5322 | -1013 |
| 55 | 3830 | 4256.83333333333 | -426.833333333333 |
| 56 | 4143 | 4448.4 | -305.4 |
| 57 | 4087 | 4511 | -424 |
| 58 | 3818 | 4711 | -893 |
| 59 | 3380 | 4074.8 | -694.8 |
| 60 | 3430 | 4480.4 | -1050.4 |
| 61 | 3458 | 4338 | -879.999999999999 |
| 62 | 3970 | 4341.5 | -371.5 |
| 63 | 5260 | 5008 | 252 |
| 64 | 5024 | 4590.83333333333 | 433.166666666667 |
| 65 | 5634 | 4778.33333333333 | 855.666666666667 |
| 66 | 6549 | 5322 | 1227 |
| 67 | 4676 | 4256.83333333333 | 419.166666666667 |
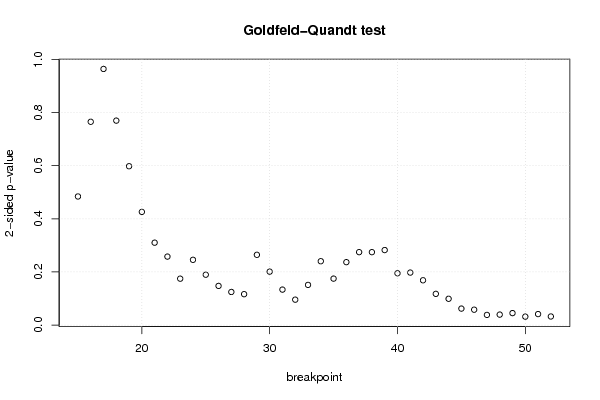
| Goldfeld-Quandt test for Heteroskedasticity | |||
| p-values | Alternative Hypothesis | ||
| breakpoint index | greater | 2-sided | less |
| 15 | 0.757946406021756 | 0.484107187956489 | 0.242053593978244 |
| 16 | 0.617358190855651 | 0.765283618288698 | 0.382641809144349 |
| 17 | 0.517872274624257 | 0.964255450751486 | 0.482127725375743 |
| 18 | 0.384856412163738 | 0.769712824327475 | 0.615143587836263 |
| 19 | 0.298977864051747 | 0.597955728103495 | 0.701022135948253 |
| 20 | 0.213020759475013 | 0.426041518950025 | 0.786979240524987 |
| 21 | 0.15507279875535 | 0.310145597510699 | 0.84492720124465 |
| 22 | 0.128883455871986 | 0.257766911743971 | 0.871116544128014 |
| 23 | 0.0873032751453111 | 0.174606550290622 | 0.912696724854689 |
| 24 | 0.122774994545826 | 0.245549989091651 | 0.877225005454174 |
| 25 | 0.0947716129439095 | 0.189543225887819 | 0.90522838705609 |
| 26 | 0.0737004220979405 | 0.147400844195881 | 0.92629957790206 |
| 27 | 0.0622750508204739 | 0.124550101640948 | 0.937724949179526 |
| 28 | 0.0581162281777592 | 0.116232456355518 | 0.94188377182224 |
| 29 | 0.132226621784006 | 0.264453243568013 | 0.867773378215994 |
| 30 | 0.10054868409075 | 0.201097368181501 | 0.89945131590925 |
| 31 | 0.066719359326869 | 0.133438718653738 | 0.933280640673131 |
| 32 | 0.0477940033870475 | 0.095588006774095 | 0.952205996612952 |
| 33 | 0.0755378294239392 | 0.151075658847878 | 0.924462170576061 |
| 34 | 0.120154599823938 | 0.240309199647876 | 0.879845400176062 |
| 35 | 0.0873831756825976 | 0.174766351365195 | 0.912616824317402 |
| 36 | 0.118387280809684 | 0.236774561619368 | 0.881612719190316 |
| 37 | 0.137236425118825 | 0.27447285023765 | 0.862763574881175 |
| 38 | 0.13724682729512 | 0.27449365459024 | 0.86275317270488 |
| 39 | 0.141153437935925 | 0.282306875871849 | 0.858846562064075 |
| 40 | 0.0974656236786571 | 0.194931247357314 | 0.902534376321343 |
| 41 | 0.0987817244362307 | 0.197563448872461 | 0.90121827556377 |
| 42 | 0.0842990166382117 | 0.168598033276423 | 0.915700983361788 |
| 43 | 0.0587356534988746 | 0.117471306997749 | 0.941264346501125 |
| 44 | 0.0494790113438121 | 0.0989580226876243 | 0.950520988656188 |
| 45 | 0.0309691072388391 | 0.0619382144776782 | 0.96903089276116 |
| 46 | 0.0289166327544402 | 0.0578332655088803 | 0.97108336724556 |
| 47 | 0.0190633930373673 | 0.0381267860747345 | 0.980936606962633 |
| 48 | 0.0196735139708662 | 0.0393470279417324 | 0.980326486029134 |
| 49 | 0.0224968681074126 | 0.0449937362148253 | 0.977503131892587 |
| 50 | 0.0158100964624381 | 0.0316201929248762 | 0.984189903537562 |
| 51 | 0.0206911813187252 | 0.0413823626374504 | 0.979308818681275 |
| 52 | 0.0161204281563727 | 0.0322408563127454 | 0.983879571843627 |
| Meta Analysis of Goldfeld-Quandt test for Heteroskedasticity | |||
| Description | # significant tests | % significant tests | OK/NOK |
| 1% type I error level | 0 | 0 | OK |
| 5% type I error level | 6 | 0.157894736842105 | NOK |
| 10% type I error level | 10 | 0.263157894736842 | NOK |