| Multiple Linear Regression - Estimated Regression Equation |
| vrijetijdsbesteding[t] = + 30.5494145341633 + 0.119037724082992bios[t] + 0.352061816366981schouwburg[t] + 0.441421037945499eedagsacttractie[t] -0.197117207935265huurDVD[t] + e[t] |
| Multiple Linear Regression - Ordinary Least Squares | |||||
| Variable | Parameter | S.D. | T-STAT H0: parameter = 0 | 2-tail p-value | 1-tail p-value |
| (Intercept) | 30.5494145341633 | 15.039442 | 2.0313 | 0.04716 | 0.02358 |
| bios | 0.119037724082992 | 0.041677 | 2.8562 | 0.006074 | 0.003037 |
| schouwburg | 0.352061816366981 | 0.032113 | 10.9631 | 0 | 0 |
| eedagsacttractie | 0.441421037945499 | 0.047899 | 9.2156 | 0 | 0 |
| huurDVD | -0.197117207935265 | 0.181806 | -1.0842 | 0.283085 | 0.141542 |
| Multiple Linear Regression - Regression Statistics | |
| Multiple R | 0.99401619029679 |
| R-squared | 0.988068186572143 |
| Adjusted R-squared | 0.98718434854045 |
| F-TEST (value) | 1117.92902222071 |
| F-TEST (DF numerator) | 4 |
| F-TEST (DF denominator) | 54 |
| p-value | 0 |
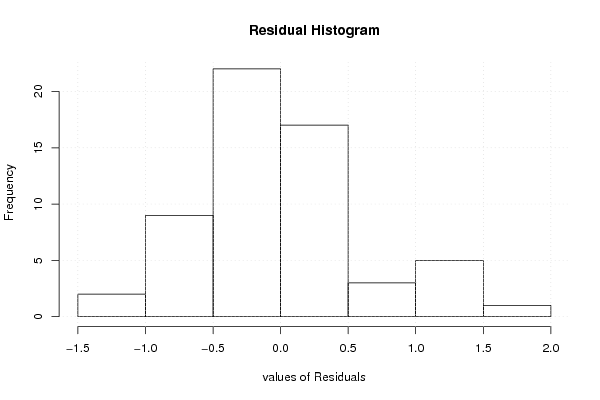
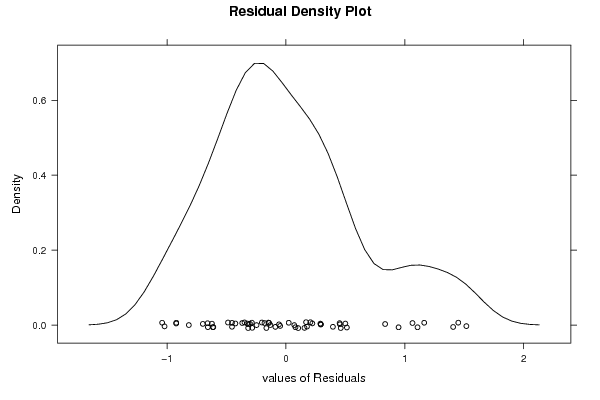
| Multiple Linear Regression - Residual Statistics | |
| Residual Standard Deviation | 0.64259719517157 |
| Sum Squared Residuals | 22.2982823830879 |
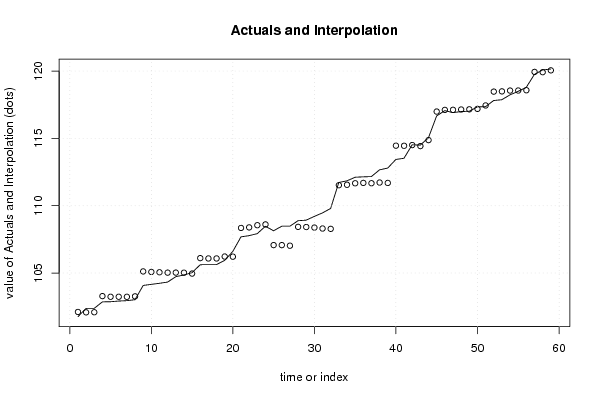
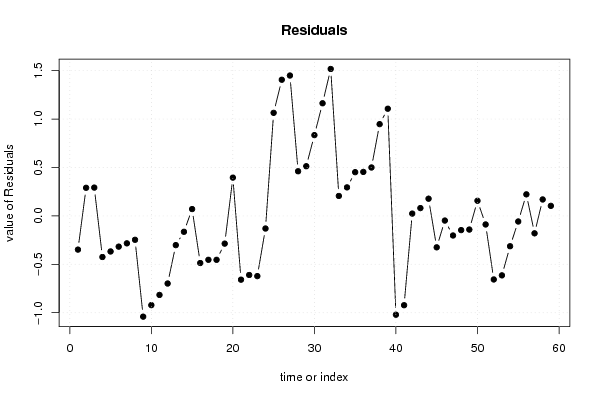
| Multiple Linear Regression - Actuals, Interpolation, and Residuals | |||
| Time or Index | Actuals | Interpolation Forecast | Residuals Prediction Error |
| 1 | 101.76 | 102.108249539626 | -0.348249539625742 |
| 2 | 102.37 | 102.079757225778 | 0.290242774221512 |
| 3 | 102.38 | 102.087641914096 | 0.292358085904087 |
| 4 | 102.86 | 103.284824728583 | -0.424824728582917 |
| 5 | 102.87 | 103.237516598678 | -0.36751659867845 |
| 6 | 102.92 | 103.237516598678 | -0.317516598678453 |
| 7 | 102.95 | 103.233574254520 | -0.283574254519745 |
| 8 | 103.02 | 103.267084179869 | -0.247084179868747 |
| 9 | 104.08 | 105.120900506038 | -1.04090050603842 |
| 10 | 104.16 | 105.081925016820 | -0.921925016819762 |
| 11 | 104.24 | 105.056299779788 | -0.81629977978818 |
| 12 | 104.33 | 105.028562378038 | -0.698562378037574 |
| 13 | 104.73 | 105.032082996201 | -0.30208299620124 |
| 14 | 104.86 | 105.024198307884 | -0.164198307883835 |
| 15 | 105.03 | 104.959456588994 | 0.0705434110060713 |
| 16 | 105.62 | 106.107151287652 | -0.487151287652227 |
| 17 | 105.63 | 106.0834972227 | -0.453497222700007 |
| 18 | 105.63 | 106.0834972227 | -0.453497222700007 |
| 19 | 105.94 | 106.226342491600 | -0.286342491599596 |
| 20 | 106.61 | 106.214515459123 | 0.395484540876522 |
| 21 | 107.69 | 108.348853518297 | -0.658853518297459 |
| 22 | 107.78 | 108.390516721726 | -0.610516721726502 |
| 23 | 107.93 | 108.552152832233 | -0.622152832233414 |
| 24 | 108.48 | 108.610481317034 | -0.130481317034084 |
| 25 | 108.14 | 107.075491797674 | 1.06450820232595 |
| 26 | 108.48 | 107.073520625595 | 1.40647937440531 |
| 27 | 108.48 | 107.030154839849 | 1.44984516015107 |
| 28 | 108.89 | 108.429038016947 | 0.460961983052936 |
| 29 | 108.93 | 108.417134244539 | 0.512865755461242 |
| 30 | 109.21 | 108.375739630872 | 0.834260369127633 |
| 31 | 109.47 | 108.306748608095 | 1.16325139190498 |
| 32 | 109.8 | 108.282172755665 | 1.5178272443354 |
| 33 | 111.73 | 111.524100217867 | 0.205899782132949 |
| 34 | 111.85 | 111.555395355823 | 0.294604644176539 |
| 35 | 112.12 | 111.668481193702 | 0.451518806297707 |
| 36 | 112.15 | 111.695744760343 | 0.454255239656895 |
| 37 | 112.17 | 111.670119523312 | 0.499880476688474 |
| 38 | 112.67 | 111.722457751942 | 0.94754224805805 |
| 39 | 112.8 | 111.692890170752 | 1.10710982924834 |
| 40 | 113.44 | 114.46060007867 | -1.02060007866994 |
| 41 | 113.53 | 114.452715390353 | -0.922715390352529 |
| 42 | 114.53 | 114.506282366190 | 0.0237176338101247 |
| 43 | 114.51 | 114.429406655095 | 0.0805933449048791 |
| 44 | 115.05 | 114.872342098582 | 0.177657901417867 |
| 45 | 116.67 | 116.994867095671 | -0.324867095671171 |
| 46 | 117.07 | 117.118340099714 | -0.0483400997136127 |
| 47 | 116.92 | 117.122282443872 | -0.202282443872311 |
| 48 | 117 | 117.146947523460 | -0.146947523459616 |
| 49 | 117.02 | 117.161232050350 | -0.141232050349579 |
| 50 | 117.35 | 117.193781818254 | 0.156218181745704 |
| 51 | 117.36 | 117.448549338825 | -0.0885493388252743 |
| 52 | 117.82 | 118.476581523753 | -0.656581523753373 |
| 53 | 117.88 | 118.494398812400 | -0.614398812399727 |
| 54 | 118.24 | 118.553546462005 | -0.31354646200501 |
| 55 | 118.5 | 118.557898388566 | -0.0578983885660175 |
| 56 | 118.8 | 118.577610109360 | 0.222389890640454 |
| 57 | 119.76 | 119.940089338700 | -0.180089338699758 |
| 58 | 120.09 | 119.920377617906 | 0.169622382093766 |
| 59 | 120.16 | 120.056362608640 | 0.103637391359820 |
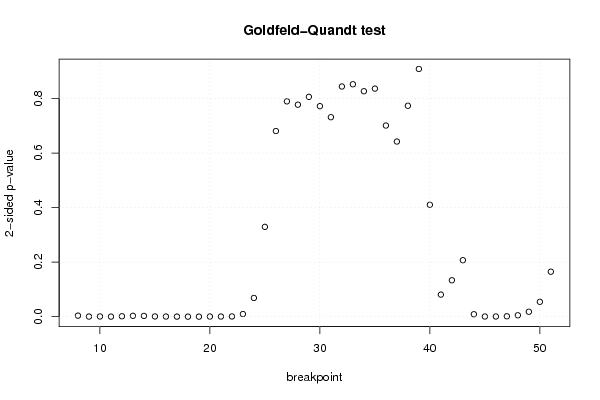
| Goldfeld-Quandt test for Heteroskedasticity | |||
| p-values | Alternative Hypothesis | ||
| breakpoint index | greater | 2-sided | less |
| 8 | 0.00189939408454785 | 0.00379878816909569 | 0.998100605915452 |
| 9 | 0.000196042168738265 | 0.00039208433747653 | 0.999803957831262 |
| 10 | 0.000393444255389006 | 0.000786888510778012 | 0.99960655574461 |
| 11 | 9.58428316132757e-05 | 0.000191685663226551 | 0.999904157168387 |
| 12 | 0.000721588258076576 | 0.00144317651615315 | 0.999278411741923 |
| 13 | 0.00153121607452339 | 0.00306243214904677 | 0.998468783925477 |
| 14 | 0.00136197193023516 | 0.00272394386047033 | 0.998638028069765 |
| 15 | 0.000464737692344033 | 0.000929475384688065 | 0.999535262307656 |
| 16 | 0.000242643102891222 | 0.000485286205782443 | 0.999757356897109 |
| 17 | 0.000113401902750261 | 0.000226803805500523 | 0.99988659809725 |
| 18 | 5.73520797175512e-05 | 0.000114704159435102 | 0.999942647920282 |
| 19 | 3.54653485324525e-05 | 7.09306970649049e-05 | 0.999964534651468 |
| 20 | 0.000217585687204713 | 0.000435171374409425 | 0.999782414312795 |
| 21 | 0.000239250916308418 | 0.000478501832616836 | 0.999760749083692 |
| 22 | 0.000367210756198378 | 0.000734421512396756 | 0.999632789243802 |
| 23 | 0.0048240010779645 | 0.009648002155929 | 0.995175998922035 |
| 24 | 0.0343076286227614 | 0.0686152572455229 | 0.965692371377239 |
| 25 | 0.164654566861623 | 0.329309133723246 | 0.835345433138377 |
| 26 | 0.340383743278409 | 0.680767486556819 | 0.659616256721591 |
| 27 | 0.394803245782915 | 0.78960649156583 | 0.605196754217085 |
| 28 | 0.388690987412482 | 0.777381974824964 | 0.611309012587518 |
| 29 | 0.403028080852865 | 0.80605616170573 | 0.596971919147135 |
| 30 | 0.385986153091527 | 0.771972306183054 | 0.614013846908473 |
| 31 | 0.365734139561010 | 0.731468279122021 | 0.63426586043899 |
| 32 | 0.422034780249257 | 0.844069560498514 | 0.577965219750743 |
| 33 | 0.426147267041596 | 0.852294534083192 | 0.573852732958404 |
| 34 | 0.413366356082934 | 0.826732712165867 | 0.586633643917066 |
| 35 | 0.581856248258073 | 0.836287503483855 | 0.418143751741927 |
| 36 | 0.649572551277578 | 0.700854897444844 | 0.350427448722422 |
| 37 | 0.678857438690081 | 0.642285122619838 | 0.321142561309919 |
| 38 | 0.613271631042193 | 0.773456737915614 | 0.386728368957807 |
| 39 | 0.545780384578332 | 0.908439230843336 | 0.454219615421668 |
| 40 | 0.79483745140399 | 0.410325097192019 | 0.205162548596009 |
| 41 | 0.959523557092634 | 0.0809528858147328 | 0.0404764429073664 |
| 42 | 0.933247230058293 | 0.133505539883415 | 0.0667527699417073 |
| 43 | 0.896440220425651 | 0.207119559148697 | 0.103559779574349 |
| 44 | 0.995557907086354 | 0.00888418582729244 | 0.00444209291364622 |
| 45 | 0.999691506428725 | 0.000616987142550151 | 0.000308493571275076 |
| 46 | 0.999652573748507 | 0.000694852502985126 | 0.000347426251492563 |
| 47 | 0.999279704836416 | 0.00144059032716703 | 0.000720295163583516 |
| 48 | 0.997416001094168 | 0.00516799781166453 | 0.00258399890583227 |
| 49 | 0.990996750188208 | 0.0180064996235846 | 0.00900324981179231 |
| 50 | 0.972742466776135 | 0.0545150664477299 | 0.0272575332238649 |
| 51 | 0.91755282315295 | 0.164894353694099 | 0.0824471768470496 |
| Meta Analysis of Goldfeld-Quandt test for Heteroskedasticity | |||
| Description | # significant tests | % significant tests | OK/NOK |
| 1% type I error level | 21 | 0.477272727272727 | NOK |
| 5% type I error level | 22 | 0.5 | NOK |
| 10% type I error level | 25 | 0.568181818181818 | NOK |